


For Developers >
Design Documents >
Pepper plugin implementation
|
This document provides a quick reference for PPAPI integration in Chromium.
If you're adding a new API, see
Pepper API Best Practices for helpful guidelines and our process is documented in
Pepper API Proposals.
Quick reference to important code locations
Issue tracking
We're tracking PPAPI bugs in the Chromium issue tracker to keep things simpler. To file a pepper-related bug, use
all of the following labels:
If the bug relates to a Native Client specific part, additionally use the label:
Running a plugin in Chrome
There are two modes of operation, "trusted" and "untrusted" plugins. Untrusted plugins use the
Native Client to safely run code from the web and is cross-platform. Trusted plugins are loaded directly in either the renderer process or a separate plugin process as platform-specific libraries.
You run a plugin in trusted mode by building a platform-specific library implementing the API. For random manual testing, you can use one of the examples, the graphics 2D "paint manager" example is a good one for general hacking (see
ppapi/examples/2d/). A trusted plugin is instantiated by registering it to handle a MIME type on the command line. Provide the full plugin name (which varies by platform), followed by a semicolon, followed by the MIME type. The MIME type should match the "type" attribute of the object tag specified on your page. For the paint manager example plugin on Linux, you would run:
chrome --register-pepper-plugins="/local/src/out/Debug/lib/libppapi_example_paint_manager.so;application/x-ppapi-example-2d" file:///local/src/ppapi/examples/2d/2d.html
In this case,
application/x-ppapi-example-2d is what is specified in the
example.html page. This can be anything you want, as long as the two types match. Note also that we specify --ppapi-out-of-process
. In-process mode is being deprecated so it's a good idea to use this in general.
On Linux, you can automatically launch this process in a new GDB instance in a new xterm, which will help you in debugging startup problems. Use this command line switch:
"Old" resource and proxy design
Most resources are currently implemented using the old proxy design. There are several layers, and each resource is implemented once for in-process and once for out-of-process.
The in-process implementations are in
content/renderer/pepper/ppb_*_impl.* These integrate with the rest of Chrome by using blink or other parts of content/renderer.
The proxy implements interfaces for the out-of-process case. They are implemented in
ppapi/proxy/ppb_*_proxy.* The proxy has a
ppapi/proxy/dispatcher.h on each end of the IPC channel. The specialization
PluginDispatcher is on the plugin side, and the specialization
HostDispatcher is on the renderer side. Each interface has a Proxy object for which there is one per dispatcher, and a resource object that corresponds to the PP_Resource object.
Some proxy objects and implementations share some or all of their code. Shared code can be put into
ppapi/shared_impl/ppb_*_shared.* to avoid duplication.
Life cycle of a plugin -> renderer call:
Unlike the "new" design there is no standard way of communicating with the browser. Some components (TCP/UDP sockets) do this with hand-rolled tracking.
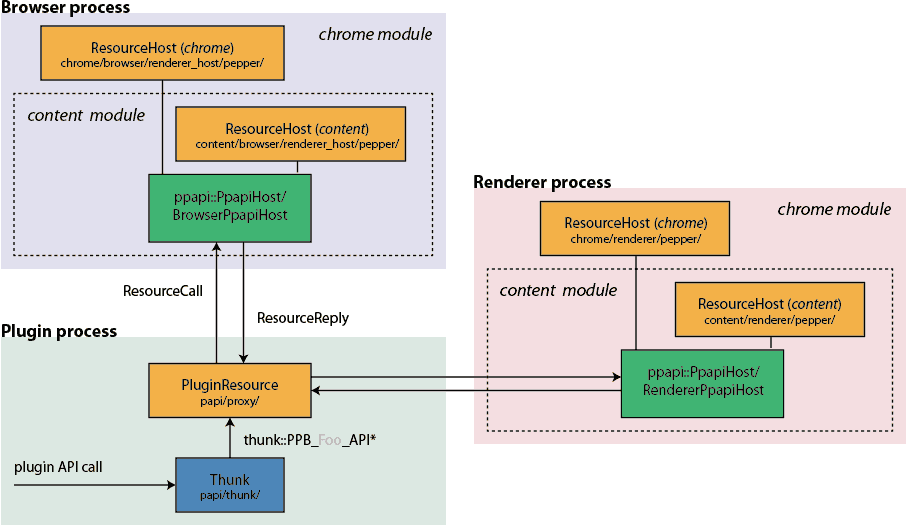
"New" resource and proxy design
All additions should use the new proxy design. It is higher performance and involves writing much less code. The new and old designs exist in parallel and we're moving resources over one-by-one.
The resource object is implemented once (in
ppapi/proxy/*_resource.cc). This resource sends IPC to a "host" object in the browser and/or renderer process to do its work. The host object does not speak the Pepper API, it just uses Chrome IPC types. It can be in the renderer process, the browser process, or potentially both or neither (if all functionality is contained in the plugin process). It can also be implemented in the chrome or the content modules.
Where does your host object live?
We support in-process mode for legacy interfaces needed by certain plugins. New resources do not need to support in-process. For resources that need in-process, we have a "fake" IPC channel that allows the "proxy" and "host" to be in the same process. To wire this up, first get your out-of-process implementation working, then hook up creation through
content/renderer/pepper/pepper_in_process_resource_creation.cc
. Note that this only works for resources implemented in
content/renderer
. Other types of hosts are not supported in in-process mode.
Life cycle of a plugin -> renderer call
Note that creation is a separate step. The resource creates the host in the browser or renderer by calling
SendCreateToBrowser or
SendCreateToRenderer. This is picked up by the host factory in the directory holding the resource.
Adding a new interface
Please look at our Pepper API Process Doc before starting to implement a new API.
To make the interface definitions (this is the same between the "new" and "old" proxy designs):
Implement the resource "host" (this is different from the "old" design):
Designing your interface
Features are implemented as "interfaces." An interface is just a vtable identified by a string name. Most features are implemented as "resources" which are generic refcounted project identified by an opaque handle. Your normally have an interface that exposes all the functions your resource supports.
Writing error logs
In a resource implementation, use
Resource.Log() to display a message in the console (in the JS inspector) for the page. In other places, use
PpapiGlobals::LogWithSource().
Architecture of the renderer implementation
It may help to open the NPAPI
plugin architecture design doc in another tab. This section will compare Pepper to the "in process" NPAPI implementation. Most of the names are the same between Pepper and NPAPI, except we use the
webkit::ppapi namespace and NPAPI uses the
webkit::npapi namespace. If you haven't already, you should also understand the
important concepts of PPAPI.
Debugging a plugin
Trusted plugins are loaded directly into the renderer sub-process, rather than a separate plugin process. You can use the standard renderer debugging techniques, including single process mode, for debugging the plugin.
Plugins also run in the renderer sandbox. You will find your plugin code is constrained to the same requirements and limitations as other code in the renderer (can't read and write files or directly access devices).
Running the tests
The tests in
ppapi/tests are run as part of the Chrome
browser_tests. The source code is in
chrome/test/ppapi and you can see in that file there are separate GTest tests for each PPAPI test file. To just run this test, you can use:
Or to run tests out of process:
You can also run the tests manually in Chrome. You first need to build the test plugin, which is the
ppapi_tests
project, and build Chrome (PPAPI doesn't work in test shell). When running Chrome, enable the PPAPI testing interface (it's off by default to prevent production plugins from abusing this API) and register the test plugin as handling the
application/x-ppapi-tests
MIME type:
chrome --register-pepper-plugins="C:\code\src\chrome\Debug\ppapi_tests.dll#PPAPI Tests##1.2.3 ;application/x-ppapi-tests" --enable-pepper-testing
The library name is platform-specific. On Linux, use
libppapi_tests.so
in the output directory. On Mac, use
ppapi_tests.plugin
.
Once Chrome is running, just load the
test_case.html
file in the browser. Set the "query" part of the URL to be the name of the test you want to run, for example to run the ImageData tests, load:
file:///C:/code/src/ppapi/tests/test_case.html?ImageData
You will see a log of the test cases in the gray square. If the plugin doesn't load, you will see an error message above the gray square indicating that the plugin could not be found. This means that the library name is incorrect or it failed to load for some reason.
Running HTTP tests manually
Some tests like the URLLoader test require that it be run over HTTP. The Chrome browser tests are configured to automatically do this. But for debugging purposes you may want to do this manually. From your
src
directory on Linux, do:
and on Windows, use:
Then you should be able to load http://127.0.0.1:1337/files/test_case.html in your browser. Running NaCl tests manually
The NaCl tests also must be run over HTTP, but they are loaded from the build output directory instead of ppapi/tests. So to start the test server for NaCl tests on Linux for a Debug build, do:
and on Windows, use: set PYTHONPATH=third_party\pyftpdlib\src;third_party\tlslite;third_party\pywebsocket\src chrome --enable-nacl --enable-pepper-testing
You must append "
&mode=nacl_glibc
" or "
&mode=nacl_newlib
" to the URL. E.g.: load
http://127.0.0.1:1337/files/test_case.html?testcase=URLLoader&mode=nacl_glibc
in your browser.
Testing with FlashRunning a local build with Flash is slightly different. You can usually run a local build of Chromium with a Flash plugin that comes with a recent Chrome distribution (for example, Canary or Dev Channel) using --ppapi-flash-path and --ppapi-flash-version (gotten from the "Manifest.json" file that is bundled alongside the Flash plugin in Chrome. For example, on Linux you could type:
Instead of specifying the matching flash version you can specify 99.99.99.99, like this: --ppapi-flash-version=99.99.99.99. This gives a possible command line for Windows of this:out\release_component\chrome.exe --ppapi-flash-path="%localappdata%\Google\Chrome SxS\User Data\PepperFlash\25.0.0.119\pepflashplayer.dll" --ppapi-flash-version=99.99.99.99
There are no specific gn args needed to run flash in a local build - non-official, component, and debug/release builds all work fine.
Make sure that the bitness (32-bit versus 64-bit) of your local build matches that of the DLL that you specify.
|


 4848
4848

 被折叠的 条评论
为什么被折叠?
被折叠的 条评论
为什么被折叠?
 到【灌水乐园】发言


