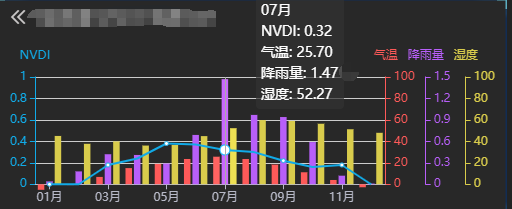
多轴图表配置

 版本3.X

多轴图表

qixndviChart.setOption({
                    color: colors,
                    title: {
                        top: 20,
                        text: '',
                        textStyle: {
                            fontWeight: 'normal',
                            fontSize: 16,
                            color: '#F1F1F3'
                        },
                        left: '1%'
                    },
                    tooltip: {
                        trigger: 'axis',
                        axisPointer: {
                            // type: 'cross'
                        }
                    },
                    tooltip: {
                        trigger: 'axis',
                        formatter: function (params) {
                            var nvdi = params[0];
                            var wendu = params[1];
                            var rain = params[2];
                            var shidu = params[3];
                            return nvdi.name + '<br/>' + nvdi.seriesName + ': ' + nvdi.value/100 + '<br/>'
                                + wendu.seriesName + ': ' + wendu.value+'<br/>'
                                + rain.seriesName + ': ' + rain.value/100+'<br/>'
                                + shidu.seriesName + ': ' + shidu.value+'<br/>'
                        }
                    },
                    grid: {
                        top: '25%',
                        left: '1%',
                        right: '5%',
                        bottom: '1%',
                        containLabel: true,
                    },
                    // legend: {
                    //     top: '1.2%',
                    //     left: '1%',
                    //     icon: 'diamond',
                    //     itemWidth: 10,
                    //     itemHeight: 10,
                    //     itemGap: 10,
                    //     data:['蒸发量','降水量','平均温度'],
                    //     right: '4%',
                    //     textStyle: {
                    //         fontSize: 11,
                    //         color: '#F1F1F3'
                    //     }
                    // },
                    xAxis: [
                        {
                            type: 'category',
                            axisLine: {
                                lineStyle: {
                                    color: '#b8bac8',
                                },
                            },
                            axisTick: {
                                alignWithLabel: true
                            },
                            // data: ['1月','2月','3月','4月','5月','6月','7月','8月','9月','10月','11月','12月']
                            data: months
                        }
                    ],
                    yAxis: [
                        {
                            type: 'value',
                            name: 'NVDI',
                            min: 0,
                            max: 100,
                            position: 'left',
                            axisLine: {
                                lineStyle: {
                                    color: colors[0],
                                    normal: {
                                        width: 2,
                                        type: 'dashed'
                                    }
                                }
                            },
                            axisLabel: {
                                formatter: function (value, index) {
                                    return value/100
                                }
                            }
                        },
                        {
                            type: 'value',
                            name: '气温',
                            min: 0,
                            max: 100,
                            position: 'right',
                            axisLine: {
                                lineStyle: {
                                    color: colors[1]
                                }
                            },
                            // axisLabel: {
                            //     formatter: function (value, index) {
                            //         return value/100
                            //     }
                            // }
                        },
                        {
                            type: 'value',
                            name: '降雨量',
                            min: 0,
                            max: 150,
                            position: 'right',
                            offset: 40,
                            axisLine: {
                                lineStyle: {
                                    color: colors[2]
                                }
                            },
                            axisLabel: {
                                formatter: function (value, index) {
                                    return value/100
                                }
                            }
                        },
                        {
                            type: 'value',
                            name: '湿度',
                            min: 0,
                            max: 100,
                            position: 'right',
                            offset: 80,
                            axisLine: {
                                lineStyle: {
                                    color: colors[3]
                                }
                            },
                            axisLabel: {
                                formatter: '{value} '
                            }
                        }

                    ],
                    series: [
                        {
                            name:'NVDI',
                            type:'line',
                            yAxisIndex: 1,
                            // data:[200.0, 200.2, 300.3, 400.5, 60.3, 100.2, 200.3, 230.4, 2300.0, 160.5, 120.0, 600.2]
                            data:datas_ndvi
                        },
                        {
                            name:'气温',
                            type:'bar',
                            // data:[2.0, 4.9, 7.0, 23.2, 25.6, 76.7, 135.6, 162.2, 32.6, 20.0, 6.4, 3.3]
                            data:datas_wendu
                        },
                        {
                            name:'降雨量',
                            type:'bar',
                            yAxisIndex: 2,
                            // data:[2.6, 5.9, 9.0, 26.4, 28.7, 70.7, 175.6, 182.2, 48.7, 18.8, 6.0, 2.3]
                            data:datas_rain
                        },
                        {
                            name:'湿度',
                            type:'bar',
                            yAxisIndex: 3,
                            // data:[100.6, 10.9, 19.0, 36.4, 48.7, 60.7, 195.6, 282.2, 38.7, 88.8, 16.0, 22.3]
                            data:datas_shidu
                        }
                    ]
                })
2ec1fda6f5b00ab366b27a25afc3c764725.jpg


转载于:https://my.oschina.net/matt0614/blog/3003223

  • 0
    点赞
  • 0
    收藏
    觉得还不错? 一键收藏
  • 0
    评论

“相关推荐”对你有帮助么?

  • 非常没帮助
  • 没帮助
  • 一般
  • 有帮助
  • 非常有帮助
提交
评论
添加红包

请填写红包祝福语或标题

红包个数最小为10个

红包金额最低5元

当前余额3.43前往充值 >
需支付:10.00
成就一亿技术人!
领取后你会自动成为博主和红包主的粉丝 规则
hope_wisdom
发出的红包
实付
使用余额支付
点击重新获取
扫码支付
钱包余额 0

抵扣说明:

1.余额是钱包充值的虚拟货币,按照1:1的比例进行支付金额的抵扣。
2.余额无法直接购买下载,可以购买VIP、付费专栏及课程。

余额充值