


环境情况:
系统:CentOS release 6.4 (Final),2.6.32-358.el6.x86_64
haproxy版本:1.4.25
haproxy节点:10.0.60.190
mysql集群:10.0.60.104(mariadb01)、10.0.60.105(mariadb02)、10.0.60.106(mariadb03)
Haproxy是一个反向代理负载均衡解决方案,支持4层和7层模式,提供后端服务器健康检查,非常稳定。淘宝前期也使用Haproxy作为CDN系统负载均衡器。
一、安装haproxy
tar xvf haproxy-1.4.25.tar.gz
cd haproxy-1.4.25
make TARGET=linux2628
make install
二、配置haproxy
mkdir /etc/haproxy
cd examples/
cp haproxy.cfg /etc/haproxy/
简单配置文件:
# cat /etc/haproxy/haproxy.cfg
# this config needs haproxy-1.1.28 or haproxy-1.2.1
global #全局参数
        log 127.0.0.1   local0 #定义日志输出到哪里,以及日志级别,格式log <address> <facility> [max level [min level]],使用ip地址,默认使用udp 514端口,可以配置两种日志,一种进程启动和退出,一种代理日志
        log 127.0.0.1   local1 notice
        maxconn 4096 #每个进程的最大并发连接数
        #ulimit-n 10240 #每个进程的文件描述符,默认根据maxconn值自动计算
        chroot /usr/share/haproxy #安全目录,需要root权限启动haproxy
        uid 99 #进程的用户ID,必须使用root用户运行,交换到指定的用户,也可以使用user
        gid 99 #进程的组ID,也可以使用group指定组名
        daemon #后台运行,等同于命令行参数-D
        #nbproc 2 多进程模式,默认只开启一个进程
        pidfile /var/run/haproxy/haproxy.pid
        #stats socket /var/run/haproxy/haproxy.sock level operator #能接收各种状态输出,以及能接收命令输入
        #debug
        #quiet
defaults
        log     global #使用global段的日志定义
        mode    http #设置实例运行模式或协议,支持http、tcp和health,frontend和backend要一致
        option  tcplog #启用记录tcp连接的日志,包含会话状态和时间,连接数,frontend、backend和server name,源地址和端口,当使用tcp模式时能找出客户端、服务器断开连接或超时。
        option  dontlognull #不记录来自监控状态检查的空连接
        retries 3 #连接错误后,重传次数
        option  redispatch #连接错误,启用会话重新分配
        maxconn 2000
        timeout connect      5000 #单位为毫秒,等待成功连接到服务器的最大时间值
        timeout client      50000 #设置在客户端侧的最大不活跃时间值,在TCP模式,最好跟服务器侧一致
        timeout server      50000 #设置在服务端侧的最大不活跃时间值,
frontend pxc-front  #描述允许客户端连接的监听套接字
        bind    *:3306
        mode    tcp
        default_backend pxc-back #当没有匹配use_backend时,默认的backend
frontend stats-front
        bind    *:80
        mode    http
        default_backend stats-back
backend pxc-back #描述进来的连接将转发到哪些后端服务器
        mode    tcp
        balance leastconn    #负载均衡算法,使用最少连接算法,适合长连接应用
        option httpchk #启用HTTP协议检查服务器监控状态,通过调用脚本检查节点的状态
        server mariadb01 10.0.60.104:3306 check port 9200 inter 12000 rise 3 fall 3 #fall连续3次检查错误后,将表明服务器死亡,默认为3;inter连续两次检查的间隔时间值,单位为毫秒,默认为2s;rise连续3次检查成功,表明服务可用
        server mariadb02 10.0.60.105:3306 check port 9200 inter 12000 rise 3 fall 3
        server mariadb03 10.0.60.106:3306 check port 9200 inter 12000 rise 3 fall 3
        #option  mysql-check user haproxy_check #使用Mysql健康检查,不检查数据库和数据一致性,需要在mysql上创建相应的检查帐户
        #server  mariadb01 10.0.60.104:3306 check
        #server  mariadb02 10.0.60.105:3306 check
        #server  mariadb03 10.0.60.106:3306 check
backend stats-back  #开启haproxy的状态页面
        mode http
        balance roundrobin
        stats   uri /haproxy/stats #定义访问统计信息的URI
        stats   auth    admin:admin #设置查看统计信息的用户名和密码
在每个mysql集群节点(集群环境同"部署Mariadb Galera Cluster高可用和多Master集群")安装mysql健康状态检查脚本:
1、拷贝脚本
cd /opt/PXC/
cp bin/clustercheck /usr/bin/
cp xinetd.d/mysqlchk /etc/xinetd.d/
2、添加服务端口:
echo 'mysqlchk 9200/tcp # mysqlchk' >> /etc/services3、安装和启动xinetd服务
yum -y install xinetd
/etc/init.d/xinetd restart
chkconfig --level 2345 xinetd on
4、创建mysql的检查帐户,如不使用默认用户名和密码,将需要修改脚本
grant process on *.* to 'clustercheckuser'@'localhost' identified by 'clustercheckpassword!';5、测试
# clustercheckHTTP/1.1 200 OK
Content-Type: text/plain
Connection: close
Content-Length: 40
Percona XtraDB Cluster Node is synced.
# curl -I 127.0.0.1:9200HTTP/1.1 200 OK #要保证返回是200状态码
Content-Type: text/plain
Connection: close
Content-Length: 40
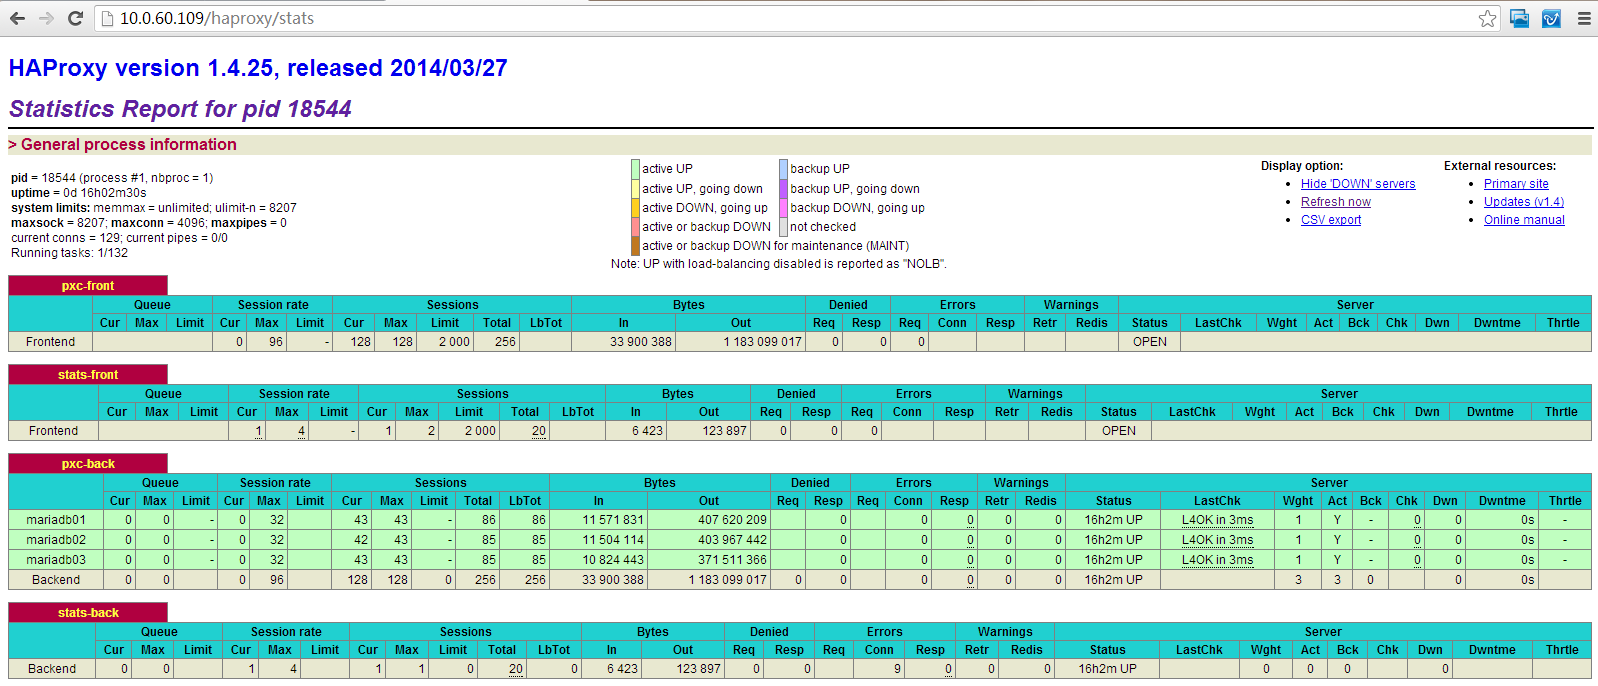
三、启动haproxy
haproxy -f /etc/haproxy/haproxy.cfg查看状态界面:
四、扩展部分
1、haproxy可以安装在mysql集群节点,但需要将mysql节点监听在非3306端口,以让haproxy监控在3306端口;
2、为了保证haproxy的高可用,可以结合keepalived;
3、可以使用haproxy做mysql只读库的负载均衡;
五、使用VIP地址进行Mysql测试
创建测试账号:
GRANT ALL PRIVILEGES ON *.* TO 'sysbench'@'%' IDENTIFIED BY PASSWORD 'sysbench'注:其实可以只允许haproxy侧的IP访问即可,因用户通过vip访问mysql集群,haproxy根据调度策略使用自己的ip创建与后端mysql服务器的连接。
进行测试:
3台1核心 2G的xen server虚拟机环境
#  ./sysbench --test=tests/db/oltp.lua --mysql-engine-trx=yes --mysql-host=10.0.60.109 --mysql-user=sysbench --mysql-password=sysbench --mysql-db=test --mysql-table-engine=innodb --num-threads=32 --max-time=60 --report-interval=5 run
sysbench 0.5:  multi-threaded system evaluation benchmark
Running the test with following options:
Number of threads: 32
Report intermediate results every 5 second(s)
Random number generator seed is 0 and will be ignored
Threads started!
[   5s] threads: 32, tps: 0.00, reads/s: 0.00, writes/s: 0.00, response time: 0.00ms (95%)
[  10s] threads: 32, tps: 0.00, reads/s: 0.00, writes/s: 0.00, response time: 0.00ms (95%)
[  15s] threads: 32, tps: 432.40, reads/s: 9881.39, writes/s: 2725.40, response time: 195.12ms (95%)
[  20s] threads: 32, tps: 421.20, reads/s: 9759.22, writes/s: 2705.60, response time: 179.22ms (95%)
[  25s] threads: 32, tps: 425.20, reads/s: 9728.21, writes/s: 2695.00, response time: 178.74ms (95%)
[  30s] threads: 32, tps: 423.80, reads/s: 9811.41, writes/s: 2709.00, response time: 186.11ms (95%)
OLTP test statistics:
    queries performed:
        read:                            229628
        write:                           63625
        other:                           26402
        total:                           319655
    transactions:                        10000  (298.56 per sec.)
    deadlocks:                           6402   (191.14 per sec.)
    read/write requests:                 293253 (8755.31 per sec.)
    other operations:                    26402  (788.25 per sec.)
General statistics:
    total time:                          33.4943s
    total number of events:              10000
    total time taken by event execution: 749.8922s
    response time:
         min:                                 18.51ms
         avg:                                 74.99ms
         max:                                890.31ms
         approx.  95 percentile:             183.95ms
Threads fairness:
    events (avg/stddev):           312.5000/97.68
    execution time (avg/stddev):   23.4341/0.02


 380
380

 被折叠的 条评论
为什么被折叠?
被折叠的 条评论
为什么被折叠?
 到【灌水乐园】发言


