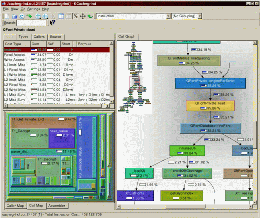
kcachegrind gui for callgrind


Documentation
Screenshots
Download/Sources
Links
Roadmap
Bugs & Wishes


This is the homepage of the profiling tool Callgrind and the profile data visualization KCachegrind. Both are licensed under GPL V2.

Callgrind uses runtime instrumentation via the Valgrind framework for its cache simulation and call-graph generation. This way, even shared libraries and dynamically opened plugins can be profiled. The data files generated by Callgrind can be loaded into KCachegrind for browsing the performance results. But there is also a command line tool in the package to get ASCII reports from data files without the need to use KCachegrind.

The format of Callgrind output is documented here. With conversion scripts, KCachegrind is able to visualize output of other profilers like OProfile, a system-wide profiler for Linux using statistical sampling with hardware performance counters. There also exist converters for profiling output of Python, PHP and PERL.


Current Releases

  • KCachegrind 0.7.4 (includes qcachegrind, just needs Qt4 or Qt5)
  • for Callgrind, install Valgrind 3.8.x


Requirements

  • Callgrind: part of Valgrind (supports Linux on x86, amd64, arm7, ...)
  • KCachegrind:
    • Libraries and development files for KDE 4.4 or higher
    • Commands 'dot' (GraphViz) for call graph, and 'objdump' (BinUtils) for assembler view (these are runtime requirements, not needed for compilation)
  • QCachegrind (included in KCachegrind sources)
    • Qt5 or Qt4.x (x>=4) or higher
    • 'dot' binary for call graph and 'objdump' binary for annotated machine code


News

Old News...


  • 0
    点赞
  • 0
    收藏
    觉得还不错? 一键收藏
  • 0
    评论

“相关推荐”对你有帮助么?

  • 非常没帮助
  • 没帮助
  • 一般
  • 有帮助
  • 非常有帮助
提交
评论
添加红包

请填写红包祝福语或标题

红包个数最小为10个

红包金额最低5元

当前余额3.43前往充值 >
需支付:10.00
成就一亿技术人!
领取后你会自动成为博主和红包主的粉丝 规则
hope_wisdom
发出的红包
实付
使用余额支付
点击重新获取
扫码支付
钱包余额 0

抵扣说明:

1.余额是钱包充值的虚拟货币,按照1:1的比例进行支付金额的抵扣。
2.余额无法直接购买下载,可以购买VIP、付费专栏及课程。

余额充值