


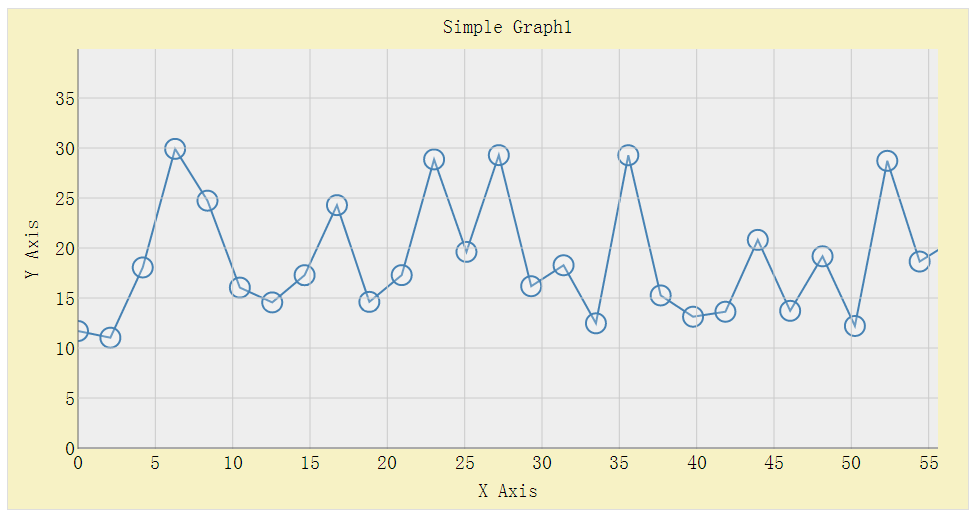
This example is a mashup of the D3 Zoom-Pan example along with Ricardo Marimon's example of X-axis re-scaling by dragging.
- Drag on the canvas to translate/pan the graph.
- double-click on the canvas to zoom in
- shift-double-click on the canvas to zoom out
- Drag on one of the X or Y axis numeric labels to re-scale that axis
- click on a data point to select it
- drag a selected data point up or down to change it's Y value
- enter the delete or backspace key to delete a selected data point
- hold the ALT/Option key down and click an empty area of the graph to add a data point
Most of the UI should also work with the touch events generated by a tablet or SmartPhone.
source: gist.github.com/1182434
<!DOCTYPE html>
<html>
  <head>
    <meta http-equiv="Content-Type" content="text/html;charset=utf-8">
    <title>One Graph</title>
    <script type="text/javascript" src="http://mbostock.github.com/d3/d3.v2.js"></script>
    <script type="text/javascript" src="simple-graph.js"></script>
    <style type="text/css">
      body { font: 13px sans-serif; }
      rect { fill: #fff; }
      ul {
        list-style-type: none;
        margin: 0.5em 0em 0.5em 0em;
        width: 100%; }
        ul li {
          display: table-cell;
          vertical-align: middle;
          margin: 0em;
          padding: 0em 1em; }
      .axis { font-size: 1.5em; }
      .chart {
        background-color: #F7F2C5;
        width: 960px;
        height: 500px; }
      circle, .line {
        fill: none;
        stroke: steelblue;
        stroke-width: 2px; }
      circle {
        fill: white;
        fill-opacity: 0.2;
        cursor: move; }
        circle.selected {
          fill: #ff7f0e;
          stroke: #ff7f0e; }
        circle:hover {
          fill: #ff7f0e;
          stroke: #707f0e; }
        circle.selected:hover {
          fill: #ff7f0e;
          stroke: #ff7f0e; }
    </style>
  </head>
  <body>
    <div id="chart1" class="chart"></div>
    <script type="text/javascript">
      graph = new SimpleGraph("chart1", {
          "xmax": 60, "xmin": 0,
          "ymax": 40, "ymin": 0,
          "title": "Simple Graph1",
          "xlabel": "X Axis",
          "ylabel": "Y Axis"
        });
    </script>
  </body>
</html>
registerKeyboardHandler = function(callback) {
var callback = callback;
d3.select(window).on("keydown", callback);
};
SimpleGraph = function(elemid, options) {
var self = this;
this.chart = document.getElementById(elemid);
this.cx = this.chart.clientWidth;
this.cy = this.chart.clientHeight;
this.options = options || {};
this.options.xmax = options.xmax || 30;
this.options.xmin = options.xmin || 0;
this.options.ymax = options.ymax || 10;
this.options.ymin = options.ymin || 0;
this.padding = {
"top": this.options.title ? 40 : 20,
"right": 30,
"bottom": this.options.xlabel ? 60 : 10,
"left": this.options.ylabel ? 70 : 45
};
this.size = {
"width": this.cx - this.padding.left - this.padding.right,
"height": this.cy - this.padding.top - this.padding.bottom
};
// x-scale
this.x = d3.scale.linear()
.domain([this.options.xmin, this.options.xmax])
.range([0, this.size.width]);
// drag x-axis logic
this.downx = Math.NaN;
// y-scale (inverted domain)
this.y = d3.scale.linear()
.domain([this.options.ymax, this.options.ymin])
.nice()
.range([0, this.size.height])
.nice();
// drag y-axis logic
this.downy = Math.NaN;
this.dragged = this.selected = null;
this.line = d3.svg.line()
.x(function(d, i) { return this.x(this.points[i].x); })
.y(function(d, i) { return this.y(this.points[i].y); });
var xrange = (this.options.xmax - this.options.xmin),
yrange2 = (this.options.ymax - this.options.ymin) / 2,
yrange4 = yrange2 / 2,
datacount = this.size.width/30;
this.points = d3.range(datacount).map(function(i) {
return { x: i * xrange / datacount, y: this.options.ymin + yrange4 + Math.random() * yrange2 };
}, self);
this.vis = d3.select(this.chart).append("svg")
.attr("width", this.cx)
.attr("height", this.cy)
.append("g")
.attr("transform", "translate(" + this.padding.left + "," + this.padding.top + ")");
this.plot = this.vis.append("rect")
.attr("width", this.size.width)
.attr("height", this.size.height)
.style("fill", "#EEEEEE")
.attr("pointer-events", "all")
.on("mousedown.drag", self.plot_drag())
.on("touchstart.drag", self.plot_drag())
this.plot.call(d3.behavior.zoom().x(this.x).y(this.y).on("zoom", this.redraw()));
this.vis.append("svg")
.attr("top", 0)
.attr("left", 0)
.attr("width", this.size.width)
.attr("height", this.size.height)
.attr("viewBox", "0 0 "+this.size.width+" "+this.size.height)
.attr("class", "line")
.append("path")
.attr("class", "line")
.attr("d", this.line(this.points));
// add Chart Title
if (this.options.title) {
this.vis.append("text")
.attr("class", "axis")
.text(this.options.title)
.attr("x", this.size.width/2)
.attr("dy","-0.8em")
.style("text-anchor","middle");
}
// Add the x-axis label
if (this.options.xlabel) {
this.vis.append("text")
.attr("class", "axis")
.text(this.options.xlabel)
.attr("x", this.size.width/2)
.attr("y", this.size.height)
.attr("dy","2.4em")
.style("text-anchor","middle");
}
// add y-axis label
if (this.options.ylabel) {
this.vis.append("g").append("text")
.attr("class", "axis")
.text(this.options.ylabel)
.style("text-anchor","middle")
.attr("transform","translate(" + -40 + " " + this.size.height/2+") rotate(-90)");
}
d3.select(this.chart)
.on("mousemove.drag", self.mousemove())
.on("touchmove.drag", self.mousemove())
.on("mouseup.drag", self.mouseup())
.on("touchend.drag", self.mouseup());
this.redraw()();
};
//
// SimpleGraph methods
//
SimpleGraph.prototype.plot_drag = function() {
var self = this;
return function() {
registerKeyboardHandler(self.keydown());
d3.select('body').style("cursor", "move");
if (d3.event.altKey) {
var p = d3.svg.mouse(self.vis.node());
var newpoint = {};
newpoint.x = self.x.invert(Math.max(0, Math.min(self.size.width, p[0])));
newpoint.y = self.y.invert(Math.max(0, Math.min(self.size.height, p[1])));
self.points.push(newpoint);
self.points.sort(function(a, b) {
if (a.x < b.x) { return -1 };
if (a.x > b.x) { return 1 };
return 0
});
self.selected = newpoint;
self.update();
d3.event.preventDefault();
d3.event.stopPropagation();
}
}
};
SimpleGraph.prototype.update = function() {
var self = this;
var lines = this.vis.select("path").attr("d", this.line(this.points));
var circle = this.vis.select("svg").selectAll("circle")
.data(this.points, function(d) { return d; });
circle.enter().append("circle")
.attr("class", function(d) { return d === self.selected ? "selected" : null; })
.attr("cx", function(d) { return self.x(d.x); })
.attr("cy", function(d) { return self.y(d.y); })
.attr("r", 10.0)
.style("cursor", "ns-resize")
.on("mousedown.drag", self.datapoint_drag())
.on("touchstart.drag", self.datapoint_drag());
circle
.attr("class", function(d) { return d === self.selected ? "selected" : null; })
.attr("cx", function(d) {
return self.x(d.x); })
.attr("cy", function(d) { return self.y(d.y); });
circle.exit().remove();
if (d3.event && d3.event.keyCode) {
d3.event.preventDefault();
d3.event.stopPropagation();
}
}
SimpleGraph.prototype.datapoint_drag = function() {
var self = this;
return function(d) {
registerKeyboardHandler(self.keydown());
document.onselectstart = function() { return false; };
self.selected = self.dragged = d;
self.update();
}
};
SimpleGraph.prototype.mousemove = function() {
var self = this;
return function() {
var p = d3.svg.mouse(self.vis[0][0]),
t = d3.event.changedTouches;
if (self.dragged) {
self.dragged.y = self.y.invert(Math.max(0, Math.min(self.size.height, p[1])));
self.update();
};
if (!isNaN(self.downx)) {
d3.select('body').style("cursor", "ew-resize");
var rupx = self.x.invert(p[0]),
xaxis1 = self.x.domain()[0],
xaxis2 = self.x.domain()[1],
xextent = xaxis2 - xaxis1;
if (rupx != 0) {
var changex, new_domain;
changex = self.downx / rupx;
new_domain = [xaxis1, xaxis1 + (xextent * changex)];
self.x.domain(new_domain);
self.redraw()();
}
d3.event.preventDefault();
d3.event.stopPropagation();
};
if (!isNaN(self.downy)) {
d3.select('body').style("cursor", "ns-resize");
var rupy = self.y.invert(p[1]),
yaxis1 = self.y.domain()[1],
yaxis2 = self.y.domain()[0],
yextent = yaxis2 - yaxis1;
if (rupy != 0) {
var changey, new_domain;
changey = self.downy / rupy;
new_domain = [yaxis1 + (yextent * changey), yaxis1];
self.y.domain(new_domain);
self.redraw()();
}
d3.event.preventDefault();
d3.event.stopPropagation();
}
}
};
SimpleGraph.prototype.mouseup = function() {
var self = this;
return function() {
document.onselectstart = function() { return true; };
d3.select('body').style("cursor", "auto");
d3.select('body').style("cursor", "auto");
if (!isNaN(self.downx)) {
self.redraw()();
self.downx = Math.NaN;
d3.event.preventDefault();
d3.event.stopPropagation();
};
if (!isNaN(self.downy)) {
self.redraw()();
self.downy = Math.NaN;
d3.event.preventDefault();
d3.event.stopPropagation();
}
if (self.dragged) {
self.dragged = null
}
}
}
SimpleGraph.prototype.keydown = function() {
var self = this;
return function() {
if (!self.selected) return;
switch (d3.event.keyCode) {
case 8: // backspace
case 46: { // delete
var i = self.points.indexOf(self.selected);
self.points.splice(i, 1);
self.selected = self.points.length ? self.points[i > 0 ? i - 1 : 0] : null;
self.update();
break;
}
}
}
};
SimpleGraph.prototype.redraw = function() {
var self = this;
return function() {
self.x.domain([Math.max(self.x.domain()[0], self.options.xmin), Math.min(self.x.domain()[1], self.options.xmax)]);
var tx = function(d) {
return "translate(" + self.x(d) + ",0)";
},
ty = function(d) {
return "translate(0," + self.y(d) + ")";
},
stroke = function(d) {
return d ? "#ccc" : "#666";
},
fx = self.x.tickFormat(10),
fy = self.y.tickFormat(10);
// Regenerate x-ticks…
var gx = self.vis.selectAll("g.x")
.data(self.x.ticks(10), String)
.attr("transform", tx);
gx.select("text")
.text(fx);
var gxe = gx.enter().insert("g", "a")
.attr("class", "x")
.attr("transform", tx);
gxe.append("line")
.attr("stroke", stroke)
.attr("y1", 0)
.attr("y2", self.size.height);
gxe.append("text")
.attr("class", "axis")
.attr("y", self.size.height)
.attr("dy", "1em")
.attr("text-anchor", "middle")
.text(fx)
.style("cursor", "ew-resize")
.on("mouseover", function(d) { d3.select(this).style("font-weight", "bold");})
.on("mouseout", function(d) { d3.select(this).style("font-weight", "normal");})
.on("mousedown.drag", self.xaxis_drag())
.on("touchstart.drag", self.xaxis_drag());
gx.exit().remove();
// Regenerate y-ticks…
var gy = self.vis.selectAll("g.y")
.data(self.y.ticks(10), String)
.attr("transform", ty);
gy.select("text")
.text(fy);
var gye = gy.enter().insert("g", "a")
.attr("class", "y")
.attr("transform", ty)
.attr("background-fill", "#FFEEB6");
gye.append("line")
.attr("stroke", stroke)
.attr("x1", 0)
.attr("x2", self.size.width);
gye.append("text")
.attr("class", "axis")
.attr("x", -3)
.attr("dy", ".35em")
.attr("text-anchor", "end")
.text(fy)
.style("cursor", "ns-resize")
.on("mouseover", function(d) { d3.select(this).style("font-weight", "bold");})
.on("mouseout", function(d) { d3.select(this).style("font-weight", "normal");})
.on("mousedown.drag", self.yaxis_drag())
.on("touchstart.drag", self.yaxis_drag());
gy.exit().remove();
self.plot.call(d3.behavior.zoom().x(self.x).y(self.y).on("zoom", self.redraw()));
self.update();
}
}
SimpleGraph.prototype.xaxis_drag = function() {
var self = this;
return function(d) {
document.onselectstart = function() { return false; };
var p = d3.svg.mouse(self.vis[0][0]);
self.downx = self.x.invert(p[0]);
}
};
SimpleGraph.prototype.yaxis_drag = function(d) {
var self = this;
return function(d) {
document.onselectstart = function() { return false; };
var p = d3.svg.mouse(self.vis[0][0]);
self.downy = self.y.invert(p[1]);
}
};


 1万+
1万+

 被折叠的 条评论
为什么被折叠?
被折叠的 条评论
为什么被折叠?
 到【灌水乐园】发言


