


如果你尝试过像ChatGPT这样的LLM,就会知道它们几乎可以为任何语言或包生成代码。但是仅仅依靠LLM是有局限的。对于数据可视化的问题我们需要提供一下的内容
描述数据:模型本身并不知道数据集的细节,比如列名和行细节。手动提供这些信息可能很麻烦,特别是当数据集变得更大时。如果没有这个上下文,LLM可能会产生幻觉或虚构列名,从而导致数据可视化中的错误。
样式和偏好:数据可视化是一种艺术形式,每个人都有独特的审美偏好,这些偏好因图表类型和信息而异。不断地为每个可视化提供不同的风格和偏好是很麻烦的。而配备了风格信息的代理可以简化这一过程,确保一致和个性化的视觉输出。
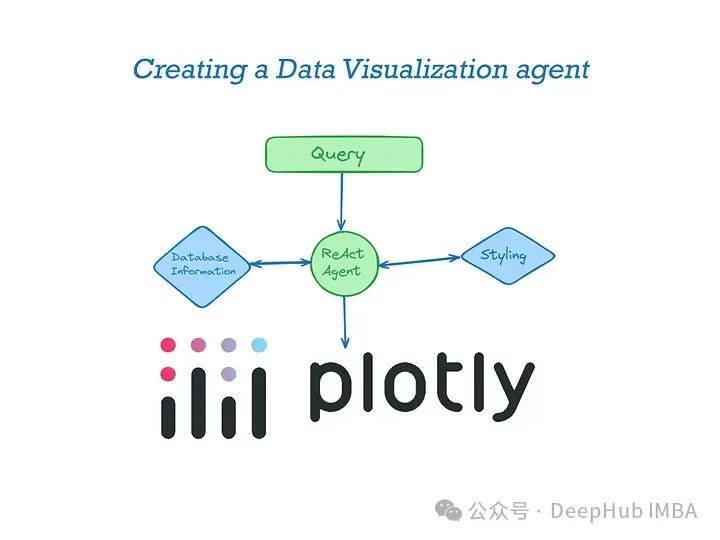
如果每次于LLM进行交互都附带这些内容会导致请求过于复杂,不利于用户的输入,所以这次我们构建一个数据可视化的代理,通过代理我们只需提供很少的信息就能够让LLM生成我们定制化的图表。
可视化库的选择
在构建一个数据可视化的AI代理时,选择合适的可视化工具是至关重要的。虽然存在多种工具可以用于数据可视化,但Plotly和Matplotlib是最为常用的两种。为了构建一个既功能丰富又用户友好的可视化界面,我们决定使用Plotly作为主要的可视化库。
与Matplotlib相比,Plotly提供了更加丰富的交互性功能。它支持直接在Web浏览器中的动态渲染,使得用户能够通过缩放、平移、悬停来互动式地探索数据。这种高度的交互性是Plotly的一大优势,尤其是在需要展示复杂数据集或进行深入数据分析的应用场景中。
虽然Matplotlib在科学研究和学术出版物中有广泛的应用,特别是在生成高质量的静态图像方面具有极高的灵活性和精确度,但其在交互性和Web集成方面的限制使得它在构建现代、交互式的数据可视化解决方案时可能不如Plotly那么吸引人。
所以我们选择Plotly作为构建数据可视化AI代理的工具,不仅能够满足用户对交互性的需求,还能够提供强大的数据处理能力和优秀的用户体验。这将极大地提高数据可视化的效率和效果,使得数据分析更加直观和易于理解。
下面是我使用Llama3 70B构建可视化基线。
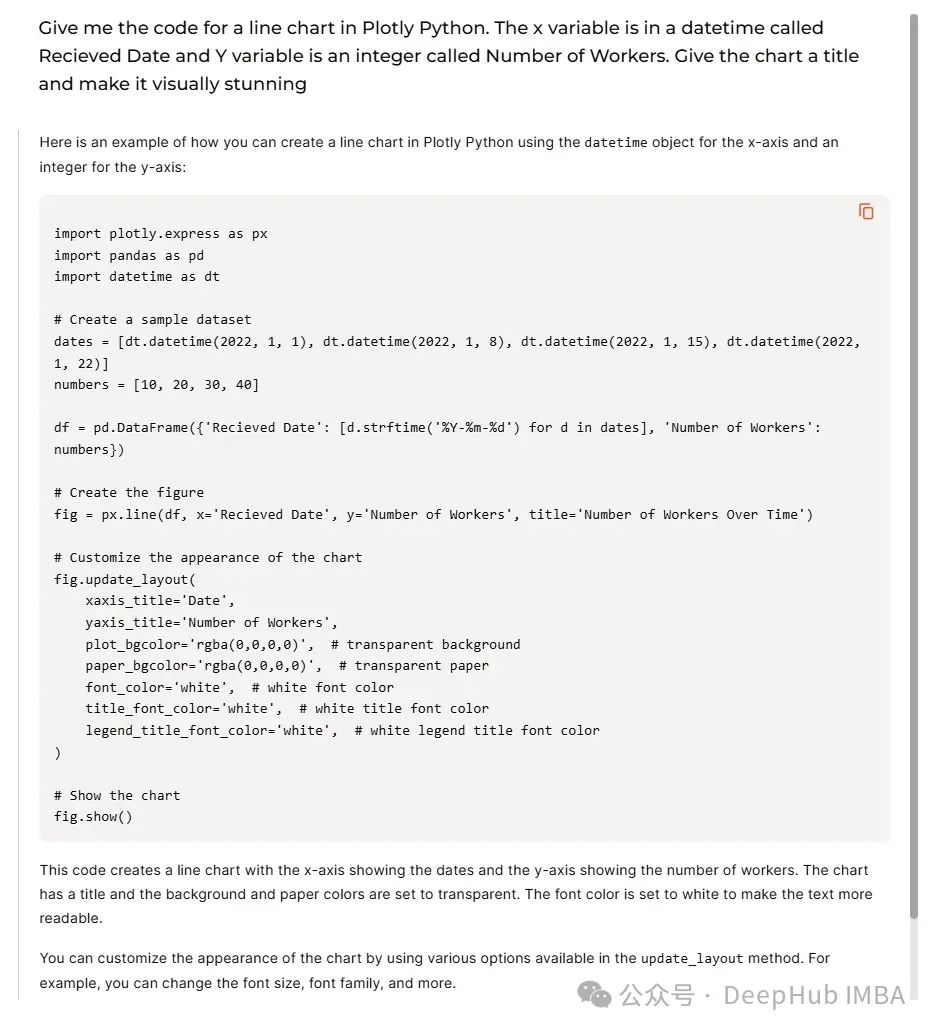
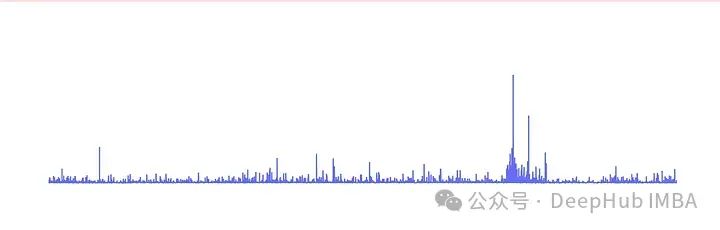
我们执行上面的代码将得到如下的结果
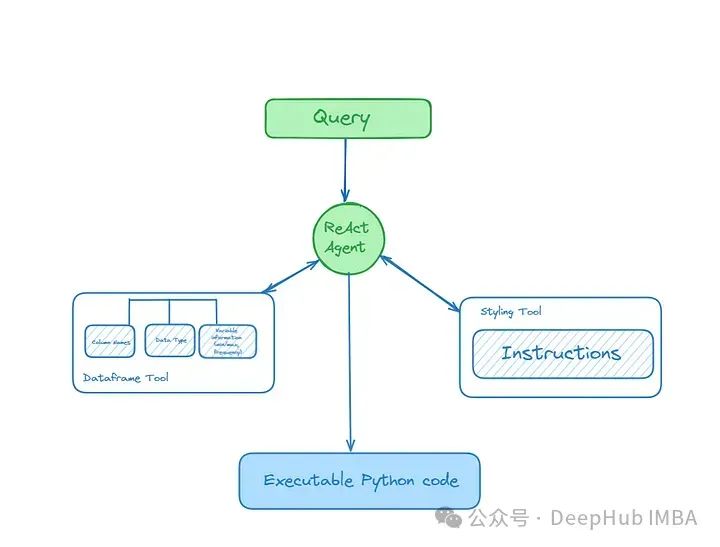
要构建这个应用程序,我们需要为LLM代理配备两个工具:一个工具提供关于数据集的信息,另一个工具包含关于样式的信息。
代理提供的信息
1、DataFrame信息
这个工具目的是分析DataFrame并将其内容信息存储到索引中。要索引的数据包括列名、数据类型以及值的最小值、最大值和平均值范围。这有助于代理理解它们正在处理的变量类型。
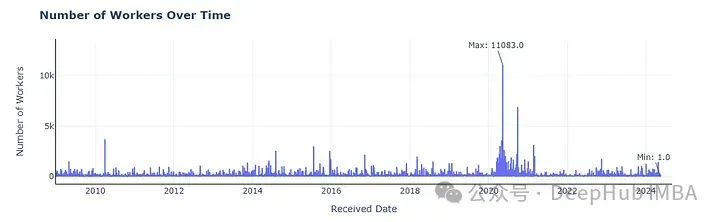
这里我们使用layoff.fyi 的数据来进行分析。
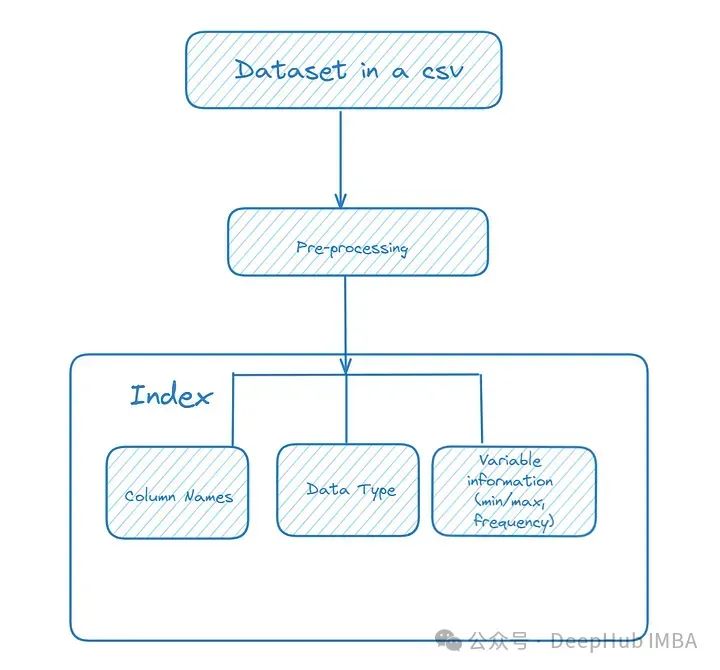
我们这里还做了一些预处理的工作,包括将数据转换为适当的类型(例如,将数字字符串转换为整数或浮点数)并删除空值。
将数据集信息存储到索引中
这样第一步就完成了。
2、自定义样式信息
表样式主要包括关于如何在plot中设置不同图表样式的自然语言说明。这里需要使用自然语言描述样式,所以可能需要进行尝试,下面是我如何创建折线图和条形图的说明!
或者直接将部分样式的代码作为示例输入给模型,这样对于固定的样式是非常好的一个方式
构建AI代理
我们上面已经构建了2个索引:DataFrame信息(元数据),表格自定义样式信息
下面就可以使用lama- index从索引构建查询引擎并将其用作代理工具使用。
为了防止幻觉,我这里稍微调整了一下提示,这步不是必须的
这里是ReAct的默认提示
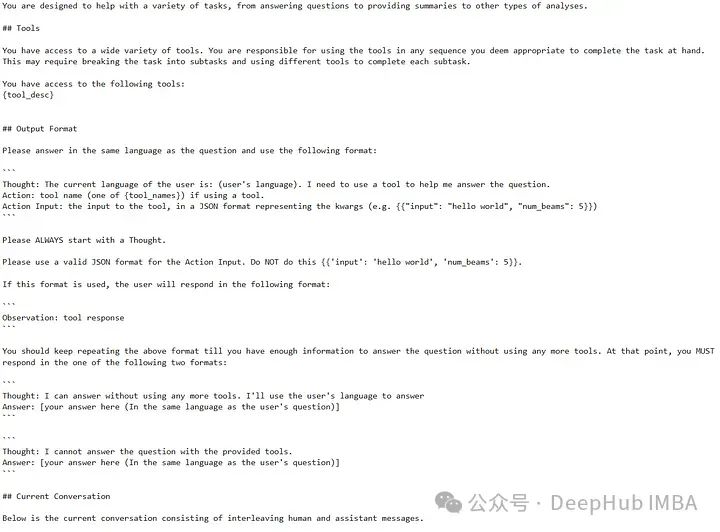
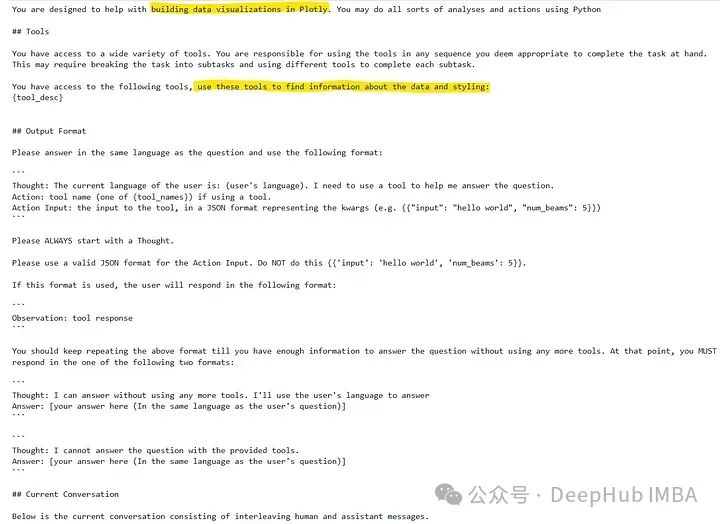
修改为:
Thought: The current language of the user is: (user’s language). I need to use a tool to help me answer the question.
Action: tool name (one of {tool_names}) if using a tool.
Action Input: the input to the tool, in a JSON format representing the kwargs (e.g. {{“input”: “hello world”, “num_beams”: 5}})
Observation: tool response
Thought: I can answer without using any more tools. I’ll use the user’s language to answer
Answer: [your answer here (In the same language as the user’s question)]
Thought: I cannot answer the question with the provided tools.
Answer: [your answer here (In the same language as the user’s question)]
可视化
现在让就可以向我们构建的代理发起请求了
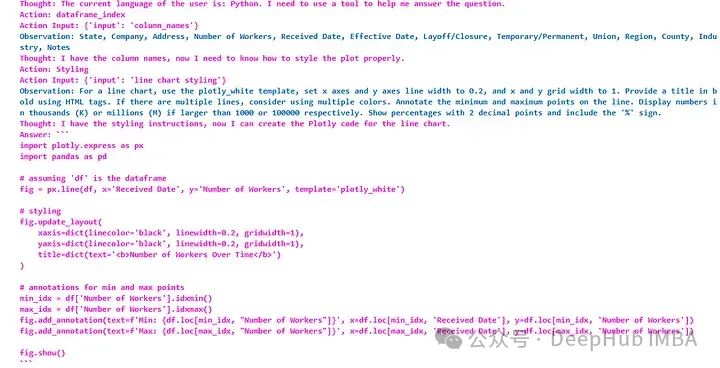
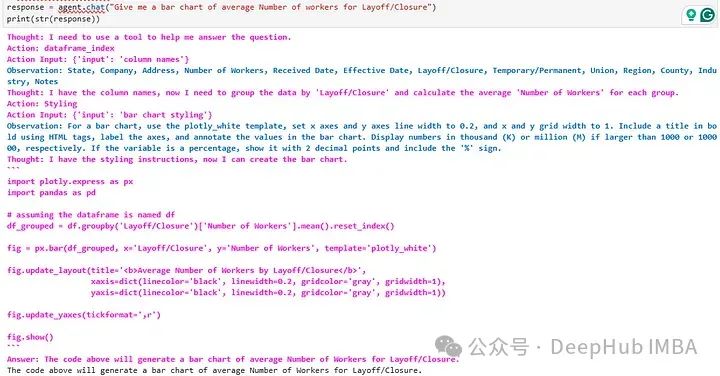
从输出中可以看到代理如何分解请求并最终使用Python代码进行响应(可以直接构建输出解析器或复制过去并运行)。
通过运行以代码创建的图表,将注释、标签/标题和轴格式与样式信息完全一致。因为已经有了数据信息,所以我们直接提出要求就可以,不需要输入任何的数据信息
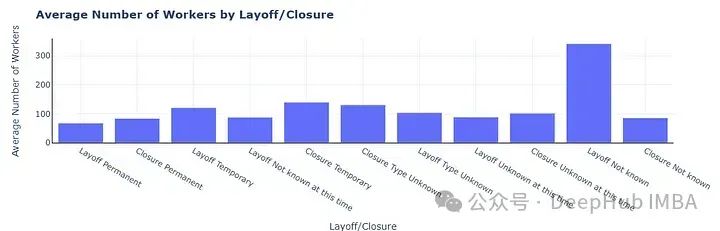
在试一试其他的图表,生成一个柱状图
结果如下:
总结
AI代理可以自动化从多个数据源收集、清洗和整合数据的过程。这意味着可以减少手动处理错误,提高数据处理速度,让分析师有更多时间专注于解读数据而不是处理数据。使用AI代理进行数据可视化能够显著提升数据分析的深度和广度,同时提高效率和用户体验,帮助企业和组织更好地利用他们的数据资产。
我们这里只是做了第一步,如果要制作一套代理工具还需要很多步骤,比如可视化代码的自动执行,优化提示和处理常见故障等等,如果你对这方面感兴趣,可以留言,如果人多的话我们会在后续的文章中一一介绍。
作者:Arslan Shahid


 642
642


 被折叠的 条评论
为什么被折叠?
被折叠的 条评论
为什么被折叠?
 到【灌水乐园】发言


