


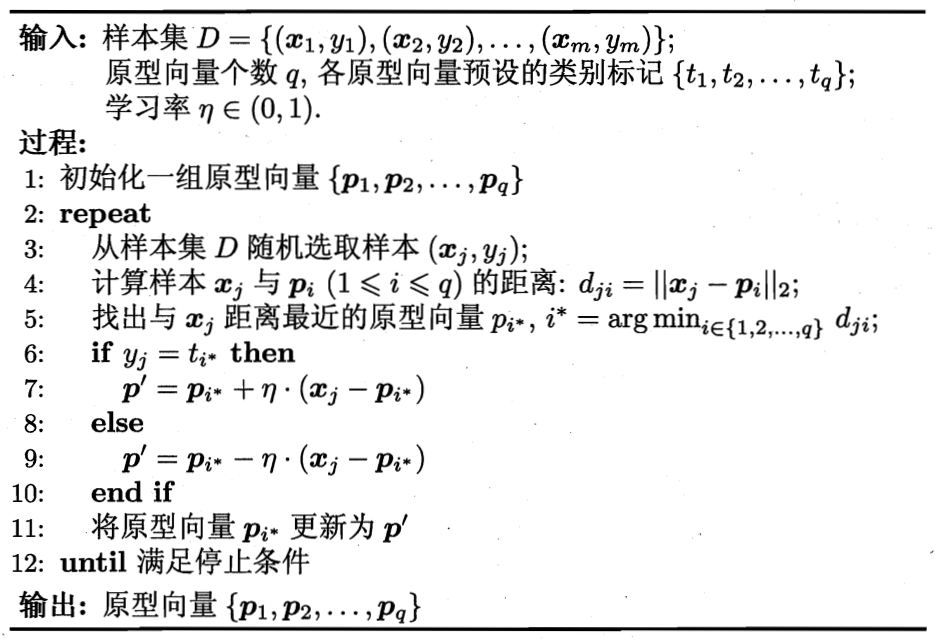
LVQ聚类与k-means不同之处在于,它是有标记的聚类,设定带标签的k个原型向量(即团簇中心),根据样本标签是否与原型向量的标签一致,对原型向量进行更新。
最后,根据样本到原型向量的距离,对样本进行团簇划分。
伪代码如下:
python实现如下:
1,算法部分
#学习向量量化LVQ:有标记的聚类
importnumpy as np
import randomdefdis(x,y):return np.sqrt(np.sum(np.power(x[:-1]-y[:-1],2)))#lvq算法
def lvq(data,labels,k=4,lr=0.01,epochs=1000,delta=1e-3):'''data:np.array,last feature is the label.
labels:1-dimension list or array,label of the data.
k:num_group
lr:learning rate
epochs:max epoch to stop running earlier
delta: max distance for two vectors to be 'equal'.'''
#学习向量
q=np.empty(shape=(k,data.shape[-1]),dtype=np.float32)#确认是否所有向量更新完了
all_vectors_updated=np.empty(shape=(k,),dtype=np.bool)
num_labels=len(labels)#初始化原型向量,从每一类中随机选取样本,如果类别数小于聚类数,循环随机取各类别中的样本
for i inrange(k):
q[i]=random.choice(data[data[:,-1]==labels[i%num_labels]])
step=0while not all_vectors_updated.all() and step
x=random.choice(data)
min_dis=np.inf
index=0for i inrange(k):
distance=dis(x,q[i])if distance
min_dis=distance
index=i#保存更新前向量
temp_q=q[index].copy()#如果标签相同,则q更新后接近样本x,否则远离
if x[-1]==q[index][-1]:
q[index][:-1]=q[index][:-1]+lr*(x[:-1]-q[index][:-1])else:
q[index][:-1]=q[index][:-1]-lr*(x[:-1]-q[index][:-1])#更新记录数组
if dis(temp_q,q[index])
all_vectors_updated[index]=True
step+=1
#训练完后,样本划分到最近的原型向量簇中
categoried_data=[]for i inrange(k):
categoried_data.append([])for item indata:
min_dis=np.inf
index=0for i inrange(k):
distance=dis(item,q[i])if distance
min_dis=distance
index=i
categoried_data[index].append(item)returnq,categoried_data
2,验证、测试
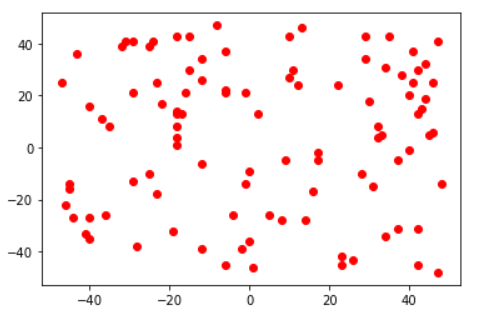
2.1 随机x-y平面上的点,根据y=x将数据划分为2个类别,然后聚类
先看看原始数据分布:
x=np.random.randint(-50,50,size=100)
y=np.random.randint(-50,50,size=100)
x=np.array(list(zip(x,y)))importmatplotlib.pyplot as plt%matplotlib inline
plt.plot([item[0]for item in x],[item[1] for item in x],'ro')
处理输入数据:
#y>x:1 y<=x:0
y=np.array([ 1&(item[1]>item[0]) for item inx])
y=np.expand_dims(y,axis=-1)
data=np.concatenate((x,y),axis=1).astype(np.float32)
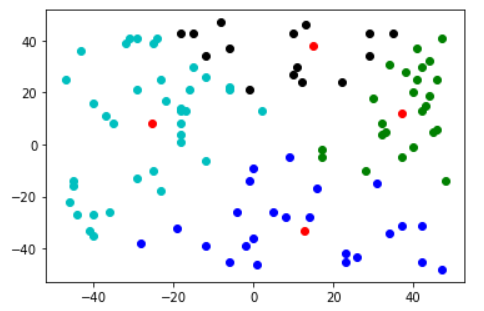
训练,显示结果
q,categoried_data=lvq(data,np.array([0.,1.]),k=4)
color=['bo','ko','go','co','yo','ro']for i inrange(len(categoried_data)):
data_i=categoried_data[i]
plt.plot([item[0]for item in data_i],[item[1] for item indata_i],color[i])
plt.plot([item[0]for item in q],[item[1] for item in q],color[-1])
plt.show()
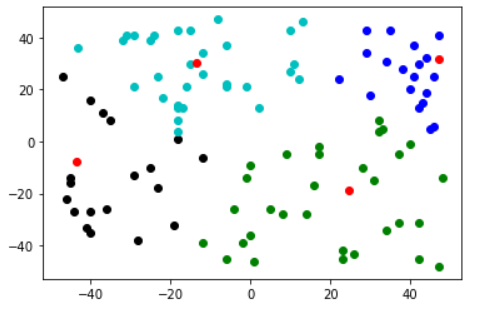
这里执行了2次,可以看出与k-means一样,对初值敏感
总结:
根据上图可以看出,聚类的效果是在标记的前提下进行的,即团簇是很少跨过分类边界y=x的。相当于对每一个类别,进行了细分。因为每次训练根据一个样本更新,epochs应该设置大一点。
另外,感觉我这个算法有点问题(不知道是不是没理解好lvq),当团簇数大于分类数时,团簇标记会重叠,这就导致同一个类下的2个团簇,当进行原型向量更新时,可能导致向量靠近另一个团簇的样本。从直觉上看,k-means那种基于多个样本的中心更新看起来更靠谱一些。


 887
887


 被折叠的 条评论
为什么被折叠?
被折叠的 条评论
为什么被折叠?
 到【灌水乐园】发言


