


wpf 柱状图 默认的图片显示如下,当鼠标落在对应的柱子上的时候,其对应的值才会通过tooltip显示出来,

其代码非常简单,假定我们的数据集合是一个Dictionary<DateTime,double>(我们定义一个成员变量result)的集合。
其xaml代码为
1
<
chartingToolkit:Chart Name
=
"
ColumnChartDefault
"
Title
=
"
ChartWithDefaultValue
"
LegendTitle
=
"
Chart
"
>
2 < chartingToolkit:ColumnSeries Name = " defaultColumnSeries " Title = " DefaultChart " IndependentValuePath = " Key " DependentValuePath = " Value " />
3 </ chartingToolkit:Chart >
2 < chartingToolkit:ColumnSeries Name = " defaultColumnSeries " Title = " DefaultChart " IndependentValuePath = " Key " DependentValuePath = " Value " />
3 </ chartingToolkit:Chart >
在后台将result对象经过数据填充赋给ItemsSource即可。
然而,默认的显示方式也有些弊端,以上图为例,在查看统计图标的时候,对于每个柱状的数据不能一目了然的看出,必须将鼠标放在指定的柱状上才能显示,所以有时候需要将各个柱状对应的值默认的显示出来,如下图:
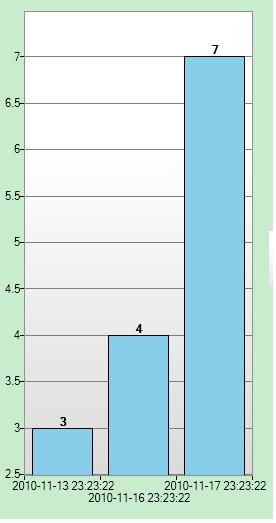
其实对于这个修改也很简单,主要是修改xaml中的style,我们知道,默认显示的是因为它通过tooltip来显示(对应线图和饼图都是一样),所以我们可以修改其style,其xaml如下:
1
<
chartingToolkit:Chart Grid.Column
=
"
1
"
Name
=
"
ColumnCharShowValue
"
LegendTitle
=
"
Chart
"
Title
=
"
ChartShowValue
"
>
2 < chartingToolkit:ColumnSeries Name = " columnSeriesShowValue " Title = " ChartShowValue " IndependentValuePath = " Key " DependentValuePath = " Value " >
3 < chartingToolkit:ColumnSeries.DataPointStyle >
4 < Style TargetType = " chartingToolkit:ColumnDataPoint " >
5 < Setter Property = " Background " Value = " SkyBlue " />
6 < Setter Property = " Template " >
7 < Setter.Value >
8 < ControlTemplate TargetType = " chartingToolkit:ColumnDataPoint " >
9 < Grid >
10 < Rectangle Fill = " {TemplateBinding Background} " Stroke = " Black " />
11 < Grid Background = " LightBlue " Margin = " 0 " HorizontalAlignment = " Center " VerticalAlignment = " Top " >
12 < TextBlock Text = " {TemplateBinding FormattedDependentValue} " FontWeight = " Bold " Margin = " 0,-20,0,0 " VerticalAlignment = " Bottom " HorizontalAlignment = " Center " />
13 </ Grid >
14 </ Grid >
15 </ ControlTemplate >
16 </ Setter.Value >
17 </ Setter >
18 </ Style >
19 </ chartingToolkit:ColumnSeries.DataPointStyle >
20 </ chartingToolkit:ColumnSeries >
21 </ chartingToolkit:Chart >
22
同样,在后台代码里将result数据填充后赋给其ItemsSource即可。
ps:虽然现在看起来很简单,但自己当时在做这的时候还是遇到了很多问题,主要原因是对WPF的熟悉度不够,今天将其贴出来,也是告诉自己很多事情只要自己去静心钻研,看起来很难的东西其实也就那么简单,好好学习,静心学习~


 2007
2007


 被折叠的 条评论
为什么被折叠?
被折叠的 条评论
为什么被折叠?
 到【灌水乐园】发言


