


function show_nodes_figure()
%节点分布图
global X;
global Y;
global base;
global nodes_num;
global E0;
global E_da;
global E_elec;
global E_fs;
global E_mp;
global d0;
global Nodes;
clf
hold on
for i=1:nodes_num
plot(Nodes{i}{1}.x,Nodes{i}{1}.y,'or ','MarkerSize',5);
end
axis([0,X,0,Y]);
set(gca,'xtick',[0:X/12:X]); %设置网格密度
set(gca,'ytick',[0:Y/12:Y]);
grid on;
xlabel('X');
ylabel('Y');
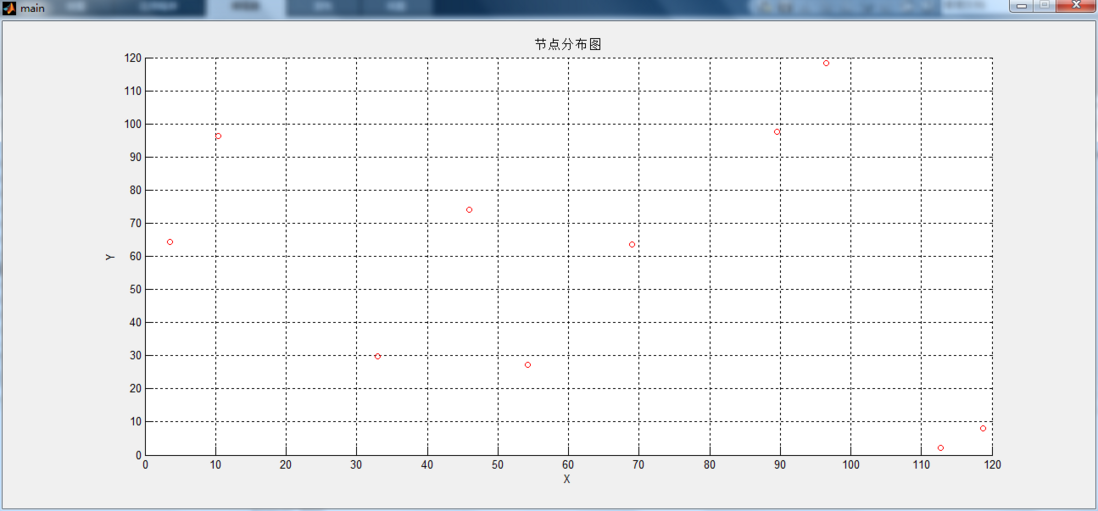
title('节点分布图')
hold off
如图,我点击运行main.m进入如下界面
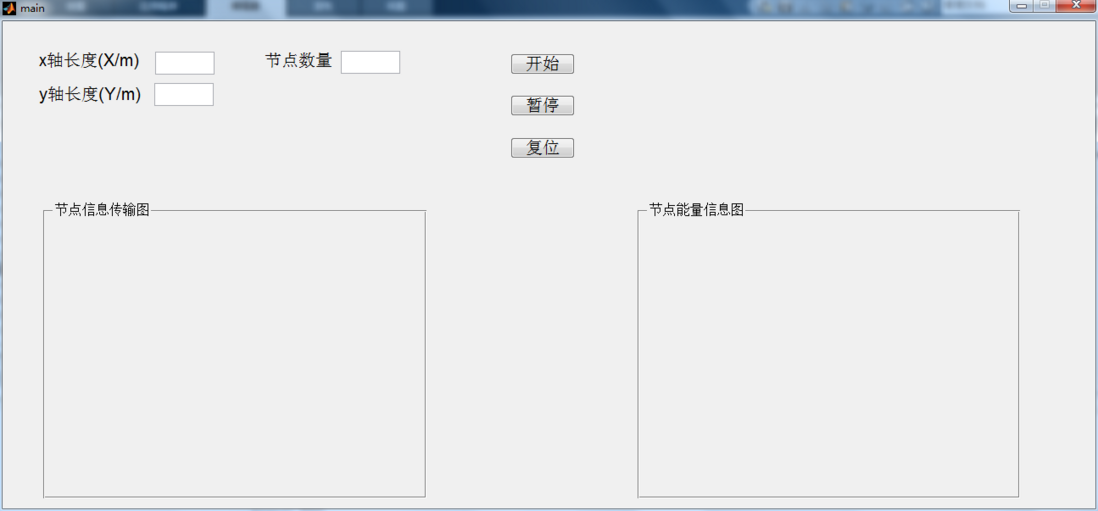
输入数据运行后会调用上面的show_nodes_figure函数,但是此函数产生图像将整个main的面板覆盖了,我怎么设置将图像画在左下角的uipanel(节点信息传输图中)
(整个图像被覆盖了)
下面是main.m代码
function varargout = main(varargin)
% MAIN MATLAB code for main.fig
% MAIN, by itself, creates a new MAIN or raises the existing
% singleton*.
%
% H = MAIN returns the handle to a new MAIN or the handle to
% the existing singleton*.
%
% MAIN('CALLBACK',hObject,eventData,handles,...) calls the local
% function named CALLBACK in MAIN.M with the given input arguments.
%
% MAIN('Property','Value',...) creates a new MAIN or raises the
% existing singleton*. Starting from the left, property value pairs are
% applied to the GUI before main_OpeningFcn gets called. An
% unrecognized property name or in
 最低0.47元/天 解锁文章


 458
458


 被折叠的 条评论
为什么被折叠?
被折叠的 条评论
为什么被折叠?
 到【灌水乐园】发言


