


 本文介绍了BIM中的Revit软件如何创建和修改标高(level)与轴线(grids),包括标高的创建步骤、类型与属性,以及轴线的绘制方法、偏移和移动操作。内容涵盖了标高线的对齐、移动,轴网的捕捉、编号调整等关键知识点。
BIM-REVIT-STRUCTURE 从零开始建模------level and grids
01
B
I
M
BIM,就是以建设领域为对象,基于建设项目全生命周期的信息化、智能化方法与过程,简单来说就是建设信息化。
------知乎-林治阳
(他关于little BIM 和big BIM的阐述很有趣,有兴趣可以去知乎上找到这篇文章观看)
BIM概念
住房和城乡建设部工程质量安全监管司处长对BIM作出了解释。她表示:
BIM技术是一种应用于工程设计建造管理的数据化工具,通过参数模型整合各种项目的相关信息,在项目策划、运行和维护的全生命周期过程中进行共享和传递,使工程技术人员对各种建筑信息作出正确理解和高效应对,为设计团队以及包括建筑运营单位在内的各方建设主体提供协同工作的基础,在提高生产效率、节约成本和缩短工期方面发挥重要作用!
------ 搜狗百科

02
REVIT 标高和轴线
今篇讲Revit levels and grids 标高和轴线;
03
levels 标高
一. 标高大家都很熟悉,下面来看看Revit里面标高的建立;
二. 下图是标高建模的基本步骤;
1. Open the section or elevation view to add levels to.
2. On the ribbon, click  (Level).
Architecture tab
 Datum panel (Level)
Structure tab
Datum panel (Level)注:每一条level线包含,Floor plan 和 Structrual plan;
3. Place the cursor in the drawing area and click.
Note: As you place the cursor to create a level, if the cursor aligns to an existing level line, a temporary vertical dimension displays between the cursor and that level line.
4. Draw level lines by moving the cursor horizontally.
On the Options Bar, Make Plan View is selected by default. As a result, each level you create is a story level and has an associated floor plan view and a reflected ceiling plan view. If you click Plan View Types on the Options Bar, you can choose to create only the view types that you specify in the Plan View Types dialog. If you clear Make Plan View, the level is considered to be a non-story level or a reference level; no associated plan view is created. Walls and other level-based elements can use reference levels as their top or base constraint.
As you draw level lines, the heads and tails of the lines can align to one another. When you select a level line that is aligned with others, a lock appears to show the alignment. If you move the level line horizontally, all aligned level lines move with it.
5. Click when the level line is the correct length.
You can change the name of the level by clicking the number to select it. You can also change the height of the level by clicking the dimension.
NOTE: Revit assigns the label (for example, Level 1) and the level symbol  to the new level. Use the Project Browser to rename the level, if desired. If you rename the level, you are asked if you would like to re-name the associated floor plan and the reflected ceiling plan as well.
3. 将光标放置在绘图区域之内,然后单击鼠标。
注: 当放置光标以创建标高时,如果光标与现有标高线对齐,则光标和该标高线之间会显示一个临时的垂直尺寸标注。
4. 通过水平移动光标绘制标高线。
在选项栏上,默认情况下“创建平面视图”处于选中状态。因此,所创建的每个标高都是一个楼层,并且拥有关联楼层平面视图和天花板投影平面视图。如果在选项栏上单击“平面视图类型”,则仅可以选择创建在“平面视图类型”对话框中指定的视图类型。如果取消了“创建平面视图”,则认为标高是非楼层的标高或参照标高,并且不创建关联的平面视图。墙及其他以标高为主体的图元可以将参照标高用作自己的墙顶定位标高或墙底定位标高。
当绘制标高线时,标高线的头和尾可以相互对齐。选择与其他标高线对齐的标高线时,将会出现一个锁以显示对齐。如果水平移动标高线,则全部对齐的标高线会随之移动。
5. 当标高线达到合适的长度时单击鼠标。
通过单击其编号以选择该标高,可以改变其名称。也可以通过单击其尺寸标注来改变标高的高度。
注:Revit 会为新标高指定标签(如“标高 1”)和标高符号 。如果需要,可以使用项目浏览器重命名标高。 如果重命名标高,则会询问您是否要重命名关联的楼层平面以及天花板投影平面视图。
03
3. 将光标放置在绘图区域之内,然后单击鼠标
05
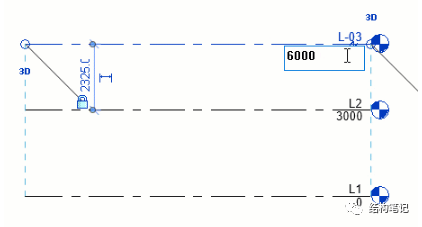
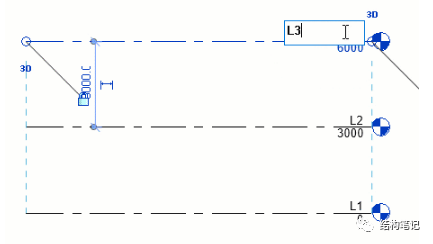
5. 单击其编号以改变其名称和标高的高度
04
levels type标高的类型和属性;
1. level的type parameter
2. level的instance parameter
4.1
level的type parameter
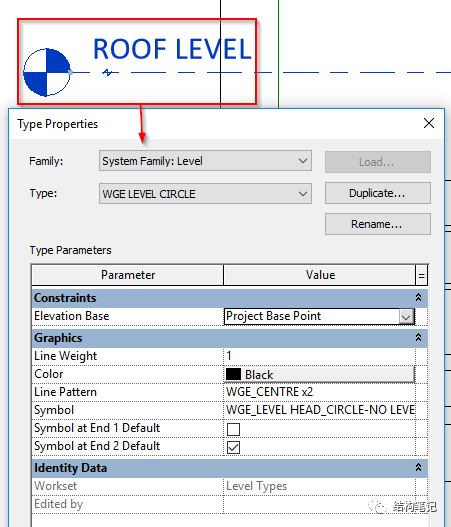
1. type parameter的详细介绍,
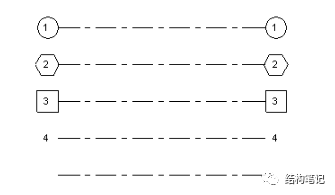
2. 其中symbol符号参数设置见下图;
Constraints | |
Elevation Base | If the elevation base value is set to Project Base Point, the elevation reported on a level is with respect to the project origin.If the base value is set to Survey Point, then the elevation reported is with respect to the fixed survey point. |
Graphics | |
| Line Weight | Sets the line weight for the level type. You can change the definition of the line weight number using the Line Weights tool. See About Line Weights. |
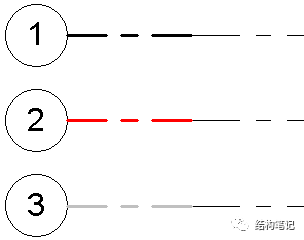
Color | Sets the color of the level line. You can choose from a list of colors defined in Revit, or define your own color. |
Line Pattern | Sets the line pattern of level lines. The line pattern can be solid or a combination of dashes and dots. You can choose from a list of values defined in Revit, or define your own line pattern. |
| Symbol | Determines whether the head of a level line displays a level number in a bubble (Level Head–Circle), a level number but no bubble (Level Head–No Bubble), or no level number (). |
Symbol at End 1 Default | Places a bubble by default at the left end of the level line. When you select a level line, a check box appears next to the level bubble. Clear the check box to hide the bubble. Select it again to display the bubble. |
Symbol at End 2 Default | Places a bubble by default at the right end of the level line. |
| 限制条件 | |
| 基面 | 如果“基面”值设置为“项目基点”,则在某一标高上报告的高程基于项目原点。如果“基面”值设置为“测量点”,则报告的高程基于固定测量点。 |
| 图形 | |
| 线宽 | 设置标高类型的线宽。您可以使用“线宽”工具来修改线宽编号的定义。请参见关于线宽。 |
| 颜色 | 设置标高线的颜色。可以从 Revit 定义的颜色列表中选择颜色,或定义您自己的颜色。 |
| 线型图案 | 设置标高线的线型图案。线型图案可以为实线或虚线和圆点的组合。可以从 Revit 定义的值列表中选择线型图案,或定义您自己的线型图案。 |
| 符号 | 确定标高线的标头是否显示编号中的标高号(标高标头 - 圆圈)、显示标高号但不显示编号(标高标头 - 无编号)或不显示标高号()。 |
| 端点 1 处的默认符号 | 默认情况下,在标高线的左端点放置编号。选择标高线时,标高编号旁边将显示复选框。取消选中该复选框以隐藏编号。再次选中它以显示编号。 |
| 端点 2 处的默认符号 | 默认情况下,在标高线的右端点放置编号。 |
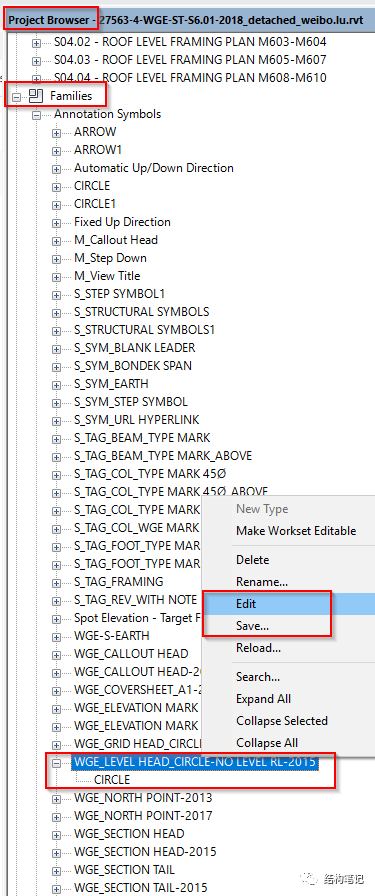
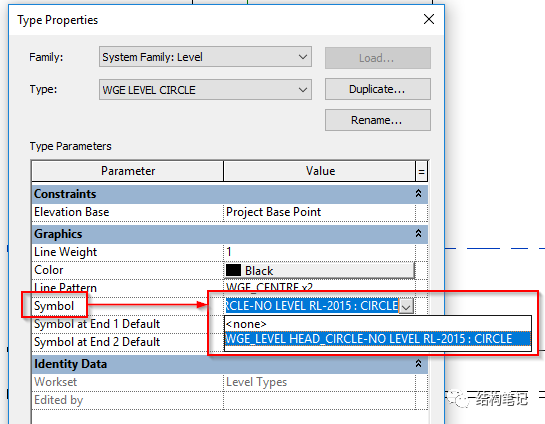 见上图,标高的symbol符号是一个family族文件,symbol的样式是可以替换的;
如下图,找到这个类型的symbol符号的family后,可以右键鼠标,根据需要重新编辑或者另存为。
见上图,标高的symbol符号是一个family族文件,symbol的样式是可以替换的;
如下图,找到这个类型的symbol符号的family后,可以右键鼠标,根据需要重新编辑或者另存为。
level的instance parameter
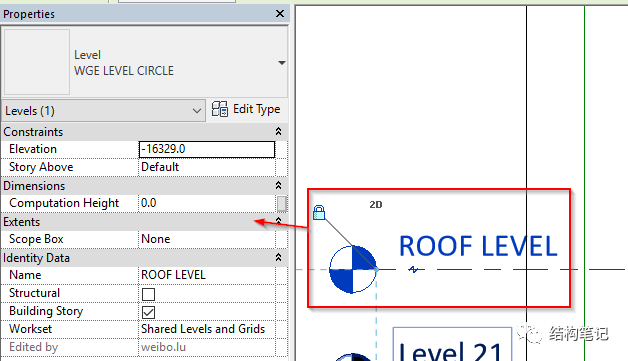
1. instance parameter of level的详细介绍;
2. worksets,通常levels和grids放在同一个固定的workset下面,方便管理和修改(这个workset一般是项目默认就有的,不需要自己单独建立);见下图;
| Name | Description |
|---|---|
| Constraints | |
| Elevation | The vertical height of the level. |
| Story Above | Used in conjunction with the Building Story parameter when exporting to IFC with the export option Split walls and columns by story. See Export a Project to IFC. This parameter indicates the next building story for the level. By default, Story Above is the next highest level for which Building Story is enabled. To access a list of all building stories above the current one, click in the field. The Story Above does not need to be the next higher level or building story. If the selected level is later deleted or if Building Story is disabled, any levels with this level as their Story Above will revert to default behavior. |
| Dimensions | |
| Computation Height | The distance above the level to use when computing a room's perimeter, area, and volume. See Computation Height. |
| Identity Data | |
| Name | A label for the level. You can assign any label or name you wish to this property. |
| Structural | Identifies the level as primarily structural (for example, Top of Steel). By default, this parameter is disabled. Note: A level can be defined as both structural and a building story. |
| Building Story | Use it in conjunction with the Story Above parameter when exporting to IFC with the export option Split walls and columns by level. See Export a Project to IFC. This parameter indicates that the level corresponds to a functional story or floor in the model, as opposed to other levels, such as landings and parapets. By default, this parameter is disabled. |
| Design Option | A read-only field that indicates the design option in which the level lines display. |
| Extents | |
| Scope Box | The scope box applied to the level. See Controlling Visibility of Datums Using Scope Boxes. |
| 名称 | 说明 |
|---|---|
| 限制条件 | |
| 立面 | 标高的垂直高度。 |
| 上方楼层 | 在使用导出选项按楼层拆分墙和柱导出为 IFC 时,与“建筑楼层”参数结合使用。请参见将项目导出为 IFC。 此参数指示该标高的下一个建筑楼层。默认情况下,“上方楼层”是下一个启用“建筑楼层”的最高标高。 若要访问当前楼层上方的所有建筑楼层的列表,请在该字段中单击。“上方楼层”不需要是下一个较高标高或建筑楼层。 如果选定的标高以后被删除,或者“建筑楼层”处于禁用状态,则以此标高作为“上方楼层”的所有标高都将还原为默认行为。 |
| 尺寸标注 | |
| 计算高度 | 在计算房间周长、面积和体积时要使用的标高之上的距离。请参见计算高度。 |
| 标识数据 | |
| 名称 | 标高的标签。可以为该属性指定任何所需的标签或名称。 |
| 结构 | 将标高标识为主要结构(例如,钢顶部)。默认情况下,此参数处于禁用状态。 注: 标高可以定义为两个结构和一个建筑楼层。 |
| 建筑楼层 | 在使用导出选项“按标高拆分墙和柱”导出为 IFC 时,将它与“上方楼层”参数结合使用。请参见将项目导出为 IFC。 此参数指示标高对应于模型中的功能楼层或楼板,与其他标高(如平台和保护墙)相对。 默认情况下,此参数处于禁用状态。 |
| 设计选项 | 只读字段,用于指明在其中显示标高线的设计选项。 |
| 范围 | |
| 范围框 | 应用于标高的范围框。请参见使用范围框控制基准的可见性。 |
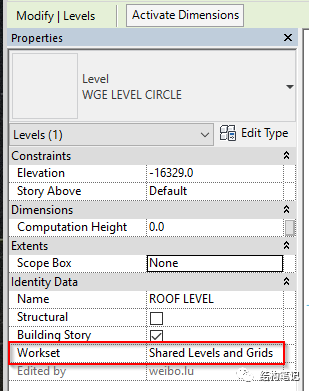 level 标高放在固定项目默认的workset下面
move levels and offset level line from its bubble
1,move levels
You can move a single level or multiple level lines.
You can move level lines in the following ways:
Select a level line. A temporary dimension displays between that level line and any level lines immediately above and below.
To move the selected level up or down, click the temporary dimension, type a new value, and press ENTER.
Selected level line shown with temporary dimensions above and below it
Drag the selected level line up or down.
To move multiple level lines, select the desired number of level lines and move them up or down.
可以移动一个或多个标高线。
可以按照下列方式移动标高线:
选择标高线。在该标高线与其直接相邻的上下标高线之间将显示临时尺寸标注。
要上下移动选定的标高,请单击临时尺寸标注,键入新值,并按 Enter 键。
选定标高线的上方和下方将显示临时尺寸标注
上下拖曳选定标高线。
要移动多条标高线,请选择要移动的多条标高线并上下移动。
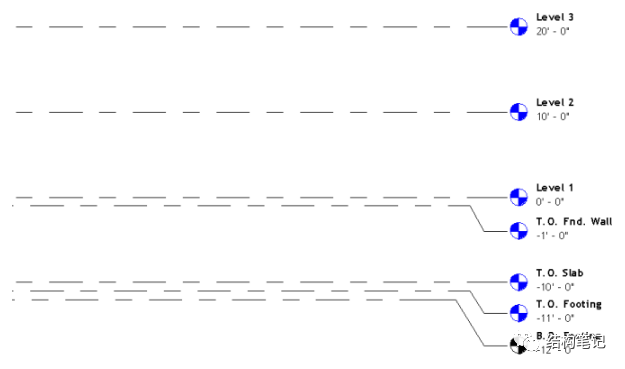
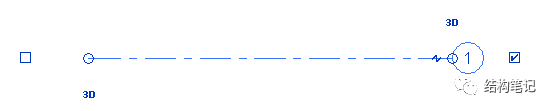
2,offset level line from its bubble
There may be times when you sketch a level line and want to offset its bubble from the rest of the level line.
Sketch a level line, or select an existing level line.
The end of the line near the bubble has drag controls.
Selected level with drag controls
Select and move the end drag control near the bubble to resize the level line.
Click the Add Elbow drag control (), then drag the control to the desired location to move the bubble away from the level line.
Bubble dragged from level line
When you move the bubble end out of line, the effect appears only in that view, no other views are affected. The segments created from dragging the bubble have a solid line style. You cannot change this style.
As you drag a control, the cursor snaps at points similar to the neighboring level lines. The cursor also snaps as the segments form straight lines.
可能有时绘制标高线时需要该标高线的编号偏移于其他标高线。
绘制一条标高线,或选择一条现有的标高线。
靠近编号的线端有拖曳控制柄。
有拖曳控制柄的选定标高
选择并移动靠近编号的端点拖曳控制柄,以调整标高线的大小。
单击“添加弯头”拖曳控制柄 (),然后将控制柄拖曳到正确的位置,从而将编号从标高线上移开。
拖曳偏离标高线的编号
当编号移动偏离轴线时,其效果仅本视图中显示,而不影响其他视图。通过拖曳编号所创建的线段为实线。不能改变这个样式。
拖曳控制柄时,光标在类似相邻标高线的点处捕捉。当线段形成直线时,光标也会进行捕捉。
点点下面,查看更多

instance parameter
instance parameter,请参照column柱建模篇;
type parameter
type parameter, 请参照column柱建模篇;
5
Grids 轴线的建立和类型属性
1. 建立轴线
Grids are annotation elements that help organize your design.
On the ribbon, click
 (Grid).
Architecture tab
 Datum panel (Grid)
Structure tab
Datum panel (Grid)
Click Modify | Place Grid tabDraw panel and select a sketch option.
Use  (Pick Lines) to snap the grid to an existing line, such as a wall.
(Optional) Click Modify | Place Grid tabDraw panel (Multi-Segment) to sketch grids requiring more than one segment.
Note: You cannot use the Copy/Monitor tool to monitor and coordinate changes to multi-segment grids.
Click when the grid is the correct length.
Revit automatically numbers each grid. To change the grid number, click the number, enter the new value, and press ENTER. You can use letters for grid line values. If you change the first grid number to a letter, all subsequent grid lines update appropriately.
As you draw grid lines, the heads and tails of the lines can align to one another. If grid lines are aligned and you select a line, a lock appears to indicate the alignment. If you move the grid extents, all aligned grid lines move with it.
轴网是可帮助整理设计的注释图元。
在功能区上,单击
(轴网)。
“建筑”选项卡
 “基准”面板 (轴网)
“结构”选项卡
“基准”面板 (轴网)
单击“修改 | 放置轴网”选项卡 “绘制”面板,然后选择一个草图选项。
使用 (拾取线)将轴网捕捉到墙等现有线条。
(可选)单击“修改 | 放置轴网”选项卡 “绘制”面板 (多段)以绘制需要多段的轴网。
注: 无法使用“复制/监视”工具监视和协调对多段轴网进行的更改。
当轴网达到正确的长度时单击鼠标。
Revit 会自动为每个轴网编号。要修改轴网编号,请单击编号,输入新值,然后按 Enter 键。可以使用字母作为轴线的值。如果您将第一个轴网编号修改为字母,则所有后续的轴线将进行相应地更新。
当绘制轴线时,可以让各轴线的头部和尾部相互对齐。如果轴线是对齐的,则选择线时会出现一个锁以指明对齐。如果移动轴网范围,则所有对齐的轴线都会随之移动。
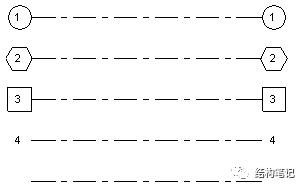
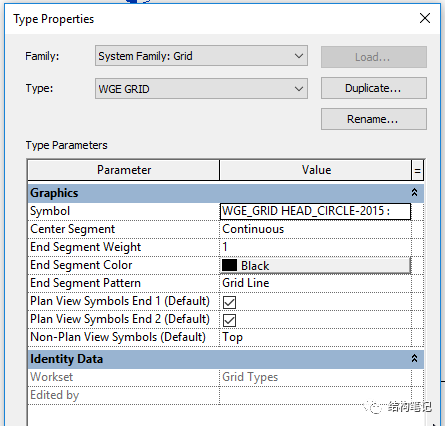
2. 轴线的type parameter
2.1. type parameter 的详细介绍2.2. symbol 符号参照轴线;| Name | Description |
|---|---|
| Graphics | |
| Symbol | The symbol to use for the ends of a grid line. The symbol can display a grid number in a bubble (Grid Head–Circle), a grid number but no bubble (Grid Head–No Bubble), or no grid bubble or number (none).
|
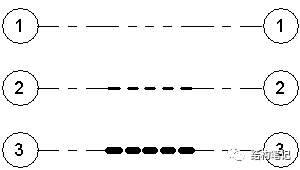
| Center Segment | The type of center segment to display in the grid line. Select None, Continuous, or Custom. See About Customizing Grid Lines.
|
| Center Segment Weight | If the Center Segment parameter is Custom, the line weight is used for the center segment.
|
| Center Segment Color | If the Center Segment parameter is Custom, the line color is used for the center segment. Select a color defined in Revit, or define your own color. See About Colors.
|
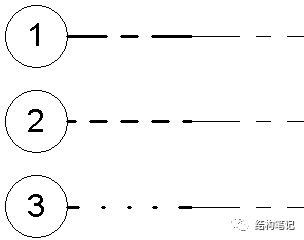
| Center Segment Pattern | If the Center Segment parameter is Custom, the pattern is used for the center segment. The line pattern can be solid or a combination of dashes and dots.
|
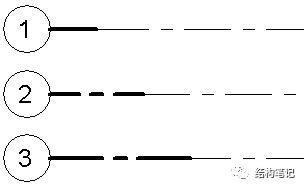
| End Segment Weight | The line weight to use for a continuous grid line, or if Center Segment is None or Custom, the line weight for the end segments.
|
| End Segment Color | The line color to use for a continuous grid line, or if Center Segment is None or Custom, the line color for the end segments.
|
| End Segment Pattern | The line style to use for a continuous grid line, or if Center Segment is None or Custom, the line style for the end segments.
|
| End Segments Length | If the Center Segment parameter is None or Custom, the length of the end segments (in paper space).
|
| Plan View Symbols End 1 (Default) | In a plan view, the default setting to display a bubble at the start point of a grid line. (That is, when you draw a grid line, the bubble displays at its start point.) If desired, you can show or hide bubbles for individual grid lines in views. See Show and Hide Grid Bubbles.
|
| Plan View Symbols End 2 (Default) | In a plan view, the default setting to display a bubble at the endpoint of a grid line. (That is, when you draw a grid line, the bubble displays at its endpoint.) If desired, you can show or hide bubbles for individual grid lines in views. See Show and Hide Grid Bubbles.
|
| Non-Plan View Symbols (Default) | In project views other than plan views (such as elevations and sections), the default location where bubbles display on the grid line: Top, Bottom, Both (top and bottom), or None. If desired, you can show or hide bubbles for individual grid lines in views. See Show and Hide Grid Bubbles.
|
| 名称 | 说明 |
|---|---|
| 图形 | |
| 符号 | 用于轴线端点的符号。该符号可以在编号中显示轴网号(轴网标头 - 圆)、显示轴网号但不显示编号(轴网标头 - 无编号)、无轴网编号或轴网号(无)。 |
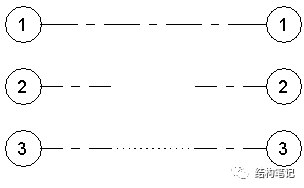
| 轴线中段 | 在轴线中显示的轴线中段的类型。选择“无”、“连续”或“自定义”。请参见关于自定义轴网线。 |
| 轴线中段宽度 | 如果“轴线中段”参数为“自定义”,则使用线宽来表示轴线中段的宽度。 |
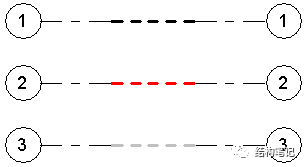
| 轴线中段颜色 | 如果“轴线中段”参数为“自定义”,则使用线颜色来表示轴线中段的颜色。选择 Revit 中定义的颜色,或定义自己的颜色。请参见关于颜色。 |
| 轴线中段填充图案 | 如果“轴线中段”参数为“自定义”,则使用填充图案来表示轴线中段的填充图案。线型图案可以为实线或虚线和圆点的组合。 |
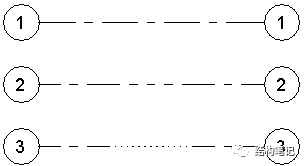
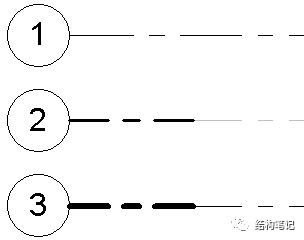
| 轴线末段宽度 | 表示连续轴线的线宽,或者在“轴线中段”为“无”或“自定义”的情况下表示轴线末段的线宽。 |
| 轴线末段颜色 | 表示连续轴线的线颜色,或者在“轴线中段”为“无”或“自定义”的情况下表示轴线末段的线颜色。 |
| 轴线末段填充图案 | 表示连续轴线的线样式,或者在“轴线中段”为“无”或“自定义”的情况下表示轴线末段的线样式。 |
| 轴线末段长度 | 在“轴线中段”参数为“无”或“自定义”的情况下表示轴线末段的长度(图纸空间)。 |
| 平面视图轴号端点 1 (默认) | 在平面视图中,在轴线的起点处显示编号的默认设置。(也就是说,在绘制轴线时,编号在其起点处显示。)如果需要,可以显示或隐藏视图中各轴网线的编号。请参见显示和隐藏轴网编号。 |
| 平面视图轴号端点 2 (默认) | 在平面视图中,在轴线的终点处显示编号的默认设置。(也就是说,在绘制轴线时,编号显示在其终点处。) 如果需要,可以显示或隐藏视图中各轴网线的编号。请参见显示和隐藏轴网编号。 |
| 非平面视图轴号(默认) | 在非平面视图的项目视图(例如,立面视图和剖面视图)中,轴线上显示编号的默认位置:“顶”、“底”、“两者”(顶和底)或“无”。如果需要,可以显示或隐藏视图中各轴网线的编号。请参见显示和隐藏轴网编号。 |
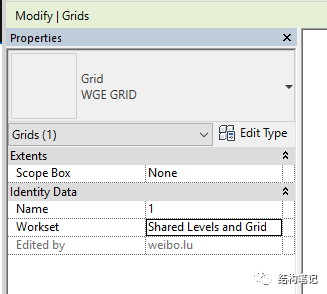
3. 轴线的instance parameter
instance parameter的详细介绍;
grid的workset参照轴线;
| Name | Description |
|---|---|
| Graphics | |
| Center Mark Visible | For an arc grid line, displays its center mark. |
| Identity Data | |
Name | A value for the grid line. This can be a numeric or alphanumeric value. The first instance defaults to 1. |
Design Option | The design option in which the grid lines display. Read-only. |
| Extent | |
Scope Box | The scope box applied to the grid. See Controlling Visibility of Datums Using Scope Boxes. |
| 名称 | 说明 |
|---|---|
| 图形 | |
| 使中心标记可见 | 对于弧形轴线,显示其中心标记。 |
| 标识数据 | |
| 名称 | 轴线的值。它可以是数字值或字母数字值。第一个实例默认为 1。 |
| 设计选项 | 轴线在其中显示的设计选项。只读。 |
| 范围 | |
| 范围框 | 应用于轴网的范围框。请参见使用范围框控制基准的可见性。 |
6
grids轴线的offset和move
1. offset grid line off its bubbleThere may be times when you sketch a grid line and want to offset its bubble from the rest of the grid line.
Sketch a grid line, or select an existing grid line.
The end of the line near the bubble has drag controls.
Selected grid with drag controls
To resize the grid line, select and move the end drag control near the bubble.
Click the Add Elbow drag control (
 ), then drag the control to the desired location to move the bubble away from the grid line.
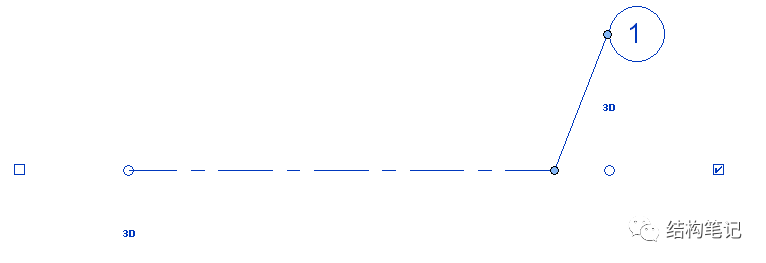
Bubble dragged from grid line
When you move the bubble end out of line, the effect appears only in that view. The segments created from dragging the bubble have a solid line style. You cannot change this style.
As you drag a control, the cursor snaps at points similar to the neighboring grids. The cursor also snaps as the segments form straight lines.
可能有时绘制轴线时需要将该轴线的编号从其他轴线偏移。
绘制轴线或选择现有的轴线。
靠近编号的线端有拖曳控制柄。
有拖曳控制柄的选定轴网
要调整轴线的大小,可选择并移动靠近编号的端点拖曳控制柄。
单击“添加弯头”拖曳控制柄 (
),然后将控制柄拖曳到正确的位置,从而将编号从轴线中移开。拖曳偏离轴线的编号
将编号移动偏离轴线时,其效果仅本视图中显示。通过拖曳编号所创建的线段为实线。不能改变这个样式。
拖曳控制柄时,光标在类似相邻轴网的点处捕捉。当线段形成直线时,光标也会进行捕捉。
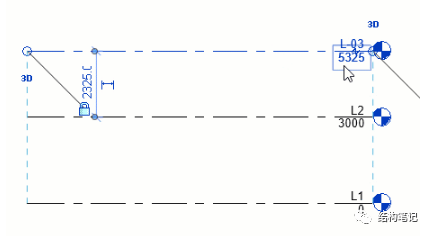
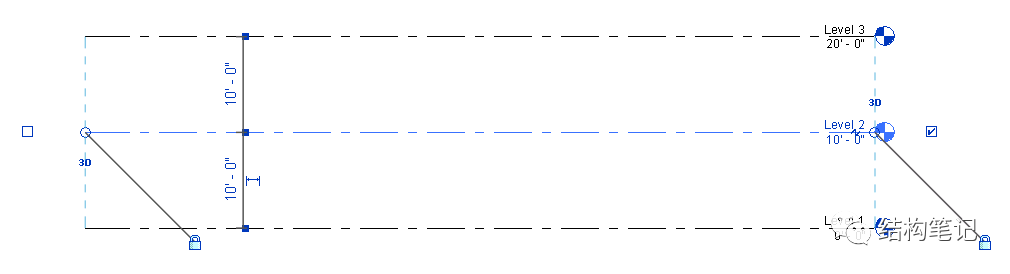
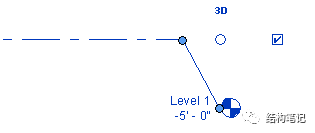
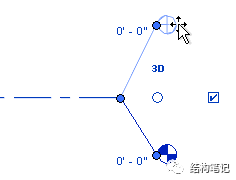
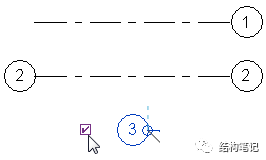
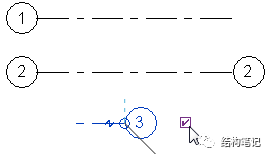
2. move grids移动轴线规则;轴线默认是3D状态的,如下图所示,鼠标左键单击轴线末端的圈圈,按住拖动,移动其中一根轴线,其它轴线也会跟着一起相应移动;
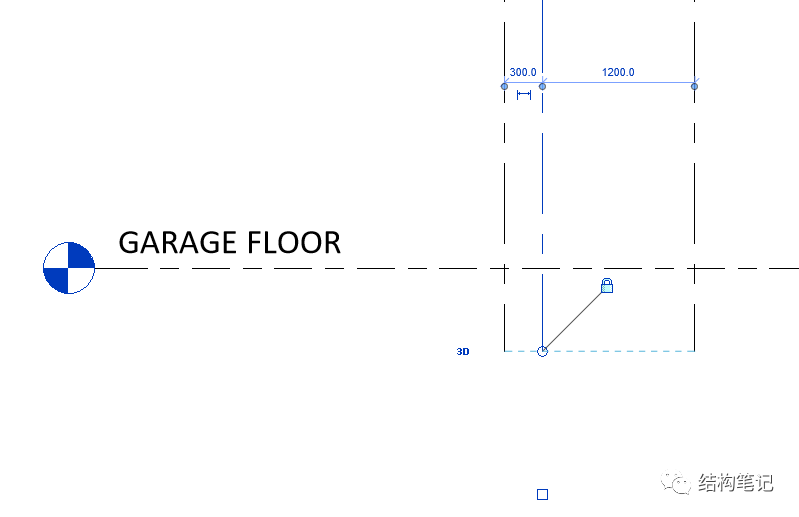
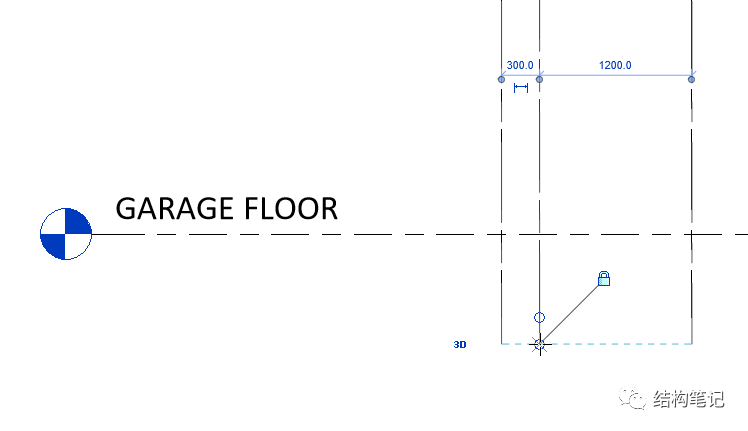 移动状态中的轴线,轴线末端鼠标为十字光标;
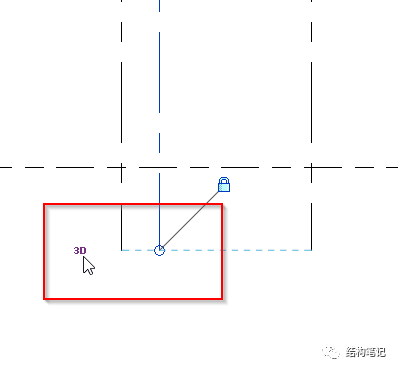
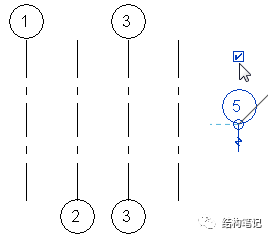
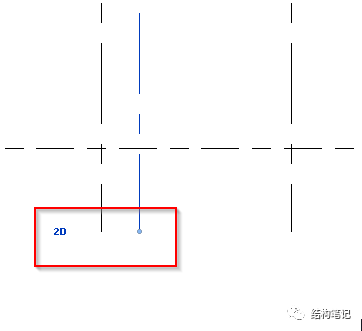 左键单击此处的3D符号,3D变为2D,如右图所示;
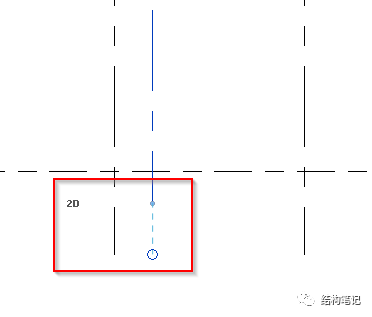 移动2D的grid,不会影响其它grid;
附录
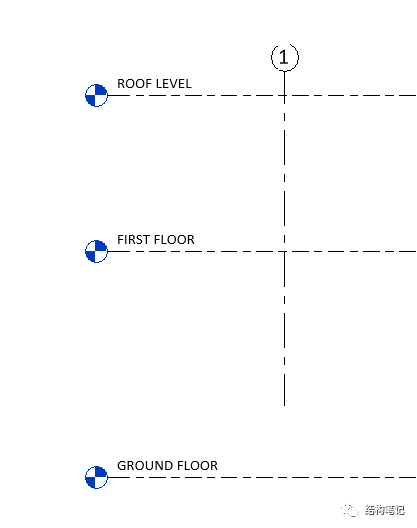
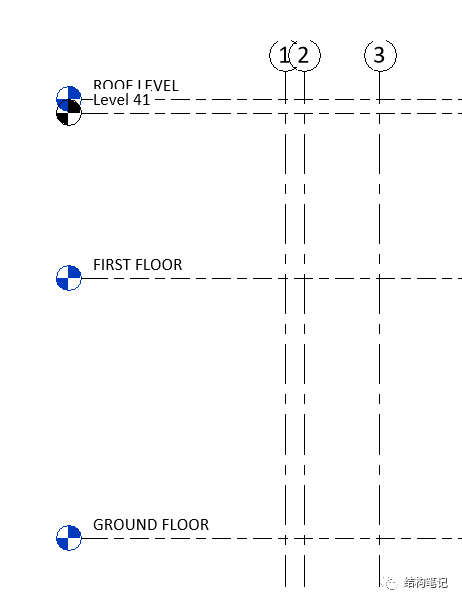
1. 轴线和level相交和不相交: 如下图,如果轴线和所有level相交,那每个level对应的平面上都会显示轴线1,如第二张图显示,轴线未与ground floor这个level相交,那么ground level上不会出现轴线1;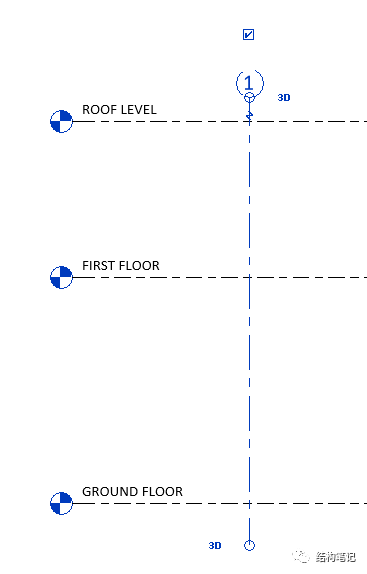
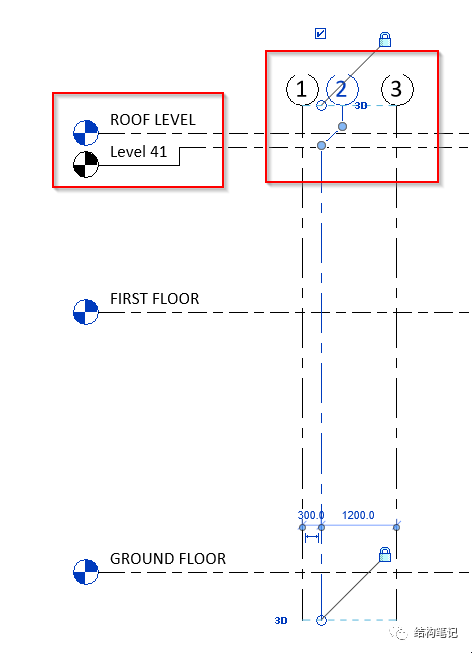
2. 如下图,offset level line and grid line的具体应用;
3. 标高和轴线大概就是这么多,具体建模的时候都会遇到这样那样的问题,这个就需要进一步的讨论了哈哈哈;
下篇提示
下篇文章是project parameters的介绍;敬请期待!


 被折叠的 条评论
为什么被折叠?
被折叠的 条评论
为什么被折叠?
 到【灌水乐园】发言


