


一般来说有经验的管理员在部署操作系统时通常会将操作系统本身与应用软件分离,将两者安装在不同的磁盘或者分区中,并且会保证有一定的资源余量以满足后期长期运行的需要。但是在虚拟化环境中一般经常遭遇资源比较紧张、管理比较混乱的情况,特别是资源浪费非常严重,往往是资源分配不均、最初对物理服务器测量不准确导致的。不管是什么原因,只有拿出时间去及时的清理、解决问题就是一种良性运维,否则日后虚拟机累积成几百个就非常麻烦了,特别是模板出现问题就非常严重。
数据库系统往往是要求最苛刻的应用,不仅对CPU内存要求苛刻(特别是内存),对硬盘速度(I/O)和大小都有较为苛刻的要求。在部署MySQL数据库时分配较大的内存较大较快的硬盘是值得的,至少要对my.cnf文件进行仔细的配置才行。当然了最好还是对物理服务器进行有效的评估,先制定一个满足运行条件的脚本系统配置,优化后再统计一段相当长时间的运行情况,CPU、内存、硬盘和网络的压力是怎么样分布的,峰值时间集中在哪一个阶段,再结合日志分析后再得出一个比较准确的配置和优化结果。
从MySQL数据库的配置文件/etc/my.cnf种找到日志存在的位置,确定无误后删除错误日志。
[root@zabbixserver ~]# rm -rf /var/log/mysqld.log
重新启动一次MySQL数据库,观察错误日志。
[root@zabbixserver ~]# service mysqld start
MySQL Daemon failed to start.
Starting mysqld: [FAILED]
[root@zabbixserver ~]# cat /var/log/mysqld.log
140505 11:22:52 mysqld_safe Starting mysqld daemon with databases from /var/lib/mysql
140505 11:22:52 InnoDB: Initializing buffer pool, size = 8.0M
140505 11:22:52 InnoDB: Completed initialization of buffer pool
InnoDB: Log scan progressed past the checkpoint lsn 2 2955725186
140505 11:22:52 InnoDB: Database was not shut down normally!
InnoDB: Starting crash recovery.
InnoDB: Reading tablespace information from the .ibd files...
InnoDB: Restoring possible half-written data pages from the doublewrite
InnoDB: buffer...
InnoDB: Doing recovery: scanned up to log sequence number 2 2955745512
InnoDB: 1 transaction(s) which must be rolled back or cleaned up
InnoDB: in total 4 row operations to undo
InnoDB: Trx id counter is 0 43004160
140505 11:22:52 InnoDB: Starting an apply batch of log records to the database...
InnoDB: Progress in percents: 0 1 2 3 4 5 6 7 8 9 10 11 12 13 14 15 16 17 18 19 20 21 22 23 24 25 26 27 28 29 30 31 32 33 34 35 36 37 38 39 40 41 42 43 44 45 46 47 48 49 50 51 52 53 54 55 56 57 58 59 60 61 62 63 64 65 66 67 68 69 70 71 72 73 74 75 76 77 78 79 80 81 82 83 84 85 86 87 88 89 90 91 92 93 94 95 96 97 98 99
InnoDB: Apply batch completed
InnoDB: Last MySQL binlog file position 0 1735848, file name ./mysql-bin.000018
InnoDB: Starting in background the rollback of uncommitted transactions
140505 11:22:52 InnoDB: Rolling back trx with id 0 41354738, 4 rows to undo
140505 11:22:52 InnoDB: Started; log sequence number 2 2955745512
140505 11:22:52 [Note] Recovering after a crash using mysql-bin
140505 11:22:52 [ERROR] Error in Log_event::read_log_event(): 'read error', data_len: 990, event_type: 24
140505 11:22:52 [Note] Starting crash recovery...
140505 11:22:52 [Note] Crash recovery finished.
03:22:52 UTC - mysqld got signal 11 ;
This could be because you hit a bug. It is also possible that this binary
or one of the libraries it was linked against is corrupt, improperly built,
or misconfigured. This error can also be caused by malfunctioning hardware.
We will try our best to scrape up some info that will hopefully help
diagnose the problem, but since we have already crashed,
something is definitely wrong and this may fail.
key_buffer_size=8384512
read_buffer_size=131072
max_used_connections=0
max_threads=700
thread_count=0
connection_count=0
It is possible that mysqld could use up to
key_buffer_size + (read_buffer_size + sort_buffer_size)*max_threads = 1538661 K bytes of memory
Hope that's ok; if not, decrease some variables in the equation.
Thread pointer: 0x0
Attempting backtrace. You can use the following information to find out
where mysqld died. If you see no messages after this, something went
terribly wrong...
stack_bottom = 0 thread_stack 0x40000
/usr/libexec/mysqld(my_print_stacktrace+0x29) [0x84f539]
/usr/libexec/mysqld(handle_fatal_signal+0x483) [0x6a3713]
/lib64/libpthread.so.0(+0xf500) [0x7ff1f5519500]
The manual page at http://dev.mysql.com/doc/mysql/en/crashing.html contains
information that should help you find out what is causing the crash.
140505 11:22:52 mysqld_safe mysqld from pid file /var/run/mysqld/mysqld.pid ended
[root@zabbixserver ~]# grep error /var/log/mysqld.log
140505 11:22:52 [ERROR] Error in Log_event::read_log_event(): 'read error', data_len: 990, event_type: 24
or misconfigured. This error can also be caused by malfunctioning hardware.
根据经验先看看磁盘空间够不够用,果不其然。如果着急只能将二进制日志停掉先将服务启动再说,如果不着急那就只能扩容或者迁移到大硬盘上去了。当然了MySQL Cluster以及主从之类的需要额外处理。
[root@zabbixserver ~]# df -h
Filesystem Size Used Avail Use% Mounted on
/dev/mapper/VolGroup-lv_root
12G 11G 0 100% /
tmpfs 1.9G 0 1.9G 0% /dev/shm
/dev/sda1 485M 32M 428M 7% /boot
[root@zabbixserver ~]#
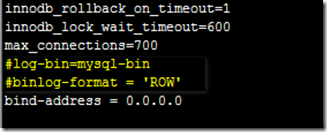
将二进制日志先禁用掉,如下图所示:
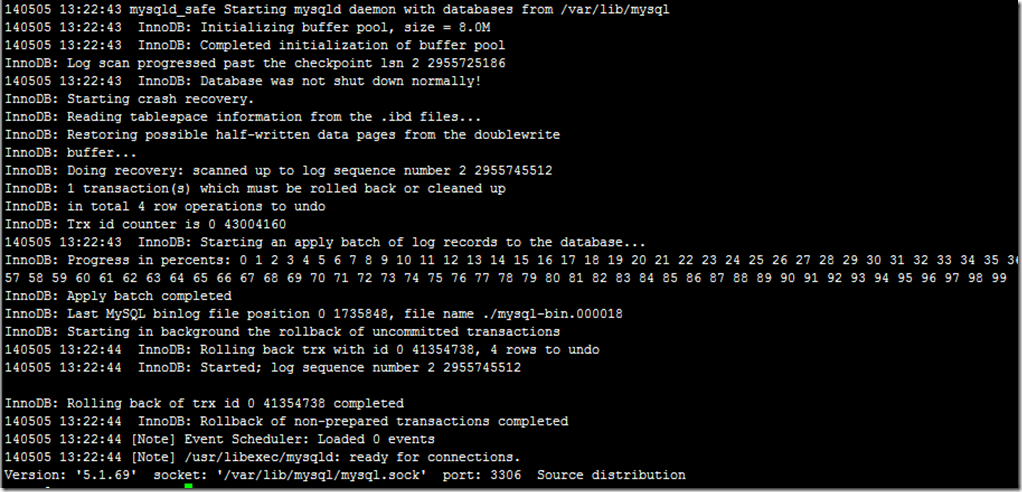
接下来数据库就能暂时平安无事了,如下图所示:


 2220
2220


 被折叠的 条评论
为什么被折叠?
被折叠的 条评论
为什么被折叠?
 到【灌水乐园】发言


