


 本文详述如何使用PDFPlumber库提取PDF中的表格数据,并通过实例展示了其可视化调试工具的使用,包括调整参数以准确识别表格边界,以及如何清洗和展示提取的数据。同时提及适用于不同Python版本的安装和依赖项设置。


作者:QIML编辑部
来源:量化投资与机器学习
文章经授权转载
手把手教学:
提取PDF各种表格文本数据
还在为抓取各种PDF格式的财务、数据报表而烦恼吗? 还在为自己手工操作导致的效率低下而烦恼吗? 还在担心没有趁手的兵器吗?今天,公众号为大家介绍一款神器:
PDFPlumbe
轻松玩转PDF,痛快抓数据!助你一臂之力!

PDFPlumb最适合提取电脑生成的PDF,而不是扫描的PDF。 它是在pdfminer和pdfmine.six基础上设计的。
适用版本: Python2.7、3.1、3.4、3.5和3.6。
安装PDFPlumbepip install pdfplumber要使用pdfplumber的可视化调试工具,还需要在计算机上安装ImageMagick(https://imagemagick.org/index.php),说明如下:

http://docs.wand-py.org/en/latest/guide/install.html#install-imagemagick-debian
具体参数、提取流程与可视化我们将以案例进行展示,更详细的内容,请大家在文末下载安装包自行查看。
案例一import pdfplumber
pdf = pdfplumber.open("../pdfs/ca-warn-report.pdf")
p0 = pdf.pages[0]
im = p0.to_image()
im
使用 .extract_table 获取数据:
table = p0.extract_table()
table[:3]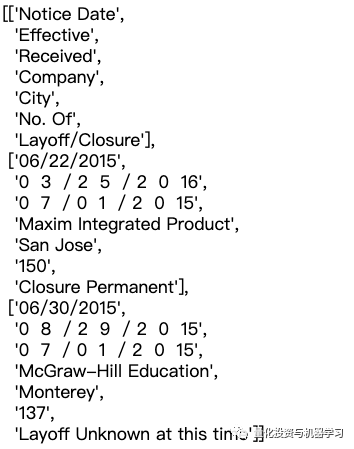
使用pandas将列表呈现为一个DataFrame,并在某些日期内删除多余的空格。
import pandas as pd
df = pd.DataFrame(table[1:], columns=table[0])
for column in ["Effective", "Received"]:
    df[column] = df[column].str.replace(" ", "")
大功告成!
具体是如何产生的呢?
红线代表pdfplumber在页面上找到的线,蓝色圆圈表示这些线的交叉点,淡蓝色底纹表示从这些交叉点派生的单元格。

import pdfplumber
report = pdfplumber.open("../pdfs/ag-energy-round-up-2017-02-24.pdf").pages[0]
im = report.to_image()
im
页面对象具有 .curves 属性,该属性包含在页面上找到的一个curve对象列表。本报告包含12条曲线,每图4条:
len(report.curves)
12
report.curves[0]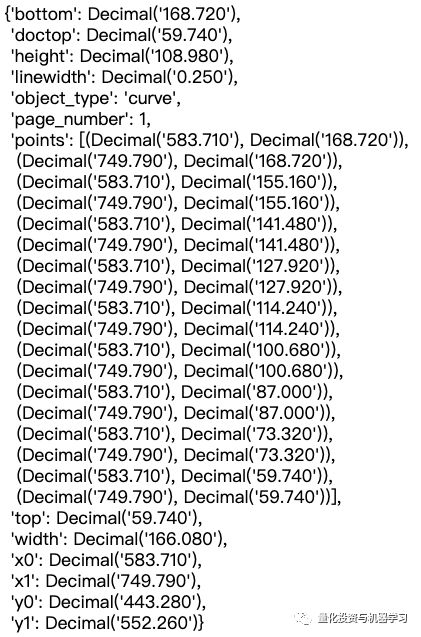
将它们传递 .draw_lines 确定曲线的位置:
im.draw_lines(report.curves, stroke="red", stroke_width=2)
我们通过循环使用四种颜色的调色板来获得更好的显示感:
im.reset()
colors = [ "gray", "red", "blue", "green" ]
for i, curve in enumerate(report.curves):
    stroke = colors[i%len(colors)]
    im.draw_circles(curve["points"], radius=3, stroke=stroke, fill="white")
    im.draw_line(curve["points"], stroke=stroke, stroke_width=2)
im
import pdfplumber

pdf = pdfplumber.open("../pdfs/background-checks.pd")
p0 = pdf.pages[0]
im = p0.to_image()
im
使用 PageImage.debug_tablefinder() 来检查表格:
im.reset().debug_tablefinder()
默认设置正确地标识了表的垂直边界,但是没有捕获每组5个states/territories之间的水平边界。所以:
使用自定义 .extract_table :
因为列由行分隔,所以我们使用 vertical_strategy="lines"
因为行主要由文本之间的沟槽分隔,所以我们使用 horizontal_strategy="text"
由于文本的左、右端与竖线不是很齐平,所以我们使用 intersection_tolerance: 15
table_settings = {
    "vertical_strategy": "lines",
    "horizontal_strategy": "text",
    "intersection_x_tolerance": 15
}

im.reset().debug_tablefinder(table_settings)
table = p0.extract_table(table_settings)

for row in table[:5]:
    print(row)
清理数据(页眉页脚等):
core_table = table[3:3+56]
" • ".join(core_table[0])
" • ".join(core_table[-1])
COLUMNS = [
    "state",
    "permit",
    "handgun",
    "long_gun",
    "other",
    "multiple",
    "admin",
    "prepawn_handgun",
    "prepawn_long_gun",
    "prepawn_other",
    "redemption_handgun",
    "redemption_long_gun",
    "redemption_other",
    "returned_handgun",
    "returned_long_gun",
    "returned_other",
    "rentals_handgun",
    "rentals_long_gun",
    "private_sale_handgun",
    "private_sale_long_gun",
    "private_sale_other",
    "return_to_seller_handgun",
    "return_to_seller_long_gun",
    "return_to_seller_other",
    "totals"
]
def parse_value(i, x):
if i == 0: return x
if x == "": return None
return int(x.replace(",", ""))
from collections import OrderedDict
def parse_row(row):
return OrderedDict((COLUMNS[i], parse_value(i, cell))
for i, cell in enumerate(row))
data = [ parse_row(row) for row in core_table ]
Now here's the first row, parsed:
data[0]
import pdfplumber
import re
from collections import OrderedDict

pdf = pdfplumber.open("../pdfs/san-jose-pd-firearm-sample.pdf")
p0 = pdf.pages[0]
im = p0.to_image()
im
我们在pdfplumber检测到的每个 char 对象周围绘制矩形。通过这样做,我们可以看到报表主体的的每一行都有相同的宽度,并且每个字段都填充了空格(“”)字符。这意味着我们可以像解析标准的固定宽度数据文件一样解析这些行。
im.reset().draw_rects(p0.chars)
使用 page .extract_text(…) 方法,逐行抓取页面上的每个字符(文本):
text = p0.extract_text()
print(text)
清理数据(页眉页脚等):
core_pat = re.compile(r"LOCATION[\-\s]+(.*)\n\s+Flags = e", re.DOTALL)
core = re.search(core_pat, text).group(1)
print(core)
在这份报告中,每f一个irearm占了两行。下面的代码将表拆分为two-line,然后根据每个字段中的字符数解析出字段:
lines = core.split("\n")
line_groups = list(zip(lines[::2], lines[1::2]))
print(line_groups[0])
def parse_row(first_line, second_line):
    return OrderedDict([
        ("type", first_line[:20].strip()),
        ("item", first_line[21:41].strip()),
        ("make", first_line[44:89].strip()),
        ("model", first_line[90:105].strip()),
        ("calibre", first_line[106:111].strip()),
        ("status", first_line[112:120].strip()),
        ("flags", first_line[124:129].strip()),
        ("serial_number", second_line[0:13].strip()),
        ("report_tag_number", second_line[21:41].strip()),
        ("case_file_number", second_line[44:64].strip()),
        ("storage_location", second_line[68:91].strip())
    ])

parsed = [ parse_row(first_line, second_line)
    for first_line, second_line in line_groups ]
parsed[:2]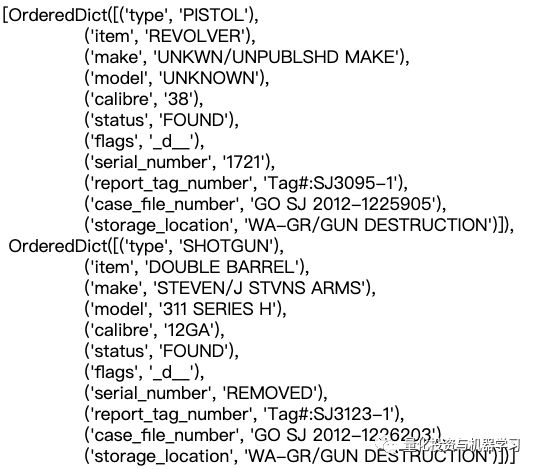
通过DataFrame进行展示:
mport pandas as pd
columns = list(parsed[0].keys())
pd.DataFrame(parsed)[columns]
-------------------End-------------------

公众号后台回复「微信群」,将邀请加入读者交流群。

推荐 | 免费获取《Python知识手册》
Matplotlib最有价值的50个图表


 2583
2583

 被折叠的 条评论
为什么被折叠?
被折叠的 条评论
为什么被折叠?
 到【灌水乐园】发言


