


一、背景
通常企业会在多个机房部署IT系统,在大数据基础服务组件中会集群跨机房部署或是跨机房抽取数据的场景,在抽数任务时间节点没有错开的时候,经常会造成带宽打满的情况,跨机房的带宽费用比较昂贵,不考虑成本去扩跨机房的带宽是不现实的。为了跟踪各服务器之间的网络交互的情况,更好调配抽数任务,用python写了一个netflow_exporter,将服务之间的流量传输进行监控,并将采集的数据接入Prometheus,最后在Grafana上展示。
二、代码展示
#!/usr/bin/python3
#coding=utf-8
#采集监控服务器之间流量传输大小,接入Prometheus,在grafana展示
""""
author: zjh
date: 2023-12-20
description: Scrape netflow to promethues
"""
import os
import prometheus_client
from prometheus_client import Counter, Gauge
from prometheus_client.core import CollectorRegistry
from flask import Response, Flask

def change_unit(unit):
    if "Mb" in unit:
        flow = float(unit.strip("Mb")) * 1024
        return flow
    elif "Kb" in unit:
        flow = float(unit.strip("Kb"))
        return flow
    elif "b" in unit:
        flow = float(unit.strip("b")) / 1024
        return flow

def get_flow():
    #iftop参数:-t 使用不带ncurses的文本界面,-P显示主机以及端口信息,-N只显示连接端口号,不显示端口对应的服务名称,-n 将输出的主机信息都通过IP显示,不进行DNS解析,-s num  num秒后打印一次文本输出然后退出
    #1.服务器上运行
    result = os.popen("iftop -t  -N -n -s 2 2>/dev/null |grep -A 1 -E '^   [0-9]'").read()
    #2.本地测试数据
    #result = open("basedatanoport.txt").read()
    #以换行符进行分割
    iftop_list = result.split("\n")
    #print(iftop_list)
    count = int(len(iftop_list))
    #定义字典 存放主机信息和进出流量
    flow_dict = {}

    for i in range(int(count/2)):
        flow_msg = ""
        #获取发送的ip地址(本地ip地址),数据偶数位为本地发送流量信息
        location_li_s = iftop_list[i*2]
        send_flow_lists = location_li_s.split(" ")

        #去空元素
        while '' in send_flow_lists:
            send_flow_lists.remove('')
        localhostip = send_flow_lists[1]
        send_flow = send_flow_lists[3]
        send_flow_float = change_unit(send_flow)

        #获取接收的流量
        location_li_r = iftop_list[i*2+1]
        rec_flow_lists = location_li_r.split(" ")

        while '' in rec_flow_lists:
            rec_flow_lists.remove('')
        remote_host_ip = rec_flow_lists[0]
        rec_flow = rec_flow_lists[3]
        rec_flow_float = change_unit(rec_flow)
        local_remote_host=localhostip+str(' <==> ')+remote_host_ip
        flow_msg = str(float('%2.f' % send_flow_float)) + "|" + str(float('%.2f' % rec_flow_float))
        flow_dict[local_remote_host] = flow_msg

    send_rows = []
    rec_rows = []
    for key in flow_dict:
        send_row_tmp_dict = {}
        rec_row_tmp_dict = {}
        flow_li = flow_dict[key].split("|")
        #flow_li[0]为发送流量,flow_li[1]为接收流量,单位是Kb
        #print(key + "|" + flow_li[0]  + "|" +  flow_li[1])
        send_row_tmp_dict['remoteip'] = key.replace('<','>')
        send_row_tmp_dict['value'] = flow_li[0]
        rec_row_tmp_dict['remoteip'] = key.replace('>','<')
        rec_row_tmp_dict['value'] = flow_li[1]
        send_rows.append(send_row_tmp_dict)
        rec_rows.append(rec_row_tmp_dict)
    return send_rows,rec_rows

app = Flask(__name__)

REGISTRY = CollectorRegistry(auto_describe=False)
count = Counter(
    'count',
    'count',
    registry=REGISTRY
)
networksSend = Gauge(
    name="send_flow",
    documentation="Send_Flow_Kb",
    namespace="netflow",
    labelnames=["remoteip"],
    registry=REGISTRY
)
networkReceive = Gauge(
    name="receive_flow",
    documentation="Receive_Flow_Kb",
    namespace="netflow",
    labelnames=["remoteip"],
    registry=REGISTRY
)

c = Gauge('my_requests_total', 'HTTP Failures', ['method', 'endpoint'],registry=REGISTRY)


@app.route('/metrics')
def r_value():
    #获取流量信息
    send_rows,rec_rows = get_flow()

    for row_s in send_rows:
        networksSend.labels(row_s['remoteip']).set(row_s['value'])

    for row_r in rec_rows:
        networkReceive.labels(row_r['remoteip']).set(row_r['value'])

    c.labels('test', '1').inc()
    c.labels('post', '/submit').inc()
    return Response(prometheus_client.generate_latest(REGISTRY),
                    mimetype="text/plain")


@app.route('/')
def index():
    return "<html>" \
           "<head><title>NetWorkTraffic Exporter</title></head>" \
           "<body>" \
           "<h1>NetWorkTraffic Exporter</h1>" \
           "<p><a href=" + ('/metrics') + ">Metrics</a></p></body>" \
                                          "</html>"

if __name__ == '__main__':
    #1.本地测试
    app.run(host='localhost',port=9101,debug=True)
    #2.服务器上部署
    input_list=sys.argv[1:]
    app.run(host=input_list[0],port=9101,debug=False)
三、在服务器上部署的前提条件:
1. linux 安装iftop命令
yum install iftop -y
2.安装python依赖
pip3 install -r requirement.txt
[root@test]:/opt/zjh/netflowmonitor
#cat requirement.txt
flask
prometheus_client
3.启动,启动脚本 后面加本机IP
nohup /usr/bin/python3 netflowmonitor.py 192.168.10.11 &
在promethues上增加配置
  - job_name: 'netflow'
    scrape_timeout: 10s
    metrics_path: '/metrics'
    static_configs:
    - targets: ['192.168.10.11:9101','192.168.10.12:9101']
      labels:
        job: netflow
        proj: flow
# prometuhes重新加载配置
curl -X POST http://localhost:9090/-/reload
四、Grafana上增加dashboard
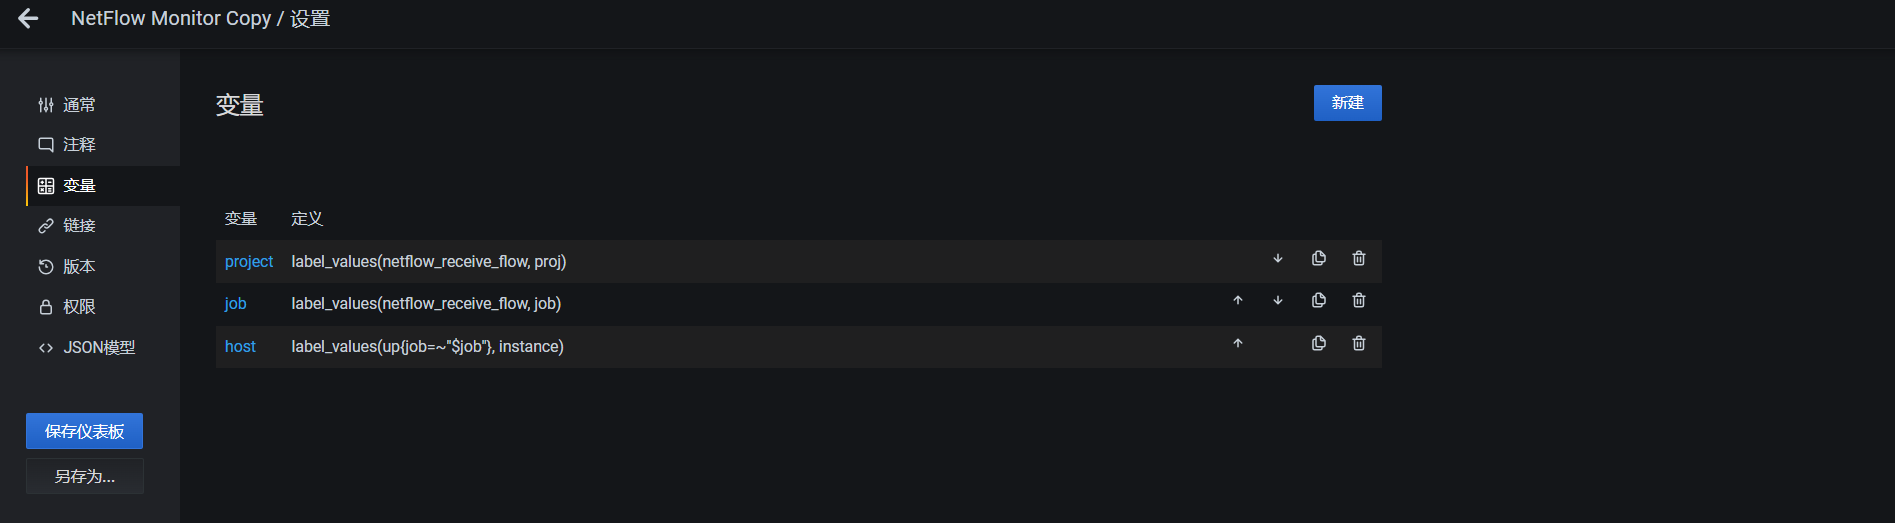
1.设置变量
2.修改Y坐标的单位为kibibytes(1kibibytes = 1024b),kilobytes(1kilobytes = 1000b)
我这里选择kibibytes
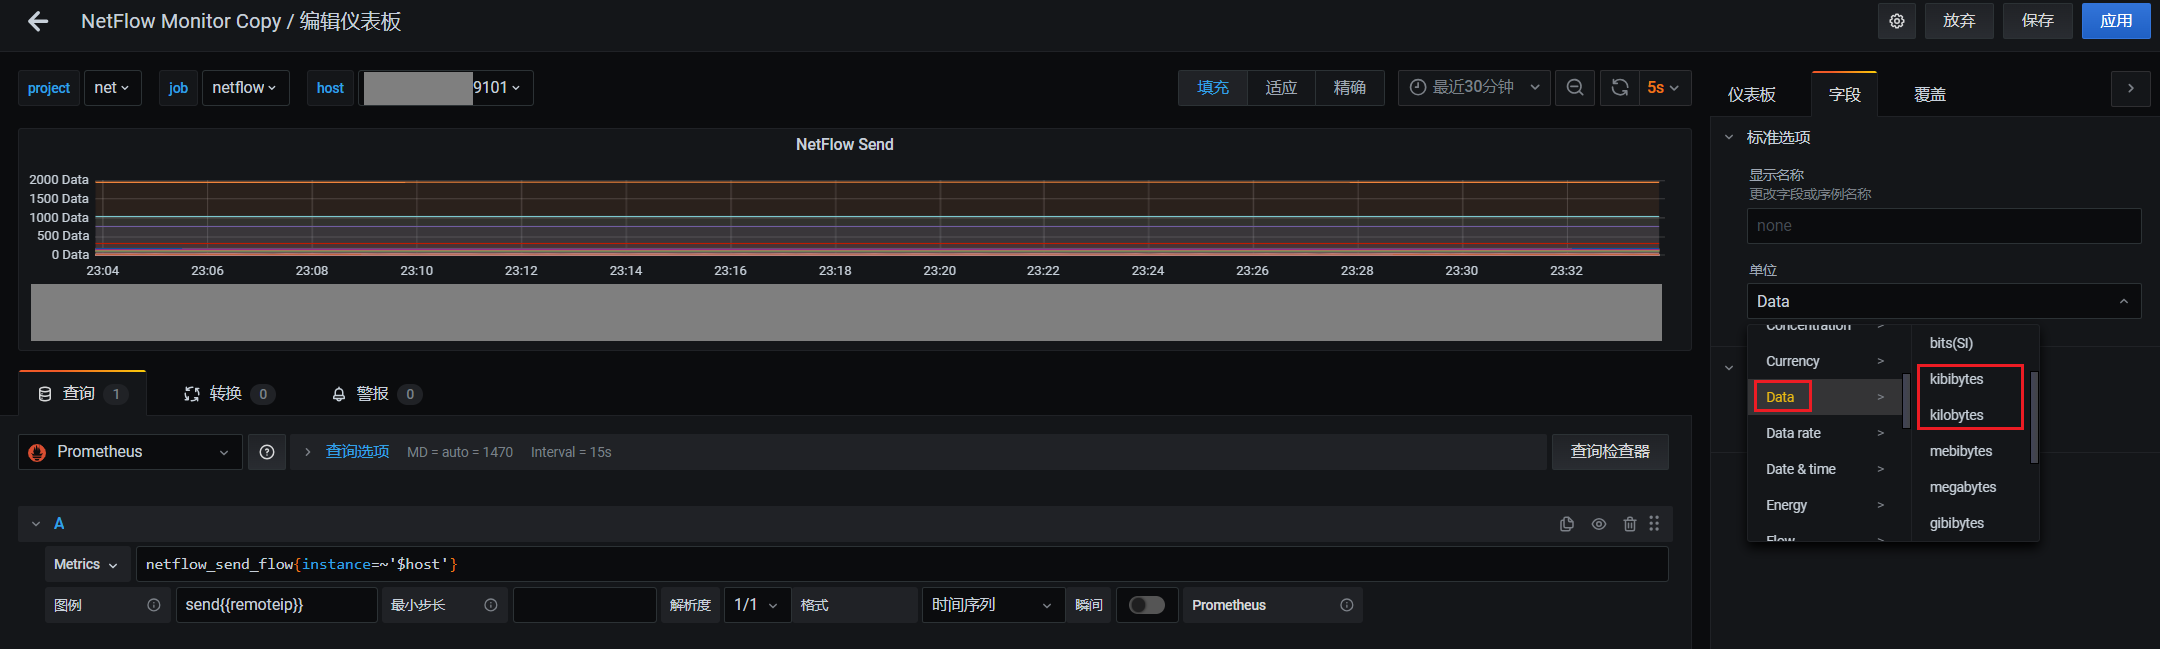
3.增加发送和接收的面板

流量走向监控基本思想和实现代码介绍到这里,后面还会继续优化。欢迎评论交流,转发和点赞,收藏!
同时也介绍下个人公众号:运维仙人,期待您的关注。


 2129
2129


 被折叠的 条评论
为什么被折叠?
被折叠的 条评论
为什么被折叠?
 到【灌水乐园】发言


