


*最终实现的效果图:中间部分是最终实现的效果图

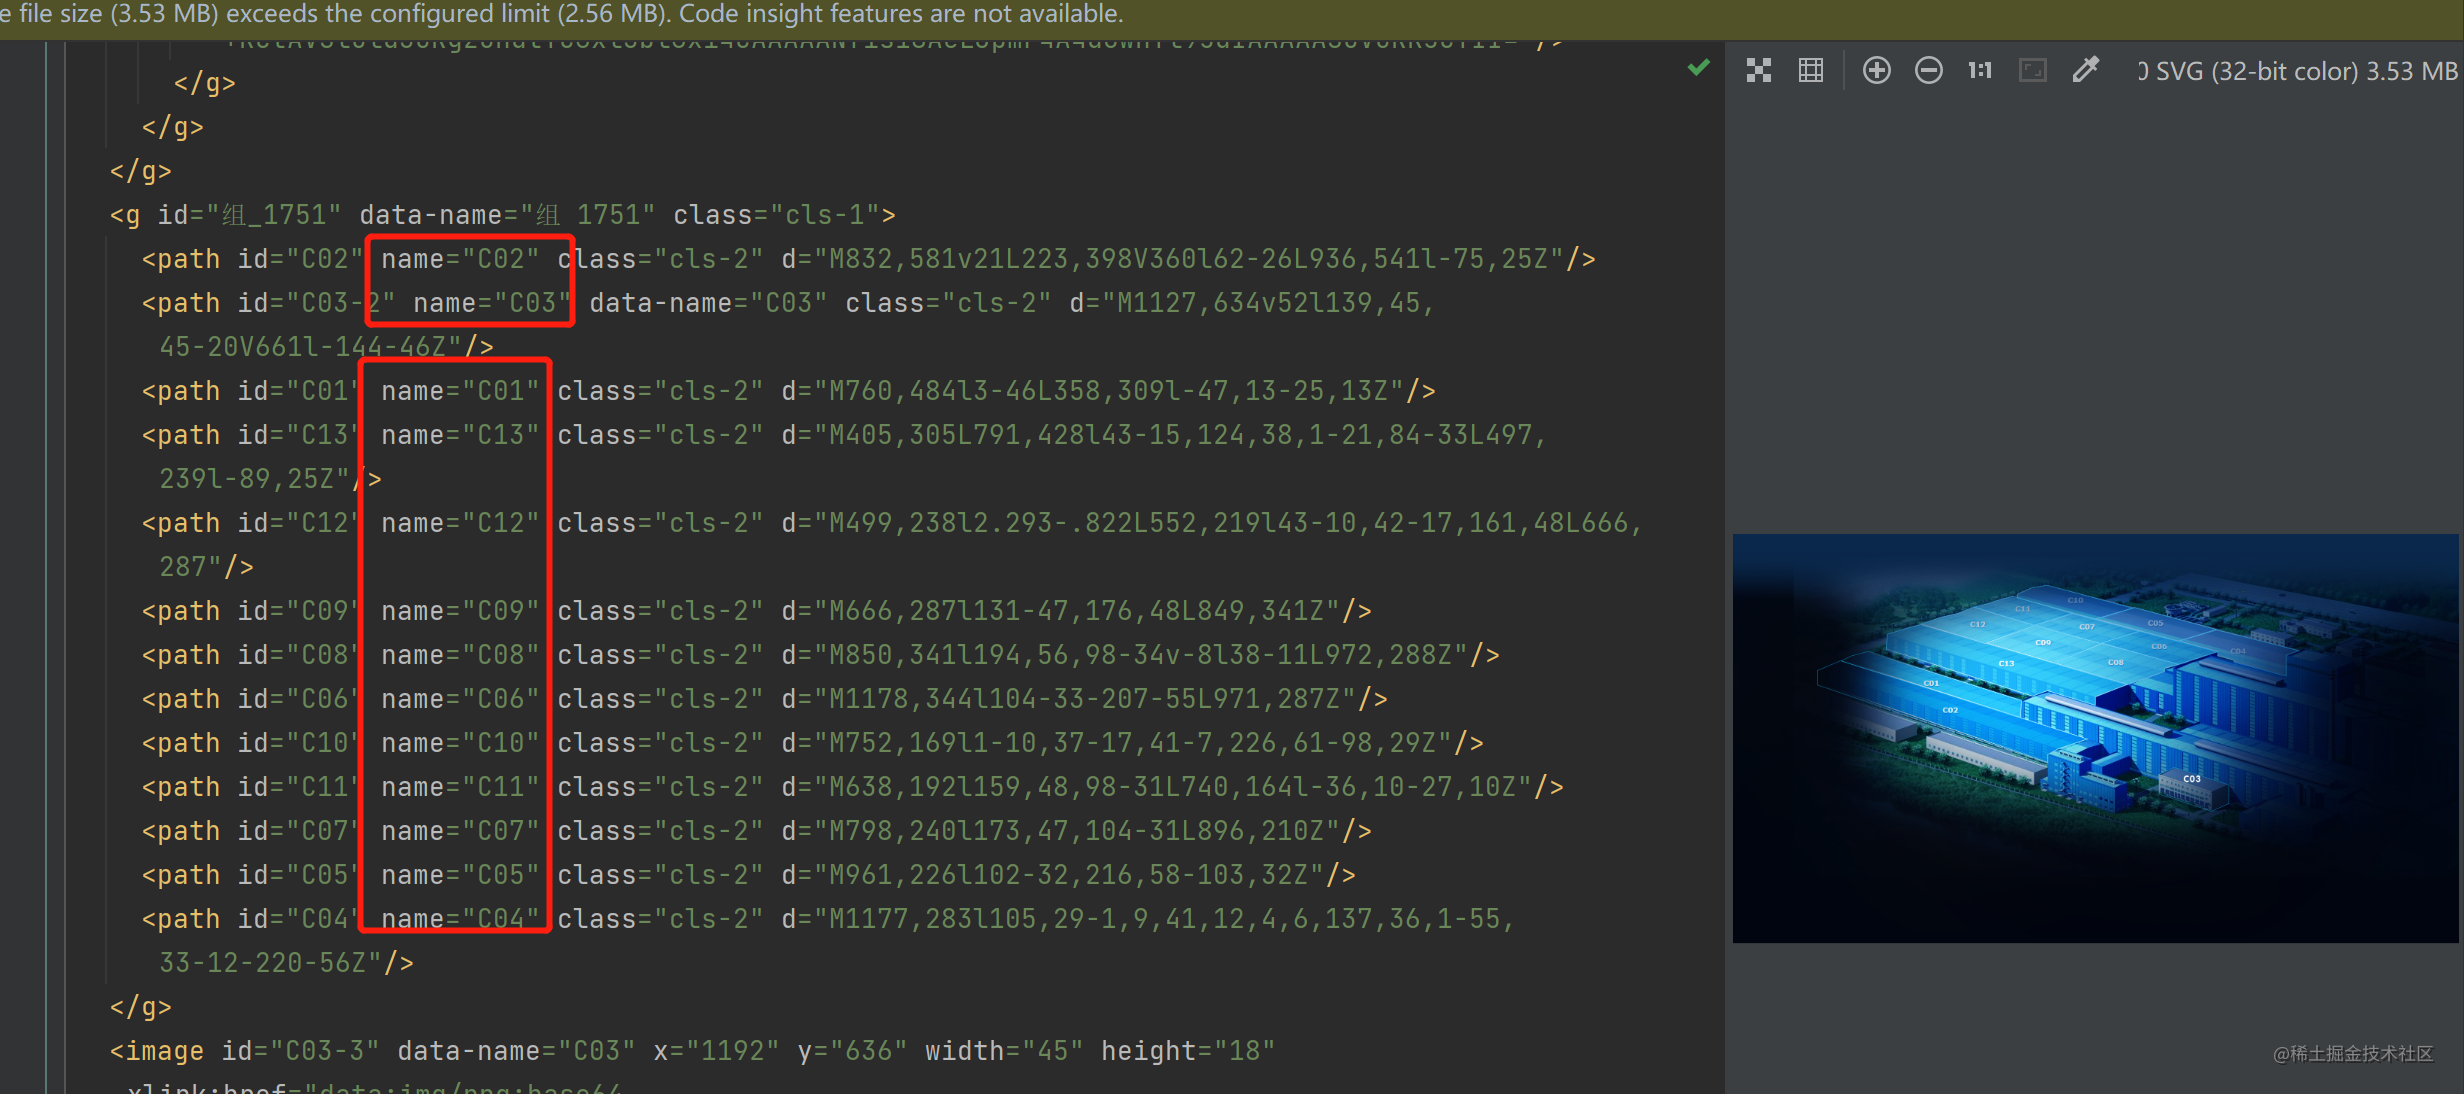
- 第一步:跟UI沟通,请UI提供对应的SVG图并且切好对应的块,如(C01-C13的块),下面的图片是我这边引入厂图的SVG,一般情况下,UI提供的SVG是没有name值的,这就需要我们自己添加上去!!!(重点!重点!重点!必须要添加name值,不然Echarts没法识别对应的位置)
2.第二步:引入SVG到Echarts里,并对SVG进行数据联调,实现最终的效果
const myChart = echarts.init(document.getElementById('factoryDrawing'));
//data里存放C01-C13的数据,原本是有13组数据的,但是太多了,我就只放三个
const data = [

    {
        name: 'C01', // 和SVG的name对应
        title: 'C01库存信息',
        list: [
            {
                title: '库存预警值(吨)',
                label: 1000,
            }, {
                title: '实际库存(吨)',
                label: 850,
            }, {
                title: '其中原板(吨)',
                label: 300,
            }, {
                title: '在制品(吨)',
                label: 250,
            }, {
                title: '产成品(吨)',
                label: 300,
            },
        ]
    },
    {
        name: 'C02',
        title: 'C02库存信息',
        list: [
            {
                title: '库存预警值(吨)',
                label: 1000,
            }, {
                title: '实际库存(吨)',
                label: 850,
            }, {
                title: '其中原板(吨)',
                label: 300,
            }, {
                title: '在制品(吨)',
                label: 250,
            }, {
                title: '产成品(吨)',
                label: 300,
            },
        ]
    },
    {
        name: 'C03',
        title: 'C03库存信息',
        list: [
            {
                title: '库存预警值(吨)',
                label: 1000,
            }, {
                title: '实际库存(吨)',
                label: 850,
            }, {
                title: '其中原板(吨)',
                label: 300,
            }, {
                title: '在制品(吨)',
                label: 250,
            }, {
                title: '产成品(吨)',
                label: 300,
            },
        ]
    }
];

data.map(item => {
    Object.assign(item, {
        itemStyle: {
            color: 'transparent', // 引入SVG后,UI切好的块可能会显示黑色,这就需要我们手动改变黑色块的背景色
        },
        emphasis: {
            label: {
                show: false, //如果UI提供的SVG上有对应块的name值就隐藏,没有就可以不隐藏
            }
        },
        tooltip: { //这是鼠标悬浮在对应的块上显示对应的提示(效果图3红框)
            formatter(param) {
                return `<div class='factoryDrawingTooltip'>
                    <div class="factoryDrawingTooltipHead flex-align">
                        <img class="factoryDrawingTooltipImg" src="../common/image/factoryDrawingTooltipLocation.png" alt="">
                        ${param.name}库存信息
                    </div>
                    <div class="factoryDrawingTooltipList">
                        ${
                    item.list.map((listItem, listIndex) => `
                                <div class="factoryDrawingTooltipListItem flex">
                                    <div>${listItem.title}</div>
                                    <div class="factoryDrawingTooltipListItemLabel ${listIndex === 0 ? 'fontGlowOrange' : 'fontGlow'}">${listItem.label}</div>
                                </div>
                            `).join('')
                }
                    </div>
                </div>`
            }
        }
    })
})
$.get('../common/image/factoryDrawing.svg', function (svg) {
    echarts.registerMap('factoryDrawing', {svg: svg}); //这里的factoryDrawing必须要和geo里面的map值统一
    let option = {
        visualMap: { // 这块内容对最终效果图没啥作用,但是又必须要要写,不写就不显示,写了也不影响效果图
            left: 'center',
            bottom: '200%',
            min: 5,
            max: 100,
            orient: 'horizontal',
            text: ['', 'Price'],
            realtime: true,
            calculable: true,
            inRange: {
                color: ['#cf0000']
            }
        },
        tooltip: {
            className: 'factoryDrawing',
            triggerOn: 'mousemove' // 只做鼠标悬浮效果
        },
        emphasis: {
            itemStyle: {
                color: 'transparent',
                areaColor: new echarts.graphic.LinearGradient(0, 0, 0, 1, [
                    {offset: 0, color: "rgb(255,120,21,0.3)"},
                    {offset: 0.5, color: "rgba(255,120,21, 0.49)"},
                    {offset: 1, color: "rgba(255,120,21, 0.8)"},
                ]), // 鼠标悬浮对应的块显示橙色
                borderColor: 'rgba(236,106,0, 0.49)',
                borderWidth: 2,
            },
        },
        geo: {
            name: 'factoryDrawing',
            map: 'factoryDrawing',
            roam: false,
            zoom: 1.4, // 缩放
            selectedMode: false,
            regions: data
        }
    };
    myChart.setOption(option);
});
图3:


 被折叠的 条评论
为什么被折叠?
被折叠的 条评论
为什么被折叠?
 到【灌水乐园】发言


