


URL监控
通过blackbox-exporter组件监控
组件部署位置192.168.0.39
创建组件配置文件
/data/prometheus_dir/blackbox_exporter/blackbox.yml
modules:
  http_2xx:
    prober: http
  http_post_2xx:
    prober: http
    http:
      method: POST
  tcp_connect:
    prober: tcp
  pop3s_banner:
    prober: tcp
    tcp:
      query_response:
      - expect: "^+OK"
      tls: true
      tls_config:
        insecure_skip_verify: false
  ssh_banner:
    prober: tcp
    tcp:
      query_response:
      - expect: "^SSH-2.0-"
  irc_banner:
    prober: tcp
    tcp:
      query_response:
      - send: "NICK prober"
      - send: "USER prober prober prober :prober"
      - expect: "PING :([^ ]+)"
        send: "PONG ${1}"
      - expect: "^:[^ ]+ 001"
  icmp:
    prober: icmp
启动组件容器
docker run -d \
-p 9300:9115 \
--name blackbox_exporter \
--restart=always \
--restart=on-failure:5 \
-v /usr/share/zoneinfo/Asia/Shanghai:/etc/localtime:ro \
-v /data/prometheus_dir/blackbox_exporter/blackbox.yml:/config/blackbox.yml \
prom/blackbox-exporter:master \
--config.file=/config/blackbox.yml
prometheus集成blackbox组件
prometheus.yml
添加
# http检测配置
  - job_name: 'blackbox'
    scrape_interval: 10s
    metrics_path: /probe
    params:
      module: [http_2xx]
    static_configs:
      - targets:
        - https://www.baidu.com
        - https://www.aliyun.com
    relabel_configs:
      - source_labels: [__address__]
        target_label: __param_target
      - source_labels: [__param_target]
        target_label: instance
      - target_label: __address__
        replacement: 192.168.0.39:9300
重启prometheus
添加告警规则
http_export-alert-rules.yaml
groups:
    - name: nginx状态-监控告警
      rules:
      - alert: 状态码检测
        expr: probe_http_status_code{job="blackbox"} != 200
        for: 0m
        labels:
          severity: warning
          status: 非常严重
        annotations:
          summary: "请求URL状态码非200"
          description: "请求{{$.Labels.instance}}状态码非200"

      - alert: 证书过期时间检测
        expr: probe_ssl_earliest_cert_expiry {job="blackbox"} -time() < 86400 * 30
        for: 5m
        labels:
          serverity: warning
          status: 警告
        annotations:
          summary: "证书过期时间不足30天"
          description: "{{$.Labels.instance}}证书还有30天到期,请及时更换"

      - alert: 页面响应时间检测
        expr: probe_duration_seconds{job="blackbox"} >= 1
        for: 1m
        labels:
          serverity: warning
          status: 警告
        annotations:
          summary: "页面响应时间超过1秒"
          description: "{{$.Labels.instance}}页面响应时间超过1秒"
重启prometheus生效
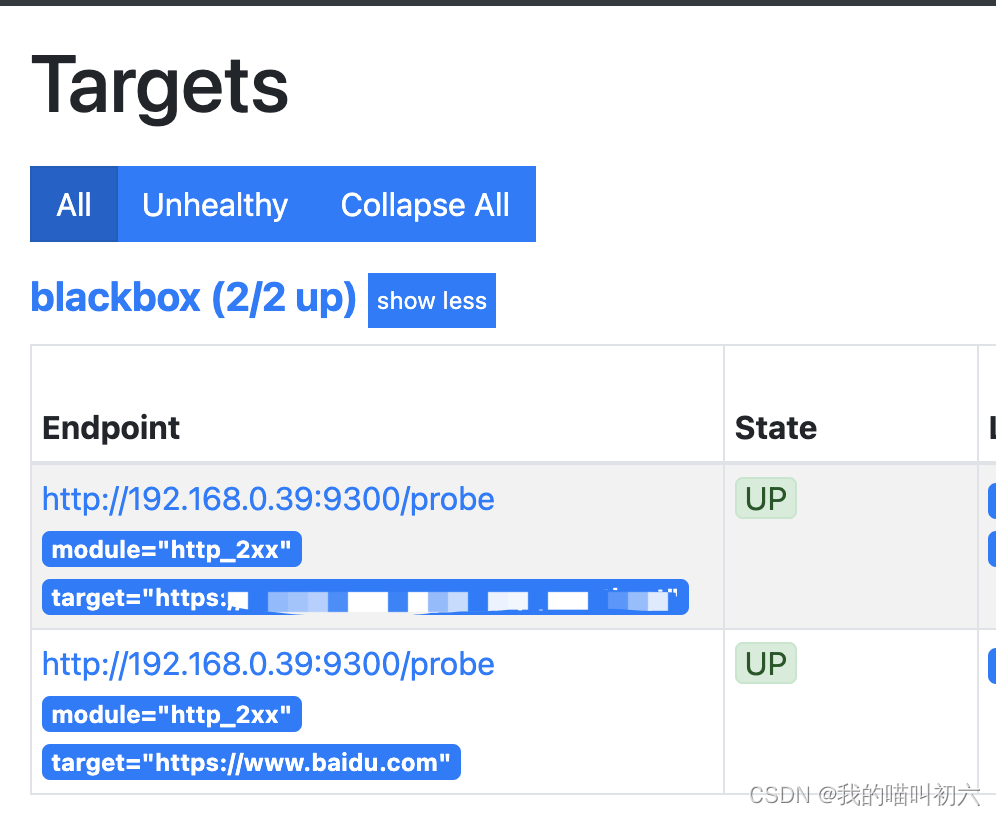
添加grafana图形
https://grafana.com/grafana/dashboards/7587
----------------------------------------------------------------------------
post请求监控
因为post请求的headers头和body不同,所以要想监控post请求就需要根据headers和body做自定义模块
举例:
url:https://aaa.bbb.com/api
headers:
userid:1111111
body:
{"templateKey":"AD_MA","ext":{"skuId":"-1"}}
可以用postman工具去进行请求测试一下是否能正常返回接口内容
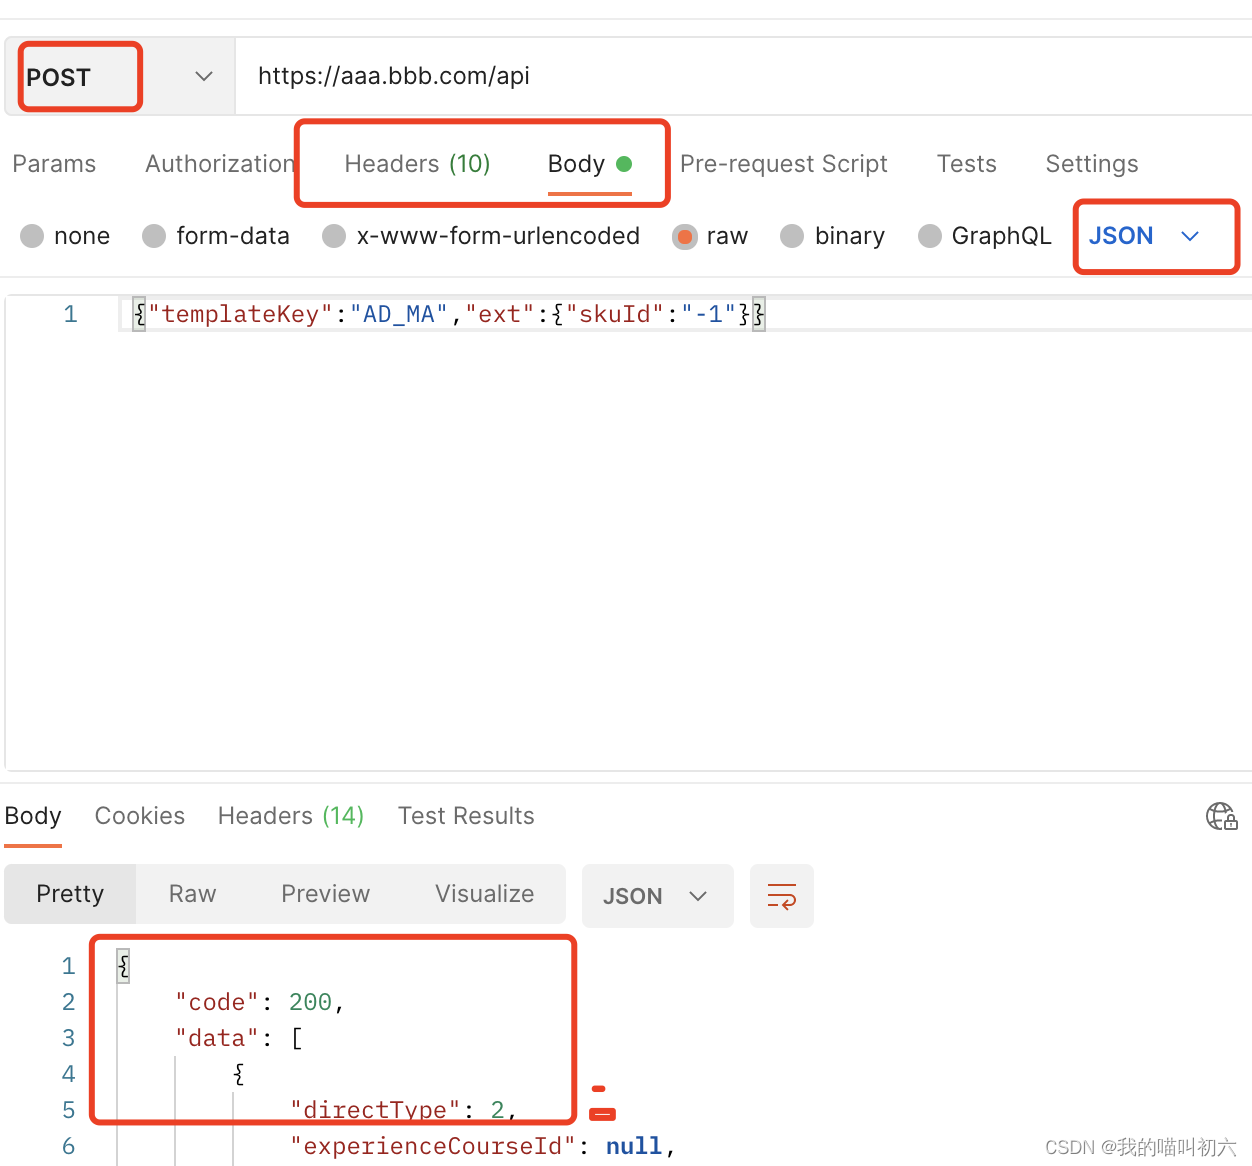
可以看到返回数据正常,接下来就可以配置模块了
vim /data/prometheus_dir/blackbox_exporter/blackbox.yml
POST_api:  # 模块名称
    prober: http
    timeout: 30s
    http:
      method: POST
      headers:
        Content-Type: application/json
        userid: 111111
      body: {"templateKey":"AD_MA","ext":{"skuId":"-1"}}
vim prometheus.yml
监控集成到prometheus中
  - job_name: 'blackbox_POST_api'
    scrape_interval: 20s
    metrics_path: /probe
    params:
      module: [POST_api]  # 匹配模块名称
    static_configs:
      - targets:
        - https://aaa.bbb.com
        labels:
          url_name: "POST xxxxapi"  # 自定义的一个标签,后续可以直接显示到告警中方便查看
    relabel_configs:
      - source_labels: [__address__]
        target_label: __param_target
      - source_labels: [__param_target]
        target_label: instance
      - target_label: __address__
        replacement: 192.168.0.39:9300
prometheus重启后会出现刚刚加入的监控,这里名称是我真实的,所以不匹配,无需在意

告警:
下面是两个告警规则,因为有的url接口就是慢,也不影响业务,所以统一配置成超过1秒告警,会导致某些时间频繁报警,所以可以根据 =~ 和 = 的方法配置某一个规则大于1.5秒才告警
      - alert: 页面响应时间检测
        expr: probe_duration_seconds{job="blackbox_POST_choiceList"} >= 1.5
        for: 1m
        labels:
          serverity: warning
          status: 警告
        annotations:
          summary: "{{$.Labels.instance}}页面响应时间超过2秒"
          description: "服务:{{$.Labels.url_name}}---响应时间>=1.5s,(当前:{{$value}})"
- alert: 页面响应时间检测
expr: probe_duration_seconds{job=~"blackbox.*",job!="blackbox_POST_choiceList"} >= 1
for: 1m
labels:
serverity: warning
status: 警告
annotations:
summary: "{{$.Labels.instance}}页面响应时间超过1秒"
description: "服务:{{$.Labels.url_name}}---响应时间>=1s,(当前:{{$value}})"告警消息

上一篇:nginx监控
prometheus监控传统环境监控(二)_我的喵叫初六的博客-CSDN博客
下一篇:kafka监控
待续


 1818
1818


 被折叠的 条评论
为什么被折叠?
被折叠的 条评论
为什么被折叠?
 到【灌水乐园】发言


