


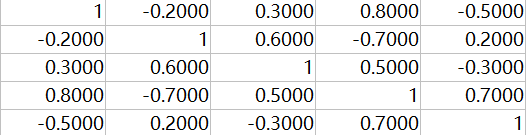
首先上效果图。矩阵X值为
矩阵色块图显示如下:

具体操作如下:
在https://ww2.mathworks.cn/matlabcentral/fileexchange/25536-red-blue-colormap下载redblue.m文件,放入matlab当前工作文件夹中

运行
>> colormap(redblue)
>> imagesc(x)
>> colorbar
即可,其中x是要生成色块图的矩阵。
首先上效果图。矩阵X值为
矩阵色块图显示如下:
具体操作如下:
在https://ww2.mathworks.cn/matlabcentral/fileexchange/25536-red-blue-colormap下载redblue.m文件,放入matlab当前工作文件夹中
运行
>> colormap(redblue)
>> imagesc(x)
>> colorbar
即可,其中x是要生成色块图的矩阵。


 被折叠的 条评论
为什么被折叠?
被折叠的 条评论
为什么被折叠?
 到【灌水乐园】发言


 3981
3981


