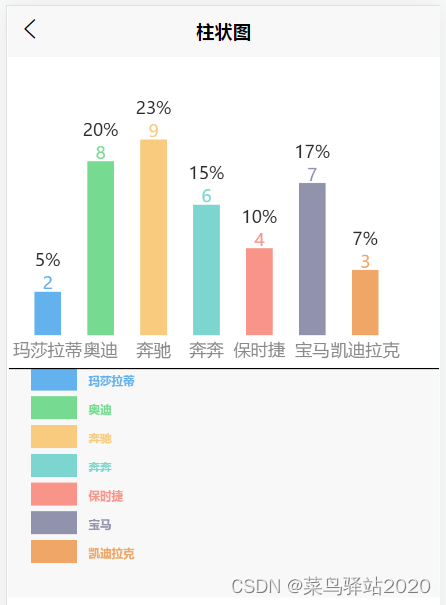
uniapp 使用canvas制作柱状图

效果图:

在这里插入图片描述

实现思路:
1、通过展示数据计算需要画几根柱子;
2、通过组件宽度、高度计算出每根柱子的宽度及高度;
3、for循环依次绘制每根柱子;
4、绘制柱子时,先绘制顶部百分比、value值,再绘制柱子,再绘制底部标题;
5、文字需要居中,可绘制前丈量文字宽度再确定起始坐标。

<template>
	<view class="container">
		<canvas canvas-id="columnarCanvas" id="columnarCanvas" style="width:750rpx; height:500rpx; margin-top:20px;" ></canvas>
		<canvas canvas-id="testCanvas" style="width:750rpx; height:400rpx; background-color: #f8f8f8;"></canvas>
	</view>
</template>

<script>
	export default {
		data() {
			return {
				canvasInfo: { },
				dataList: [{
					title: "玛莎拉蒂",
					value: 2
				}, {
					title: "奥迪",
					value: 8
				}, {
					title: "奔驰",
					value: 9
				}, {					
					title: "奔奔",
					value: 6
				}, {
					title: "保时捷",
					value: 4
				}, {
					title: "宝马",
					value: 7
				}, {
					title: "凯迪拉克",
					value: 3
				}]
			}
		},

		onReady() {
			this.getCanvasInfo()
			this.drawTest()
		},

		methods: {
			/** 获取节点信息,动态得到组件的宽度,高度 **/
			getCanvasInfo() {
				var view = uni.createSelectorQuery().in(this).select("#columnarCanvas"); 
				view.fields({ size: true, rect: true }, res => {
				  // console.log("得到节点信息" + JSON.stringify(res))
					var canvasInfo = {}
					canvasInfo.width = res.width
					canvasInfo.height = res.height
					this.canvasInfo = canvasInfo
					// 调用方法画图
					this.drawColumnar()
				}).exec();
			},
			
			/** 画图 **/
			drawColumnar() {
				const ctxColumnar = uni.createCanvasContext("columnarCanvas")
				var dataList = this.dataList
				var canvasInfo = this.canvasInfo
				var columnarNum = dataList.length
				var columnarWidth = (canvasInfo.width - 30) / (2 * columnarNum + 1)
				// console.log("宽度", columnarWidth)
				var maxColumnarHeight = canvasInfo.height - 60 - 20
				var maxColumnarValue = 0
				var totalValue = 0
				for (var i = 0; i < dataList.length; i++) {
					if (dataList[i].value > maxColumnarValue) {
						maxColumnarValue = dataList[i].value
					}
					totalValue = totalValue + dataList[i].value
				}
				for (var i = 0; i < dataList.length; i++) {
					ctxColumnar.setFontSize(15)
					var percent = parseInt(dataList[i].value * 100 / totalValue) + "%"
					var dx = columnarWidth * (2 * i + 1)
					var dy = canvasInfo.height - (maxColumnarHeight * (dataList[i].value / maxColumnarValue) + 60) + 10
					ctxColumnar.setFillStyle('#2b2b2b')
					var percentWidth = ctxColumnar.measureText(percent)
					ctxColumnar.fillText(percent, dx + columnarWidth / 2 - percentWidth.width / 2, dy)
					// ctxColumnar.setFillStyle('rgb(99, 112, 210)')
					ctxColumnar.setFillStyle(this.randomColor(i)) //指定每条柱子不同颜色
					var valueWidth = ctxColumnar.measureText(dataList[i].value + "")
					ctxColumnar.fillText(dataList[i].value + "", dx + columnarWidth / 2 - valueWidth.width / 2, dy + 20)
					ctxColumnar.fillRect(dx, dy + 22, columnarWidth, maxColumnarHeight * (dataList[i].value / maxColumnarValue))
					ctxColumnar.setFillStyle('#8a8a8a')
					var titleWidth = ctxColumnar.measureText(dataList[i].title + "")
					ctxColumnar.fillText(dataList[i].title, dx + columnarWidth / 2 - titleWidth.width / 2, canvasInfo.height - 10)
				}
				ctxColumnar.draw()
			},
			
			/**随机指定颜色**/
			randomColor(index) {
				let colorList = ["#63b2ee","#76da91","#f8cb7f","#7cd6cf","#f89588","#9192ab","#efa666","#7898e1","#eddd86","#9987ce","#76da91","#63b2ee"]
				// let index = Math.floor(Math.random() * colorList.length)
				return colorList[index]
			},
			
			/**画图测试**/
			drawTest() {
				const ctx = uni.createCanvasContext('testCanvas')
				let dataList = this.dataList
				let x = 20, y = 0, w = 40, h = 20

				for (var i = 0; i < dataList.length; i++) {
					// 矩形
					ctx.fillStyle = this.randomColor(i)
					ctx.fillRect(x, y, w, h) // x,y,w,h
					// 设置字体样式
					ctx.font = 'bold 10px Arial'
					// 设置文本颜色
					ctx.fillStyle = this.randomColor(i)
					// 文本
					ctx.fillText(dataList[i].title, x+w+10, y+15)
					// 每行偏离距离
					y = y + 25
				}
				
				// 线条
				ctx.beginPath()
				ctx.moveTo(1, 1) //起点坐标
				ctx.lineTo(400, 1) //终点坐标
				ctx.stroke()
				
				// 进行绘制
				ctx.draw()
			}
			
			
		}
	}
</script>

<style>

</style>
  • 9
    点赞
  • 10
    收藏
    觉得还不错? 一键收藏
  • 0
    评论
好的,下面给您提供一个基于 UniappCanvas 实现折线柱状图的代码示例: ``` <template> <canvas class="canvas" canvas-id="myCanvas"></canvas> </template> <script> export default { onReady() { // 获取 Canvas 上下文对象 const ctx = uni.createCanvasContext('myCanvas', this); // 绘制折线图 drawLineChart(ctx); // 绘制柱状图 drawBarChart(ctx); } } // 绘制折线图 function drawLineChart(ctx) { // 坐标轴起点和终点的坐标 const xStart = 50, yStart = 200, xEnd = 350, yEnd = 50; // 绘制坐标轴 ctx.beginPath(); ctx.moveTo(xStart, yStart); ctx.lineTo(xStart, yEnd); ctx.lineTo(xEnd, yEnd); ctx.stroke(); // 绘制坐标轴上的文本 ctx.fillText('x轴', xEnd + 10, yEnd + 10); ctx.fillText('y轴', xStart - 10, yStart - 10); // 绘制数据点 const data = [50, 70, 90, 60, 80]; const interval = (xEnd - xStart) / (data.length - 1); for (let i = 0; i < data.length; i++) { const x = xStart + interval * i; const y = yStart - (data[i] - yEnd) * (yStart - yEnd) / (yStart - yEnd + 10); ctx.beginPath(); ctx.arc(x, y, 3, 0, 2 * Math.PI); ctx.fill(); } // 绘制数据点之间的连线 ctx.beginPath(); for (let i = 0; i < data.length; i++) { const x = xStart + interval * i; const y = yStart - (data[i] - yEnd) * (yStart - yEnd) / (yStart - yEnd + 10); if (i === 0) { ctx.moveTo(x, y); } else { ctx.lineTo(x, y); } } ctx.stroke(); } // 绘制柱状图 function drawBarChart(ctx) { // 坐标轴起点和终点的坐标 const xStart = 400, yStart = 200, xEnd = 700, yEnd = 50; // 绘制坐标轴 ctx.beginPath(); ctx.moveTo(xStart, yStart); ctx.lineTo(xStart, yEnd); ctx.lineTo(xEnd, yEnd); ctx.stroke(); // 绘制坐标轴上的文本 ctx.fillText('x轴', xEnd + 10, yEnd + 10); ctx.fillText('y轴', xStart - 10, yStart - 10); // 绘制数据柱 const data = [50, 70, 90, 60, 80]; const interval = (xEnd - xStart) / (data.length + 1); for (let i = 0; i < data.length; i++) { const x = xStart + interval * (i + 1); const y = yEnd + (yStart - yEnd) * data[i] / (yStart - yEnd + 10); const width = interval / 2; const height = yStart - y; ctx.fillRect(x - width / 2, y, width, height); } } </script> <style> .canvas { width: 100%; height: 300px; } </style> ``` 上述代码中,我们先在模板中定义了一个 Canvas 元素,并指定了其 id 为 `myCanvas`。在 `onReady` 生命周期回调函数中,我们获取了该元素的 Canvas 上下文对象,然后分别调用了 `drawLineChart` 和 `drawBarChart` 两个函数来绘制折线图和柱状图。 在 `drawLineChart` 函数中,我们先绘制了坐标轴,并在坐标轴的两端分别绘制了文字,然后根据传入的数据,在坐标轴上绘制了对应的数据点,并且绘制了相邻数据点之间的连线。 在 `drawBarChart` 函数中,我们也先绘制了坐标轴和对应的文字,然后根据传入的数据,绘制了对应的数据柱。 最后,我们还定义了一个样式表,将 Canvas 的宽度设置为 100%。

“相关推荐”对你有帮助么?

  • 非常没帮助
  • 没帮助
  • 一般
  • 有帮助
  • 非常有帮助
提交
评论
添加红包

请填写红包祝福语或标题

红包个数最小为10个

红包金额最低5元

当前余额3.43前往充值 >
需支付:10.00
成就一亿技术人!
领取后你会自动成为博主和红包主的粉丝 规则
hope_wisdom
发出的红包
实付
使用余额支付
点击重新获取
扫码支付
钱包余额 0

抵扣说明:

1.余额是钱包充值的虚拟货币,按照1:1的比例进行支付金额的抵扣。
2.余额无法直接购买下载,可以购买VIP、付费专栏及课程。

余额充值