


柱状图1
组件:
<template>
  <div :id="ids" style="width: 100%; height: 100%" class="barHeight"></div>
</template>
<script>
import * as echarts from 'echarts'

export default {
  props: {
    chartData: {
      default: function () {
        return []
      }
    },
    ids: {
      // id
      type: String,
      default: 'echartsbar'
    },
    fontColor: {
      // 字体颜色
      type: String,
      default: '#89949F'
    },
    yLine: {
      // x轴分割线
      default: false
    },
    unit: {
      // 单位
      default: function () {
        return '人'
      }
    },
    unitName: {
      default: function () {
        return '单位: '
      }
    },
    barWidth: {
      default: 16
    },
    theme: {
      default: function () {
        return ['#00c6ff', '#006cff']
      }
    }
  },
  data() {
    return {
      mychart: null
    }
  },
  mounted() {
    this.mychart = echarts.init(document.getElementById(this.ids))
  },
  watch: {
    chartData: {
      handler() {
        this.$nextTick(() => {
          if (this.chartData && this.chartData.length > 0) {
            this.drawChart()
          }
        })
      },
      deep: true, // 深度监听,可监听到对象、数组的变化
      immediate: true // 立刻执行
    }
  },
  methods: {
    drawChart() {
      // 绘制图表
      const _this = this
      const option = {
        title: {
          show: false
        },
        grid: {
          left: 30,
          right: 20,
          top: 30,
          bottom: 0,
          containLabel: true
        },
        tooltip: {
          trigger: 'axis',
          formatter: function (data) {
            let html = ''
            html = '<div class="toolTips">'
            for (let i = 0; i < data.length; i++) {
              html += `<div style="font-size: 12px;color: #fff">${data[i].name}: ${data[i].value} ${_this.unit}</div>`
            }
            html += '</div>'
            return html
          },
          backgroundColor: '#487892',
          borderWidth: 0,
          padding: [3, 5]
        },
        xAxis: [
          {
            type: 'category',
            data: this.chartData.map((item) => item.name),
            axisLabel: {
              color: this.fontColor,
              fontSize: 12
            },
            axisTick: {
              show: false
            },
            axisLine: {
              lineStyle: {
                color: 'rgba(135,142,148,0.5)'
              }
            }
          }
        ],
        yAxis: {
          type: 'value',
          name: this.unitName + this.unit,
          nameTextStyle: {
            fontSize: 12,
            color: this.fontColor
          },
          splitNumber: 5,
          position: 'left',
          axisTick: {
            show: false
          },
          splitLine: {
            show: this.yLine,
            lineStyle: {
              color: 'rgba(153, 153, 153, 0.3)'
            }
          },
          axisLine: {
            show: false
          },
          axisLabel: {
            color: this.fontColor,
            fontSize: 12
          }
        },
        series: [
          {
            type: 'bar',
            label: {
              show: true,
              position: 'top',
              color: '#fff'
            },
            data: this.chartData.map((item) => Number(item.num)),
            barWidth: this.barWidth,
            itemStyle: {
              normal: {
                barBorderRadius: 2,
                color: new echarts.graphic.LinearGradient(0, 0, 0, 1, [
                  {
                    offset: 0,
                    color: this.theme[0]
                  },
                  {
                    offset: 1,
                    color: this.theme[1]
                  }
                ])
              }
            }
          }
        ]
      }
      this.mychart.clear()
      this.mychart.setOption(option, true)
    }
  }
}
</script>
<style scoped></style>
调用:
<EchartsBar
              v-if="data.length"
              style="height: 260px"
              class="mt-4"
              unitName="含沙量: "
              unit="kg/m³"
              ids="sediment1"
              :yLine="true"
              :chartData="data"
              :theme="['#2AA0FF', 'rgba(0, 0, 0, 0)']"
            ></EchartsBar>
数据:
data =  [
          {
            name: '玉林',
            num: 0.458
          },
          {
            name: '玉松',
            num: 0.363
          },
          {
            name: '希让',
            num: 0.421
          },
          {
            name: '黄河头道拐',
            num: 4.6
          },
          {
            name: '金沙江溪洛渡',
            num: 1.72
          }
        ]
效果:

柱状图2
组件:
<template>
  <div :id="baseConfig.ids" style="width: 100%; height: 100%"></div>
</template>
<script>
export default {
  props: {
    data: {
      default: function() {
        return [];
      }
    },
    baseConfig: {
      default: function() {
        return {
          ids: "EchartsBar",
          title: "",
          unit: "人"
        };
      }
    },
    showLabel: {
      default: true
    },
    barWidth: {
      default: 12
    },
    barClick: {
      type: Function
    },
    yNamePadding: {
      default: function() {
        return [0, 0, 10, -30];
      }
    },
    gridLeft: {
      //盒子左边距
      default() {
        return 30;
      }
    }
  },
  data() {
    return {
      mychart: null,
      color: ["#88d4ff", "#3a89ff"]
    };
  },
  mounted() {
    this.mychart = this.$echarts.init(
      document.getElementById(this.baseConfig.ids)
    );
    this.drawChart();
  },
  watch: {
    data: {
      //深度监听,可监听到对象、数组的变化
      handler() {
        this.$nextTick(() => {
          this.drawChart();
        });
      },
      deep: true
    }
  },
  methods: {
    drawChart() {
      const CubeLeft = new this.$echarts.graphic.extendShape({
        shape: {
          x: 0,
          y: 0
        },
        buildPath: (ctx, shape) => {
          const xAxisPoint = shape.xAxisPoint;
          const c0 = [shape.x, shape.y];
          const c1 = [shape.x - this.barWidth, shape.y - 4];
          const c2 = [xAxisPoint[0] - this.barWidth, xAxisPoint[1] - 4];
          const c3 = [xAxisPoint[0], xAxisPoint[1]];
          ctx
            .moveTo(c0[0], c0[1])
            .lineTo(c1[0], c1[1])
            .lineTo(c2[0], c2[1])
            .lineTo(c3[0], c3[1])
            .closePath();
        }
      });
      const CubeRight = new this.$echarts.graphic.extendShape({
        shape: {
          x: 0,
          y: 0
        },
        buildPath: (ctx, shape) => {
          const xAxisPoint = shape.xAxisPoint;
          const c1 = [shape.x - this.barWidth / 4, shape.y];
          const c2 = [xAxisPoint[0] - this.barWidth / 4, xAxisPoint[1]];
          const c3 = [xAxisPoint[0] + this.barWidth / 2, xAxisPoint[1] - 4];
          const c4 = [shape.x + this.barWidth / 2, shape.y - 4];
          ctx
            .moveTo(c1[0], c1[1])
            .lineTo(c2[0], c2[1])
            .lineTo(c3[0], c3[1])
            .lineTo(c4[0], c4[1])
            .closePath();
        }
      });
      const CubeTop = new this.$echarts.graphic.extendShape({
        shape: {
          x: 0,
          y: 0
        },
        buildPath: (ctx, shape) => {
          // 逆时针 角 y 负数向上  X 负数向左
          const c1 = [shape.x - this.barWidth / 4, shape.y + 4];
          const c2 = [shape.x + this.barWidth / 2, shape.y - 4];
          const c3 = [shape.x - this.barWidth / 4, shape.y - 4];
          const c4 = [shape.x - this.barWidth, shape.y - 4];
          ctx
            .moveTo(c1[0], c1[1])
            .lineTo(c2[0], c2[1])
            .lineTo(c3[0], c3[1])
            .lineTo(c4[0], c4[1])
            .closePath();
        }
      });
      new this.$echarts.graphic.registerShape("CubeLeft", CubeLeft);
      new this.$echarts.graphic.registerShape("CubeRight", CubeRight);
      new this.$echarts.graphic.registerShape("CubeTop", CubeTop);

      let TData = this.data.map(item => Number(item.num));
      let diffNum = Math.max(...TData) / 3;
      let dataShadow = [];
      for (var i = 0; i < this.data.length; i++) {
        dataShadow.push(((Math.max(...TData) + diffNum) * 100) / 100);
      }
      let option = {
        title: {
          show: false
        },
        grid: {
          left: this.gridLeft,
          right: 20,
          top: 40,
          bottom: this.data.length > 4 ? 10 : 5,
          containLabel: true
        },
        tooltip: {
          formatter: "{b}: {c}" + this.baseConfig.unit
        },
        xAxis: [
          {
            type: "category",
            data: this.data.map(item => item.name),
            triggerEvent: true,
            axisLabel: {
              formatter: function(value) {
                var res = value;
                if (res.length > 6) {
                  res = res.substring(0, 5) + "...";
                }
                return res;
              },
              fontFamily: "时尚中黑简体",
              interval: 0,
              rotate: this.data.length > 3 ? 15 : 0,
              color: "rgba(255,255,255,.8)",
              fontSize: 14,
              align: "center",
              padding: this.data.length > 3 ? [30, 0, 0, -24] : [0, 0, 0, -24]
            },
            axisTick: {
              show: false
            },
            axisLine: {
              lineStyle: {
                color: "rgba(135,142,148,0.5)"
              }
            }
          }
        ],
        yAxis: {
          type: "value",
          name: "单位(" + this.baseConfig.unit + ")",
          nameTextStyle: {
            fontSize: 14,
            color: "#9ca2a8",
            padding: this.yNamePadding
          },
          scale: false,
          axisLabel: {
            color: "#a0a5ab",
            fontSize: 14
          },
          splitLine: {
            show: true,
            lineStyle: {
              color: "rgba(255,255,255,.1)"
            }
          },
          axisLine: {
            show: false
          },
          axisTick: {
            show: false
          }
        },
        dataZoom: [
          {
            show: !!(this.data.length > 4),
            start: 0,
            end: this.data.length > 4 ? 30 : 100,
            height: 10,
            bottom: 8,
            textStyle: {
              color: "#e2e2e2"
            },
            borderColor: "#e2e2e2",
            handleIcon:
              "M512 512m-208 0a6.5 6.5 0 1 0 416 0 6.5 6.5 0 1 0-416 0Z M512 192C335.264 192 192 335.264 192 512c0 176.736 143.264 320 320 320s320-143.264 320-320C832 335.264 688.736 192 512 192zM512 800c-159.072 0-288-128.928-288-288 0-159.072 128.928-288 288-288s288 128.928 288 288C800 671.072 671.072 800 512 800z",
            handleColor: "#aab6c6",
            handleSize: 16,
            handleStyle: {
              borderColor: "#aab6c6",
              shadowBlur: 4,
              shadowOffsetX: 1,
              shadowOffsetY: 1,
              shadowColor: "#e5e5e5"
            }
          },
          {
            type: "inside",
            realtime: true
          }
        ],
        series: [
          {
            type: "custom",
            zlevel: 2,
            renderItem: (params, api) => {
              const location = api.coord([api.value(0), api.value(1)]);
              return {
                type: "group",
                children: [
                  {
                    type: "CubeLeft",
                    shape: {
                      api,
                      xValue: api.value(0),
                      yValue: api.value(1),
                      x: location[0],
                      y: location[1],
                      xAxisPoint: api.coord([api.value(0), 0])
                    },
                    style: {
                      fill: new this.$echarts.graphic.LinearGradient(
                        0,
                        0,
                        0,
                        1,
                        [
                          {
                            offset: 0.4,
                            color: "#93D884"
                          },
                          {
                            offset: 1,
                            color: "rgba(0,0,0,0)"
                          }
                        ]
                      )
                    }
                  },
                  {
                    type: "CubeRight",
                    shape: {
                      api,
                      xValue: api.value(0),
                      yValue: api.value(1),
                      x: location[0],
                      y: location[1],
                      xAxisPoint: api.coord([api.value(0), 0])
                    },
                    style: {
                      fill: new this.$echarts.graphic.LinearGradient(
                        0,
                        0,
                        0,
                        1,
                        [
                          {
                            offset: 0.4,
                            color: "#3FBB70" // 顶部
                          },
                          {
                            offset: 1,
                            color: "rgba(0,0,0,0)" // 底部
                          }
                        ]
                      )
                    }
                  },
                  {
                    type: "CubeTop",
                    shape: {
                      api,
                      xValue: api.value(0),
                      yValue: api.value(1),
                      x: location[0],
                      y: location[1],
                      xAxisPoint: api.coord([api.value(0), 0])
                    },
                    style: {
                      fill: new this.$echarts.graphic.LinearGradient(
                        0,
                        0,
                        0,
                        1,
                        [
                          {
                            offset: 0,
                            color: "#cbec8a"
                          },
                          {
                            offset: 1,
                            color: "#cbec8a"
                          }
                        ]
                      )
                    }
                  }
                ]
              };
            },
            data: TData
          },
          {
            type: "bar",
            label: {
              normal: {
                show: true,
                position: "top",
                distance: 10,
                fontSize: 16,
                color: "#97af58"
              }
            },
            barWidth: this.barWidth,
            itemStyle: {
              color: "transparent"
            },
            data: TData
          },
          {
            type: "bar",
            itemStyle: {
              borderColor: "rgba(151,175,88,0.5)",
              color: "rgba(0,0,0,0)"
            },
            barWidth: this.barWidth * 2.4,
            barGap: "-155%",
            tooltip: {
              show: false
            },
            cursor: "default",
            data: dataShadow,
            animation: false
          }
        ]
      };
      this.mychart.setOption(option);
      if (this.barClick) {
        let timer = null;
        //防止重复触发点击事件
        if (this.mychart._$handlers.click) {
          this.mychart._$handlers.click.length = 0;
        }
        this.mychart.on("click", params => {
          if (!timer) {
            timer = setTimeout(() => {
              console.log(this.data[0]);
              timer = null;
            }, 100);
          }
        });
      }
    }
  }
};
</script>
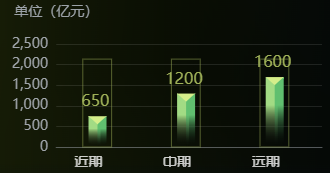
调用:
<EchartsBar
            :gridLeft="0"
            :yNamePadding="[0, 0, 10, 0]"
            :data="data"
            :baseConfig="{
              ids: 'EchartsBarinvestmentPlanning',
              title: '',
              unit: '亿元'
            }"
          ></EchartsBar>
数据:
data = [
        {
          name: "近期",
          num: 650
        },
        {
          name: "中期",
          num: 1200
        },
        {
          name: "远期",
          num: 1600
        }
      ]
效果:
柱状图3
组件:
<template>
  <div style="width: 100%; height: 100%" class="relative">
    <e-charts :option="options" ref="echarts" />
  </div>
</template>
<script>
import ECharts from '@/components/echarts/ECharts.vue'

export default {
  components: {
    ECharts
  },
  props: {
    data: {
      default: function () {
        return [
          {
            name: '区域1',
            value: 10
          },
          {
            name: '区域2',
            value: 20
          }
        ]
      }
    },
    theme: {
      default: function () {
        return ['#2ACAFF', '#0074C5']
      }
    },
    barWidth: {
      default: 15
    },
    showShadow: {
      default: true
    },
    unit: {
      default: ''
    }
  },
  data() {
    return {
      options: {}
    }
  },
  watch: {
    data: {
      handler() {
        this.initCharts()
      },
      deep: true
    }
  },
  mounted() {
    this.initCharts()
  },
  computed: {
    axisData() {
      return this.data.map((item) => {
        return item.name
      })
    },
    valueArr() {
      return this.data.map((item) => {
        return Number(item.value)
      })
    }
  },
  methods: {
    // 绘制图表
    async initCharts() {
      const instance = await this.$refs.echarts.wait()
      const option = {
        title: {
          show: false
        },
        grid: {
          left: 0,
          right: 10,
          top: 30,
          bottom: 20,
          containLabel: true
        },
        tooltip: {
          backgroundColor: '#000',
          borderWidth: 0,
          padding: [3, 5],
          textStyle: {
            color: '#fff'
          },
          formatter: '{b}: {c}' + this.unit
        },
        xAxis: [
          {
            type: 'category',
            data: this.axisData,
            axisLabel: {
              color: '#fff',
              fontSize: 14
            },
            axisTick: {
              show: false
            },
            axisLine: {
              lineStyle: {
                color: 'rgba(255,255,255,0.2)'
              }
            }
          }
        ],
        yAxis: {
          type: 'value',
          splitNumber: 3,
          splitLine: true,
          scale: true,
          axisLabel: {
            color: '#fff',
            fontSize: 16
          },
          axisLine: {
            lineStyle: {
              color: 'rgba(255,255,255,0.2)'
            }
          }
        },
        series: [
          {
            type: 'bar',
            data: this.valueArr,
            barMaxWidth: this.barWidth,
            barWidth: this.barWidth,
            showBackground: this.showShadow,
            backgroundStyle: {
              color: 'rgba(255, 255, 255, 0.05)'
            },
            itemStyle: {
              normal: {
                barBorderRadius: 2,
                color: new instance.echarts.graphic.LinearGradient(0, 0, 0, 1, [
                  {
                    offset: 0,
                    color: this.theme[0]
                  },
                  {
                    offset: 1,
                    color: this.theme[1]
                  }
                ])
              }
            },
            label: {
              normal: {
                show: this.showShadow,
                position: 'top',
                color: '#fff',
                fontSize: '16px'
              }
            }
          }
        ]
      }
      this.options = option
    }
  }
}
</script>
<style scoped></style>
调用:
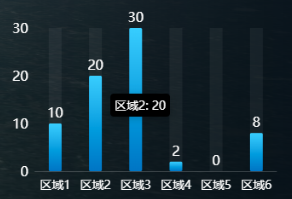
<EchartsBar :data="data" />
数据:
data = [
        {
          name: '区域1',
          value: 10
        },
        {
          name: '区域2',
          value: 20
        },
        {
          name: '区域3',
          value: 30
        },
        {
          name: '区域4',
          value: 2
        },
        {
          name: '区域5',
          value: 0
        },
        {
          name: '区域6',
          value: 8
        }
      ]
效果:
柱状图4
组件:
<template>
  <div style="width: 100%; height: 100%" class="flex flex-col justify-between">
    <div v-for="(item, index) of dataList" :key="index">
      <template v-if="item.title">
        <div class="progress_title mb-2">{{ item.title }}</div>
        <div class="progress_box flex">
          <div class="progress_bar">
            <div
              class="progress_innerBar"
              :style="{
                width:
                  (item.isProportion
                    ? item.value
                    : (item.value / total) * 100) + '%'
              }"
            ></div>
          </div>
          <div class="progress_value">
            {{ item.value }} <span v-if="item.isProportion">%</span>
          </div>
        </div>
      </template>
    </div>
  </div>
</template>

<script>
export default {
  props: {
    dataList: {
      type: Array,
      default: function () {
        return []
      }
    }
  },
  data() {
    return {
      total: 0
    }
  },
  mounted() {
    this.dataList.forEach((item) => {
      this.total += Number(item.value)
    })
  }
}
</script>

<style lang="scss">
.progress_title {
  font-size: 14px;
  font-weight: 500;
  color: #ffffff;
}

.progress_box {
  .progress_bar {
    width: calc(100% - 40px);
    height: 14px;
    background: rgba(0, 212, 224, 0);
    border: 1px solid rgba(0, 0, 0, 0.5);
    margin-right: 15px;
    box-shadow: 0 0 5px #fff inset;

    .progress_innerBar {
      height: 12px;
      background: url(/assets/images/common/pro_inner.png);
    }
  }

  .progress_value {
    width: 40px;
    flex-shrink: 0;
    height: 11px;
    font-size: 14px;
    font-weight: bold;
    color: #19d0f0;
    line-height: 10px;
  }
}
</style>
调用:
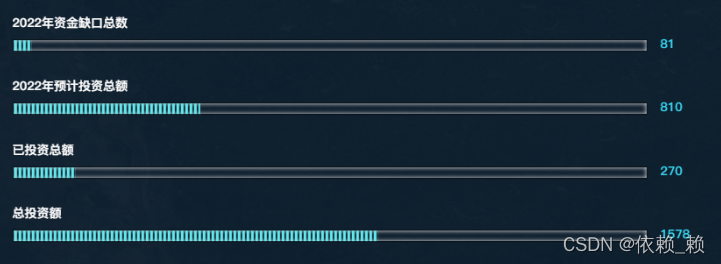
<HtProcess :dataList="data" />
数据:
data = [
        {
          title: '2022年资金缺口总数',
          value: 81
        },
        {
          title: '2022年预计投资总额',
          value: 810
        },
        {
          title: '已投资总额',
          value: 270
        },
        {
          title: '总投资额',
          value: 1578
        }
      ]
pro_inner.png

效果:
柱状图+折线图
组件:
<template>
  <div style="width: 100%; height: 100%" class="relative">
    <e-charts :option="options" ref="echarts" />
  </div>
</template>

<script>
import ECharts from '@/components/echarts/ECharts.vue'

export default {
  components: {
    ECharts
  },
  props: {
    chartData: {
      type: Object,
      // 对象或数组默认值必须从一个工厂函数获取
      default: function () {
        return {
          unit: '单位: 万元',
          xData: ['01月', '02月'],
          barLegend: ['第一产业', '第二产业', '第三产业'],
          barData: [
            {
              value1: 2.0,
              value2: 2.6,
              value3: 2.6
            },
            {
              value1: 4.9,
              value2: 5.9,
              value3: 2.6
            }
          ],
          lineLegend: ['生产总值'],
          lineData: [
            {
              value1: 4.9
            }
          ]
        }
      }
    },
    barColorList: {
      type: Array,
      default: function () {
        return ['#177BE1', '#05EDEA', '#0DE58C', '#F8B551']
      }
    },
    lineColorList: {
      type: Array,
      default: function () {
        return ['#F8B551', '#177BE1']
      }
    },
    barWidth: {
      default: 10
    }
  },
  data() {
    return {
      options: {}
    }
  },
  watch: {
    chartData: {
      handler() {
        this.initCharts()
      },
      deep: true
    }
  },
  methods: {
    async initCharts() {
      // const instance = await this.$refs.echarts.wait()
      const _this = this
      const colorList = _this.barColorList
      _this.options = {
        color: colorList,
        grid: {
          left: '60px',
          right: '20px',
          bottom: '50px'
        },
        tooltip: {
          trigger: 'axis',
          backgroundColor: '#000',
          borderWidth: 0,
          padding: [3, 5],
          textStyle: {
            color: '#fff'
          }
        },
        legend: {
          data: [..._this.chartData.barLegend, ..._this.chartData.lineLegend], // 动态处理
          textStyle: {
            color: '#fff'
          }
        },
        xAxis: [
          {
            type: 'category',
            data: _this.chartData.xData,
            axisTick: {
              show: false
            },
            axisLabel: {
              color: '#fff',
              fontSize: 14
            }
          }
        ],
        yAxis: [
          {
            type: 'value',
            name: '单位: ' + _this.chartData.unit, // 动态处理
            nameTextStyle: {
              color: '#fff',
              fontSize: 14
            },
            axisLabel: {
              color: '#fff',
              fontSize: 16
            },
            splitLine: {
              lineStyle: {
                color: 'rgba(255, 255, 255, 0.05)'
              }
            }
          }
        ],
        series: [
          ..._this.chartData.barLegend.map((item, index) => {
            return {
              name: item, // 动态处理
              type: 'bar',
              barWidth: _this.barWidth,
              data: _this.barValueArr('value' + (index + 1)) // 动态处理
            }
          }),
          ..._this.chartData.lineLegend.map((item, index) => {
            return {
              name: item, // 动态处理
              type: 'line',
              smooth: true,
              showSymbol: false,
              itemStyle: {
                color: _this.lineColorList[index]
              },
              data: _this.lineValueArr('value' + (index + 1)) // 动态处理
            }
          })
        ]
      }
    },
    barValueArr(value) {
      return this.chartData.barData.map((item) => Number(item[value]))
    },
    lineValueArr(value) {
      return this.chartData.lineData.map((item) => Number(item[value]))
    }
  },
  mounted() {
    this.initCharts()
  }
}
</script>

<style></style>
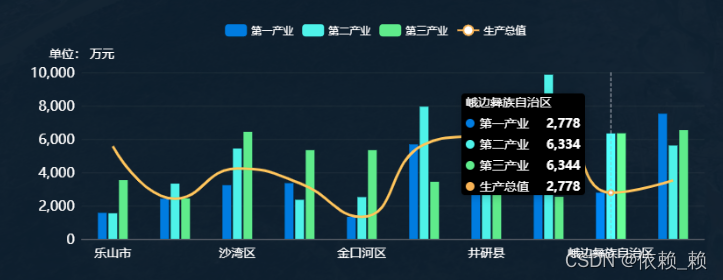
调用:
<EchartsBarLine :chartData="data" />
数据:
data = {
        unit: '万元',
        barLegend: ['第一产业', '第二产业', '第三产业'],
        lineLegend: ['生产总值'],
        xData: [
          '乐山市',
          '市中区',
          '沙湾区',
          '五通桥区',
          '金口河区',
          '键为县',
          '井研县',
          '夹江县',
          '峨边彝族自治区',
          '马边彝族自治区'
        ],
        barData: [
          {
            value1: 1570,
            value2: 1545,
            value3: 3534
          },
          {
            value1: 2420,
            value2: 3324,
            value3: 2434
          },
          {
            value1: 3230,
            value2: 5432,
            value3: 6434
          },
          {
            value1: 3352,
            value2: 2353,
            value3: 5334
          },
          {
            value1: 1329,
            value2: 2515,
            value3: 5334
          },
          {
            value1: 5678,
            value2: 7943,
            value3: 3434
          },
          {
            value1: 6368,
            value2: 3423,
            value3: 5434
          },
          {
            value1: 6616,
            value2: 9865,
            value3: 2534
          },
          {
            value1: 2778,
            value2: 6334,
            value3: 6344
          },
          {
            value1: 7519,
            value2: 5615,
            value3: 6534
          }
        ],
        lineData: [
          {
            value1: 5570
          },
          {
            value1: 2420
          },
          {
            value1: 4230
          },
          {
            value1: 3352
          },
          {
            value1: 1329
          },
          {
            value1: 5678
          },
          {
            value1: 6368
          },
          {
            value1: 7616
          },
          {
            value1: 2778
          },
          {
            value1: 3519
          }
        ]
      }
效果:

折线图1
组件:
<template>
  <div class="echarts-line" :id="ids"></div>
</template>

<script>
import * as echarts from 'echarts'

export default {
  props: {
    legendChecked: {
      // 图例
      default: true
    },
    ids: {
      // id
      type: String,
      default: 'echartsline'
    },
    fontColor: {
      // 字体颜色
      type: String,
      default: '#89949F'
    },
    yLine: {
      // x轴分割线
      default: false
    },
    chartData: {
      // echarts·数据
      default: function () {
        return []
      }
    },
    // Y轴单位
    Yunit: {
      type: Boolean,
      default: true
    },
    theme: {
      default: function () {
        return ['#3da4fe', '#23cef2', '#65b664', '#00FDCB']
      }
    }
  },
  watch: {
    chartData: {
      // 深度监听,可监听到对象、数组的变化
      handler() {
        this.$nextTick(() => {
          if (this.chartData && this.chartData.length > 0) {
            this.dataValue(this.chartData)
          }
        })
      },
      deep: true, // 深度监听,可监听到对象、数组的变化
      immediate: true // 立刻执行
    }
  },
  data() {
    return {}
  },
  mounted() {},
  methods: {
    dataValue(newVal) {
      if (newVal && newVal.length > 0) {
        const seriesConfig = []
        const Yconfig = []
        const unit = []
        for (let i = 0; i < newVal.length; i++) {
          if (newVal[i].areaStyle) {
            const obj = {
              type: 'line',
              name: newVal[i].name,
              data: newVal[i].yData,
              smooth: newVal[i].smooth ? newVal[i].smooth : false,
              showSymbol: newVal[i].showSymbol ? newVal[i].showSymbol : false,
              lineStyle: {
                color: newVal[i].lineColor
              },
              areaStyle: {
                color: new echarts.graphic.LinearGradient(0, 0, 0, 1, [
                  {
                    offset: 0,
                    color: newVal[i].areaColor
                  },
                  {
                    offset: 1,
                    color: 'rgba(0,0,0,0)'
                  }
                ])
              }
            }
            if (i === 1) {
              obj.yAxisIndex = 1
            }
            seriesConfig.push(obj)
            if (this.Yunit) {
              Yconfig.push({
                type: 'value',
                name:
                  (newVal.length > 1 ? newVal[i].name : '单位') +
                  ':' +
                  newVal[i].unit,
                nameTextStyle: {
                  fontSize: 12,
                  color: this.fontColor
                },
                splitNumber: 5,
                axisTick: {
                  show: false
                },
                splitLine: {
                  show: this.yLine,
                  lineStyle: {
                    color: 'rgba(153, 153, 153, 0.3)'
                  }
                },
                axisLine: {
                  show: false
                },
                axisLabel: {
                  color: this.fontColor,
                  fontSize: 12
                }
              })
            } else {
              Yconfig.push({
                type: 'value',
                nameTextStyle: {
                  fontSize: 12,
                  color: this.fontColor
                },
                splitNumber: 5,
                axisTick: {
                  show: false
                },
                splitLine: {
                  show: this.yLine,
                  lineStyle: {
                    color: 'rgba(153, 153, 153, 0.3)'
                  }
                },
                axisLine: {
                  show: false
                },
                axisLabel: {
                  color: this.fontColor,
                  fontSize: 12
                }
              })
              Yconfig[0].name = '(m³/s)'
            }

            unit.push(newVal[i].unit)
          } else {
            seriesConfig.push({
              type: 'line',
              name: newVal[i].name,
              data: newVal[i].yData,
              smooth: newVal[i].smooth ? newVal[i].smooth : false,
              symbolSize: newVal[i].showSymbol ? newVal[i].showSymbol : false,
              lineStyle: {
                color: newVal[i].lineColor
              }
            })
            Yconfig.push({
              type: 'value',
              name: newVal[i].name + ':' + newVal[i].unit,
              nameTextStyle: {
                fontSize: 12,
                color: this.fontColor
              },
              splitNumber: 5,
              axisTick: {
                show: false
              },
              splitLine: {
                show: this.yLine,
                lineStyle: {
                  color: '#e5e5e5'
                }
              },
              axisLine: {
                show: false
              },
              axisLabel: {
                color: this.fontColor,
                fontSize: 12
              }
            })
            unit.push(newVal[i].unit)
          }
        }
        this.setEcharts(seriesConfig, Yconfig, newVal[0].xData, unit)
      }
    },
    setEcharts(series, Yconfig, dataAxis, unit) {
      let legend = []
      if (this.legendChecked) {
        legend = this.chartData.map((data, i) => {
          return {
            name: data.name,
            icon: 'roundRect',
            itemStyle: series[i].lineStyle
          }
        })
      } else {
        legend = []
      }
      const myChart = echarts.init(document.getElementById(this.ids))
      const option = {
        color: this.theme,
        tooltip: {
          trigger: 'axis',
          formatter: function (data) {
            if (!data.length) return
            if (data.length > 1) {
              let html = ''
              html = `<div class="toolTips"><div style="font-size: 12px;color: #fff">${data[0].axisValue}</div>`
              for (let i = 0; i < data.length; i++) {
                html += `<div style="font-size: 12px;color: #fff">${series[i].name}: ${data[i].value} ${unit[i]}</div>`
              }
              html += '</div>'
              return html
            } else {
              return `<div class="toolTips"><div style="font-size: 12px;color: #fff">${data[0].axisValue}: ${data[0].value} ${unit[0]}</div></div>`
            }
          },
          backgroundColor: '#487892',
          borderWidth: 0,
          padding: [3, 5],
          axisPointer: {
            lineStyle: {
              color: '#299acb'
            }
          }
        },
        legend: {
          top: 0,
          right: 'center',
          width: 240,
          data: legend,
          itemWidth: 15,
          itemHeight: 5,
          show: true,
          selectedMode: false,
          textStyle: {
            color: this.fontColor
          }
        },
        xAxis: {
          type: 'category',
          data: dataAxis,
          boundaryGap: false,
          axisTick: {
            show: true,
            inside: true
          },
          splitLine: {
            show: false
          },
          axisLine: {
            lineStyle: {
              color: 'rgba(135,142,148,0.5)'
            }
          },
          axisLabel: {
            color: this.fontColor,
            fontSize: 12
          }
        },
        yAxis: Yconfig,
        grid: {
          left: 20,
          right: 35,
          top: this.legendChecked ? 30 : 30,
          bottom: 0,
          containLabel: true
        },
        series: series
      }
      myChart.clear()
      myChart.setOption(option, true)
    }
  }
}
</script>

<style scoped lang="scss">
.echarts-line {
  width: 100%;
  height: 100%;
}
</style>
调用:
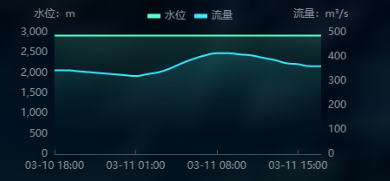
<EchartsLine
              v-if="data"
              style="height: 190px"
              class="mt-4"
              ids="waterflow"
              :legendChecked="true"
              :chartData="data"
            ></EchartsLine>
数据:
{
    "title":"ML",
    "data":[
        {
            "lineColor":"#00FDCB",
            "areaStyle":true,
            "smooth":true,
            "areaColor":"rgba(0,253,203,0.2)",
            "xData":[
                "03-10 18:00",
                "03-10 19:00",
                "03-10 20:00",
                "03-10 21:00",
                "03-10 22:00",
                "03-10 23:00",
                "03-11 00:00",
                "03-11 01:00",
                "03-11 02:00",
                "03-11 03:00",
                "03-11 04:00",
                "03-11 05:00",
                "03-11 06:00",
                "03-11 07:00",
                "03-11 08:00",
                "03-11 09:00",
                "03-11 10:00",
                "03-11 11:00",
                "03-11 12:00",
                "03-11 13:00",
                "03-11 14:00",
                "03-11 15:00",
                "03-11 16:00",
                "03-11 17:00"
            ],
            "yData":[
                "2925.51",
                "2925.51",
                "2925.50",
                "2925.49",
                "2925.48",
                "2925.47",
                "2925.46",
                "2925.45",
                "2925.47",
                "2925.49",
                "2925.53",
                "2925.58",
                "2925.62",
                "2925.65",
                "2925.67",
                "2925.67",
                "2925.66",
                "2925.65",
                "2925.63",
                "2925.61",
                "2925.58",
                "2925.57",
                "2925.55",
                "2925.55"
            ],
            "name":"水位",
            "unit":"m"
        },
        {
            "lineColor":"#00E5FF",
            "areaStyle":true,
            "smooth":true,
            "areaColor":"rgba(0,229,255,0.2)",
            "xData":[
                "03-10 18:00",
                "03-10 19:00",
                "03-10 20:00",
                "03-10 21:00",
                "03-10 22:00",
                "03-10 23:00",
                "03-11 00:00",
                "03-11 01:00",
                "03-11 02:00",
                "03-11 03:00",
                "03-11 04:00",
                "03-11 05:00",
                "03-11 06:00",
                "03-11 07:00",
                "03-11 08:00",
                "03-11 09:00",
                "03-11 10:00",
                "03-11 11:00",
                "03-11 12:00",
                "03-11 13:00",
                "03-11 14:00",
                "03-11 15:00",
                "03-11 16:00",
                "03-11 17:00"
            ],
            "yData":[
                345,
                345,
                341,
                337,
                333,
                329,
                325,
                321,
                329,
                337,
                353,
                374,
                392,
                406,
                415,
                415,
                410,
                406,
                396,
                387,
                374,
                370,
                362,
                362
            ],
            "name":"流量",
            "unit":"m³/s"
        }
    ]
}
效果:
饼状图1
组件:
<template>
  <div :id="ids" class="echarts-pie"></div>
</template>
<script>
import * as echarts from 'echarts'

export default {
  props: {
    chartData: {
      type: Number,
      default: 0
    },
    ids: {
      // id
      type: String,
      default: 'echartspie'
    },
    fontColor: {
      // 字体颜色
      type: String,
      default: '#fff'
    },
    theme: {
      // 主题色
      type: String,
      default: '89949F'
    },
    unit: {
      // 单位
      default: function () {
        return '个'
      }
    }
  },
  data() {
    return {
      mychart: null
    }
  },
  mounted() {
    this.mychart = echarts.init(document.getElementById(this.ids))
  },
  watch: {
    chartData: {
      handler() {
        this.$nextTick(() => {
          this.drawChart()
        })
      },
      deep: true, // 深度监听,可监听到对象、数组的变化
      immediate: true // 立刻执行
    }
  },
  methods: {
    drawChart() {
      // 绘制图表
      const _this = this
      const option = {
        backgroundColor: 'rgba(255, 255, 255, 0)',
        title: {
          show: false
        },
        series: [
          {
            type: 'liquidFill',
            radius: '80%',
            center: ['50%', '50%'],
            data: [0.3, 0.3], // data个数代表波浪数
            backgroundStyle: {
              color: 'rgb(255,255,255,0.2)'
            },
            // 修改波浪颜色
            color: [_this.theme, 'rgb(255,255,255,0.2)'],
            label: {
              normal: {
                formatter: `${this.chartData} (${this.unit})`,
                textStyle: {
                  fontSize: 14,
                  color: this.fontColor
                }
              }
            },
            outline: {
              show: false
            }
          },
          {
            type: 'pie',
            center: ['50%', '50%'],
            radius: ['90%', '93%'],
            hoverAnimation: false,
            data: [
              {
                name: '',
                value: 300,
                labelLine: {
                  show: false
                },
                itemStyle: {
                  color: _this.theme
                }
              },
              {
                // 画中间的图标
                name: '',
                value: 3,
                labelLine: {
                  show: false
                },
                itemStyle: {
                  normal: {
                    borderColor: _this.theme,
                    borderWidth: 3
                  }
                }
              },
              {
                // 画剩余的刻度圆环
                name: '',
                value: 97,
                itemStyle: {
                  color: 'rgba(255, 255, 255, 0.3)'
                },
                label: {
                  show: false
                },
                labelLine: {
                  show: false
                }
              }
            ]
          }
        ]
      }
      this.mychart.clear()
      this.mychart.setOption(option, true)
    }
  }
}
</script>
<style scoped lang="scss">
.echarts-pie {
  width: 100%;
  height: 100%;
}
</style>
调用:
<EchartsPie
                    chartData="42"
                    ids="realtime1"
                    theme="#FF8A00"
                    style="height: 100px"
                  >
                  </EchartsPie>
效果:

饼状图2
组件:
// 有线条支出名字的饼图
<template>
  <div class="chart-pie">
    <div :id="ids" class="echarts-content"></div>
  </div>
</template>

<script>
export default {
  components: {},
  props: {
    ids: {
      default: "echartsPieCircle"
    },
    data: {
      default: function() {
        return []; // [{name: "18岁以下",num: 0},{name: "18岁以下",num: 0}]  数据格式
      }
    },
    title: {
      default: ""
    },
    unit: {
      default: "人"
    },
    split: {
      default: 2
    },
    isShowLegend: {
      default: true
    },
    colorList: {
      default: [
        "#28d1dc",
        "#33dfb5",
        "#487892",
        "#8cc0fc",
        "#7c9d70",
        "#3b7e48"
      ]
    },
    isShowLegendName: {
      default: true
    }
  },
  data() {
    return {
      total: 0,
      lengedNumber: []
    };
  },
  mounted() {
    this.initPie();
  },
  watch: {
    data: {
      //深度监听,可监听到对象、数组的变化
      handler() {
        this.$nextTick(() => {
          if (this.data.length) {
            this.initPie();
          }
        });
      },
      deep: true
    }
  },
  methods: {
    initPie() {
      var datas = this.data;
      this.total = 0;
      var lenged = [];
      var data = [];
      if (datas && datas.length > 0) {
        datas.forEach(item => {
          this.total += item.num;
          lenged.push(item.name);
        });
      }
      for (var i = 0; i < datas.length; i++) {
        data.push({
          value: datas[i].num,
          name: datas[i].name,
          unit: datas[i].unit || "",
          itemStyle: {
            normal: {
              borderWidth: 1,
              borderColor: this.colorList[i]
            }
          }
        });
        if (datas.length > 1) {
          data.push({
            value: this.total / 100,
            tooltip: {
              show: false
            },
            name: "",
            itemStyle: {
              normal: {
                label: {
                  show: false
                },
                labelLine: {
                  lineStyle: {
                    color: "rgba(255, 255, 255, 0.3)"
                  },
                  smooth: 0.2,
                  length: 30,
                  length2: 20
                },
                color: "rgba(0, 0, 0, 0)",
                borderColor: "rgba(0, 0, 0, 0)",
                borderWidth: 0
              }
            }
          });
        }
      }
      var seriesOption = [
        {
          name: "",
          type: "pie",
          clockWise: false,
          radius: [
            (document.getElementById(this.ids).clientHeight * 3) / 8 - 4,
            (document.getElementById(this.ids).clientHeight * 3) / 8 + 6
          ],
          hoverAnimation: false,
          itemStyle: {
            normal: {
              label: {
                show: true,
                // align: 'center',
                // padding: [-30, -1],
                // height: 30,
                // rotate: -90,
                // verticalAlign: 'middle',
                lineHeight: 60
                // formatter (v) {
                //   let text = Math.round(v.percent) + '%' + '' + v.name
                //   if (text.length <= 8) {
                //     return text;
                //   } else if (text.length > 8 && text.length <= 16) {
                //     return text = `${text.slice(0, 8)}\n${text.slice(8)}`
                //   } else if (text.length > 16 && text.length <= 24) {
                //     return text = `${text.slice(0, 8)}\n${text.slice(8, 16)}\n${text.slice(16)}`
                //   } else if (text.length > 24 && text.length <= 30) {
                //     return text = `${text.slice(0, 8)}\n${text.slice(8, 16)}\n${text.slice(16, 24)}\n${text.slice(24)}`
                //   } else if (text.length > 30) {
                //     return text = `${text.slice(0, 8)}\n${text.slice(8, 16)}\n${text.slice(16, 24)}\n${text.slice(24, 30)}\n${text.slice(30)}`
                //   }
                // },
              },
              labelLine: {
                length: 20,
                length2: 10,
                show: true
              }
            }
          },
          data: data
        }
      ];
      var option = {
        color: this.colorList,
        title: {
          show: false
        },
        graphic: {
          elements: [
            {
              type: "image",
              z: 3,
              style: {
                width:
                  (document.getElementById(this.ids).clientHeight * 3) / 3 - 14,
                height:
                  (document.getElementById(this.ids).clientHeight * 3) / 3 - 14,
                image: "/img/echarts/circle.png"
              },
              left: "center",
              top: "center",
              position: [100, 100]
            },
            {
              type: "text",
              top: (document.getElementById(this.ids).clientHeight * 3) / 9,
              left: "center",
              style: {
                text: this.total,
                textAlign: "center",
                fill: "#fff",
                font: '24px "trends"'
              }
            },
            {
              type: "group",
              top: document.getElementById(this.ids).clientHeight / 1.8,
              left: "center",
              style: {
                textAlign: "center"
              },
              children: [
                {
                  type: "text",
                  left: -10,
                  style: {
                    text: this.title,
                    fill: "#fff",
                    font: '16px "trends"'
                  }
                }
              ]
            }
          ]
        },
        tooltip: {
          confine: true,
          formatter: "{b}: {c}"
        },
        legend: {
          show: false
        },
        toolbox: {
          show: false
        },
        series: seriesOption
      };
      let myChart = this.$echarts.init(document.getElementById(this.ids));
      myChart.setOption(option);
      //计算百分比
      this.lengedNumber = this.data.map(item =>
        ((item.num / this.total) * 100).toFixed(2)
      );
      let count = 0;
      for (let i = 0; i < this.lengedNumber.length - 1; i++) {
        count += Number(this.lengedNumber[i]) * 100;
      }
      this.lengedNumber[this.lengedNumber.length - 1] =
        (10000 - Number(count)) / 100;
    }
  }
};
</script>
<style scoped lang="less">
.chart-pie {
  width: 100%;
  height: 100%;
  position: relative;
  display: flex;
  align-items: center;
  margin-top: 10px;
  box-sizing: border-box;

  .echarts-content {
    width: 100%;
    height: 100%;
    position: absolute;
    left: 0;
  }
}
</style>
调用:
<EchartsPieHasLine
              :isShowLegendName="false"
              :data="data"
              :title="'总数'"
              :unit="'家'"
              :colorList="
                data.map(colorItem => {
                  return colorItem.color;
                })
              "
            ></EchartsPieHasLine>
数据:
data = [
        {
          name: "高等院校用地",
          num: 0.28,
          color: "#cd78c1"
        },
        {
          name: "商业设施用地",
          num: 0.02,
          color: "#ce1610"
        },
        {
          name: "中小学用地",
          num: 0.03,
          color: "#b77be0"
        },
        {
          name: "农业用地",
          num: 0.09,
          color: "#a0c4b9"
        },
        {
          name: "公园绿地",
          num: 0.01,
          color: "#91a3b4"
        },
        {
          name: "工业用地",
          num: 0.07,
          color: "#b8c658"
        },
        {
          name: "二类居住用地",
          num: 0.02,
          color: "#abbc86"
        },

        {
          name: "公用设施用地",
          num: 0.05,
          color: "#139ac8"
        },
        {
          name: "服务设施用地",
          num: 0.01,
          color: "#c5aeae"
        },
        {
          name: "医疗卫生用地",
          num: 0.1,
          color: "#cb8396"
        }
      ]
circle.png

效果:

饼状图3
组件:
<template>
  <div class="chart-pie">
    <div
      :id="ids"
      class="echarts-content"
      :style="{ width: isShowLegend ? '45%' : '100%' }"
    ></div>
    <ul
      class="echarts-legend"
      :style="{ display: isShowLegend ? 'flex' : 'none' }"
    >
      <li v-for="(item, idx) in data" :key="item.name">
        <div
          class="legend-box"
          :style="{ backgroundColor: colorList[idx] }"
        ></div>
        <el-tooltip
          v-if="isShowLegendName"
          class="item"
          effect="dark"
          :content="item.name"
          placement="left-start"
        >
          <div class="legend-name">{{ item.name }}</div>
        </el-tooltip>
        <span class="legend-scale" v-if="!!item.num"
          ><i>{{ item.num }}</i></span
        >
        <span class="legend-scale" v-else
          ><i>{{ item.num }}</i
          >%</span
        >
      </li>
    </ul>
  </div>
</template>

<script>
export default {
  components: {},
  props: {
    ids: {
      default: "echartsPieCircle"
    },
    data: {
      default: function() {
        return []; // [{name: "18岁以下",num: 0},{name: "18岁以下",num: 0}]  数据格式
      }
    },
    title: {
      default: ""
    },
    unit: {
      default: "人"
    },
    split: {
      default: 2
    },
    isShowLegend: {
      default: true
    },
    colorList: {
      default: function() {
        return [
          "#28d1dc",
          "#33dfb5",
          "#487892",
          "#8cc0fc",
          "#7c9d70",
          "#3b7e48"
        ];
      }
    },
    isShowLegendName: {
      default: true
    }
  },
  data() {
    return {
      total: 0,
      lengedNumber: []
    };
  },
  mounted() {
    this.initPie();
  },
  watch: {
    data: {
      //深度监听,可监听到对象、数组的变化
      handler() {
        this.$nextTick(() => {
          if (this.data.length) {
            this.initPie();
          }
        });
      },
      deep: true
    }
  },
  methods: {
    initPie() {
      var datas = this.data;
      this.total = 0;
      var lenged = [];
      var data = [];
      if (datas && datas.length > 0) {
        datas.forEach(item => {
          this.total += item.num;
          lenged.push(item.name);
        });
      }
      for (var i = 0; i < datas.length; i++) {
        data.push({
          value: datas[i].num,
          name: datas[i].name,
          unit: datas[i].unit || "",
          itemStyle: {
            normal: {
              borderWidth: 1,
              borderColor: this.colorList[i]
            }
          }
        });
        if (datas.length > 1) {
          data.push({
            value: this.total / 100,
            tooltip: {
              show: false
            },
            name: "",
            itemStyle: {
              normal: {
                label: {
                  show: false
                },
                labelLine: {
                  show: false
                },
                color: "rgba(0, 0, 0, 0)",
                borderColor: "rgba(0, 0, 0, 0)",
                borderWidth: 0
              }
            }
          });
        }
      }
      var seriesOption = [
        {
          name: "",
          type: "pie",
          clockWise: false,
          radius: [
            (document.getElementById(this.ids).clientHeight * 3) / 8 - 4,
            (document.getElementById(this.ids).clientHeight * 3) / 8 + 6
          ],
          hoverAnimation: false,
          itemStyle: {
            normal: {
              label: {
                show: false
              },
              labelLine: {
                length: 30,
                length2: 100,
                show: false
              }
            }
          },
          data: data
        }
      ];
      var option = {
        color: this.colorList,
        title: {
          show: false
        },
        graphic: {
          elements: [
            {
              type: "image",
              z: 3,
              style: {
                width:
                  (document.getElementById(this.ids).clientHeight * 3) / 3 - 14,
                height:
                  (document.getElementById(this.ids).clientHeight * 3) / 3 - 14,
                image: "/img/echarts/circle.png"
              },
              left: "center",
              top: "center",
              position: [100, 100]
            },
            {
              type: "text",
              top: (document.getElementById(this.ids).clientHeight * 3) / 9,
              left: "center",
              style: {
                text: this.total,
                textAlign: "center",
                fill: "#fff",
                font: '24px "trends"'
              }
            },
            {
              type: "group",
              top: document.getElementById(this.ids).clientHeight / 1.8,
              left: "center",
              style: {
                textAlign: "center"
              },
              children: [
                {
                  type: "text",
                  left: -10,
                  style: {
                    text: this.title,
                    fill: "#fff",
                    font: '16px "trends"'
                  }
                }
              ]
            }
          ]
        },
        tooltip: {
          confine: true,
          formatter: "{b}: {c}"
        },
        legend: {
          show: false
        },
        toolbox: {
          show: false
        },
        series: seriesOption
      };
      let myChart = this.$echarts.init(document.getElementById(this.ids));
      myChart.setOption(option);
      //计算百分比
      this.lengedNumber = this.data.map(item =>
        ((item.num / this.total) * 100).toFixed(2)
      );
      let count = 0;
      for (let i = 0; i < this.lengedNumber.length - 1; i++) {
        count += Number(this.lengedNumber[i]) * 100;
      }
      this.lengedNumber[this.lengedNumber.length - 1] =
        (10000 - Number(count)) / 100;
    }
  }
};
</script>
<style scoped lang="less">
.chart-pie {
  width: 100%;
  height: 100%;
  position: relative;
  display: flex;
  align-items: center;
  margin-top: 10px;
  box-sizing: border-box;

  .echarts-content {
    width: 45%;
    height: 100%;
    position: absolute;
    left: 0;
  }

  .echarts-legend {
    position: absolute;
    left: 47%;
    width: 55%;
    height: 100%;
    display: flex;
    flex-direction: column;
    box-sizing: border-box;
    justify-content: space-around;

    li {
      width: 100%;
      display: flex;
      line-height: 20px;
      height: 20px;
      background: url("/img/echarts/legend-box.png") no-repeat;
      background-size: 100% 100%;
      padding: 0 5px;

      .legend-box {
        width: 3px;
        height: 22px;
        margin-top: -1px;
      }

      .legend-name {
        color: #89949f;
        font-size: 14px;
        margin: 0 15px 0 8px;
        // width: 82px;
        // overflow: hidden;
        // white-space: nowrap;
        // text-overflow: ellipsis;
      }

      .legend-scale {
        right: 10px;
        position: absolute;
        color: #89949f;

        i {
          display: inline-block;
          width: 70px;
          color: #fff;
          font-style: normal;
          font-family: 时尚中黑简体;
          text-align: right;
          font-size: 18px;
          margin-right: 10px;
        }
      }
    }
  }
}
</style>
调用:
<EchartsPie
            :data="data"
            :title="'项目总数'"
            :unit="'亿元'"
          ></EchartsPie>
数据:
data = [
        {
          name: "已签约",
          num: 6
        },
        {
          name: "洽谈中",
          num: 5
        },
        {
          name: "签约目标",
          num: 8
        }
      ]
效果:

饼状图4
组件:
<template>
  <div style="width: 100%; height: 100%" class="relative">
    <e-charts :option="options" ref="echarts" />
  </div>
</template>

<script>
import ECharts from '@/components/echarts/ECharts.vue'
export default {
  components: {
    ECharts
  },
  props: {
    data: {
      type: Array,
      // 对象或数组默认值必须从一个工厂函数获取
      default: function () {
        return [
          { name: '克莱因壶', value: 3.5 },
          { name: '投资最重要的事', value: 2.8 }
        ]
      }
    },
    colorList: {
      type: Array,
      default: function () {
        return [
          '#2dea9c',
          '#00ffff',
          '#eec700',
          '#b9b9b9',
          '#009ff1',
          '#ff0000'
        ]
      }
    }
  },
  watch: {
    data(newVal) {
      this.initCharts()
    }
  },
  data() {
    return {
      options: {}
    }
  },
  methods: {
    async initCharts() {
      // const instance = await this.$refs.echarts.wait()
      const _this = this
      const colorList = _this.colorList
      const giftImageUrl = '/assets/images/echarts/bg.png'
      _this.options = {
        color: colorList,
        title: {
          text: '',
          left: 'center',
          textStyle: {
            color: '#fff',
            fontSize: 16
          }
        },
        graphic: {
          elements: [
            {
              type: 'group',
              left: 'center',
              top: 'center',
              children: [
                {
                  type: 'image',
                  style: {
                    image: giftImageUrl,
                    width: 180,
                    height: 180
                  },
                  left: 'center',
                  top: 'center'
                }
              ]
            }
          ]
        },
        series: {
          type: 'pie',
          radius: [40, 60],
          left: 'center',
          width: 320,
          // itemStyle: {
          //   borderColor: '#fff',
          //   borderWidth: 1
          // },
          label: {
            alignTo: 'edge',
            formatter: '{name|{b}}\n{time|{c} }',
            minMargin: 5,
            edgeDistance: 10,
            lineHeight: 15,
            color: '#fff',
            rich: {
              time: {
                fontSize: 16,
                color: '#fff'
              }
            }
          },
          labelLine: {
            length: 15,
            length2: 0,
            maxSurfaceAngle: 80
          },
          data: _this.data
        }
      }
    }
  },
  mounted() {
    this.initCharts()
  }
}
</script>

<style></style>
调用:
<EchartsPie :data="data" />
数据:
data = [
        {
          name: '居住用地',
          value: 3.5
        },
        {
          name: '其他土地',
          value: 2.8
        },
        {
          name: '交通运输用地',
          value: 1.7
        },
        {
          name: '林地',
          value: 1.4
        },
        {
          name: '草地',
          value: 0.5
        },
        {
          name: '公共服务用地',
          value: 3.8
        }
      ]
bg.png

效果:
饼状图5
组件:
<template>
  <div style="width: 100%; height: 100%" class="relative">
    <e-charts :option="options" ref="echarts" />
  </div>
</template>
<script>
import ECharts from '@/components/echarts/ECharts.vue'

export default {
  components: {
    ECharts
  },
  props: {
    showLegend: {
      default: true
    },
    colorList: {
      default: function () {
        return ['#1ccfb8', '#007fd3', '#5e8bac', '#016f85', '#34c0e0']
      }
    },
    data: {
      default: function () {
        return [
          {
            value: 5,
            name: '智慧城市'
          },
          {
            value: 31,
            name: '自然资源'
          },
          {
            value: 9,
            name: '智慧电力'
          },
          {
            value: 35,
            name: '智慧交通'
          },
          {
            value: 20,
            name: '智慧应急'
          }
        ]
      }
    }
  },
  data() {
    return {
      options: {}
    }
  },
  watch: {
    data() {
      this.initCharts()
    }
  },
  mounted() {
    this.initCharts()
  },
  methods: {
    // 绘制图表
    async initCharts() {
      const colorList = this.colorList
      var giftImageUrl = '/assets/images/echarts/bg.png'
      var option = {
        title: {
          show: false
        },
        tooltip: {
          trigger: 'item',
          backgroundColor: '#000',
          borderWidth: 0,
          padding: [3, 5],
          textStyle: {
            color: '#fff'
          },
          formatter: function (data) {
            if (data.data.unit === '%') {
              return data.name + ':' + data.value + ' ' + data.data.unit || ''
            } else {
              return data.name + ':' + data.percent + '%'
            }
          }
        },
        graphic: {
          elements: [
            {
              type: 'group',
              left: 'center',
              top: 'center',
              children: [
                {
                  type: 'image',
                  style: {
                    image: giftImageUrl,
                    width: 100,
                    height: 100
                  },
                  left: 'ceenter',
                  top: 'center'
                }
              ]
            }
          ]
        },
        legend: {
          orient: 'horizontal',
          type: 'scroll',
          height: 100,
          bottom: 0,
          x: 'center',
          itemHeight: 10,
          itemWidth: 10,
          textStyle: {
            color: '#fff'
          },
          show: this.showLegend
        },
        calculable: true,
        grid: {
          containLabel: true,
          left: 30,
          right: 30
        },
        series: [
          {
            name: '半径模式',
            type: 'pie',
            radius: [20, 74],
            center: ['50%', '50%'],
            roseType: 'area',
            data: this.data,
            startAngle: 90,
            color: colorList,
            labelLine: {
              normal: {
                show: true,
                length: 5,
                length2: 5,
                lineStyle: {
                  width: 1
                }
              }
            },
            label: {
              normal: {
                alignTo: 'edge',
                margin: 0,
                color: '#fff',
                textBorderWidth: 0,
                formatter: (data) => {
                  if (data.data.unit) {
                    return (
                      '{d|' +
                      data.data.name +
                      '\n}{c|' +
                      data.data.value +
                      '}{b|' +
                      data.data.unit +
                      '}' +
                      '\n\n'
                    )
                  } else {
                    return (
                      '{d|' +
                      data.data.name +
                      '\n}{c|' +
                      data.data.value +
                      '}{b|}'
                    )
                  }
                },
                rich: {
                  b: {
                    fontSize: 14,
                    padding: [-27, 4, 5, 5],
                    color: 'rgba(255,255,255,.7)'
                  },
                  d: {
                    fontSize: 16,
                    padding: [-20, 0, 0, 0],
                    lineHeight: 24
                  },
                  c: {
                    fontSize: 18,
                    padding: [-30, 0, 0, 5],
                    lineHeight: 24
                  }
                }
              }
            }
          }
        ]
      }
      this.options = option
    }
  }
}
</script>
<style scoped></style>
调用:
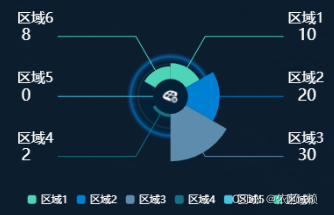
<EchartsRose :data="data" />
数据:
data = [
            {
              name: '区域1',
              value: 10
            },
            {
              name: '区域2',
              value: 20
            },
            {
              name: '区域3',
              value: 30
            },
            {
              name: '区域4',
              value: 2
            },
            {
              name: '区域5',
              value: 0
            },
            {
              name: '区域6',
              value: 8
            }
          ]
效果:
饼状图6
组件:
<!--
 * @Author: your name
 * @Date: 2020-07-02 14:53:13
 * @LastEditTime: 2020-07-15 16:58:51
 * @LastEditors: Please set LastEditors
 * @Description: In User Settings Edit
 * @FilePath: \web\src\components\echartsPieCircle.vue
-->
<template>
  <div style="width: 100%; height: 100%" class="relative">
    <e-charts
      :option="options"
      ref="echarts"
      :id="ids"
      class="echarts-content"
    />
    <div class="echarts-legend">
      <ul>
        <li
          v-for="(item, idx) in data"
          :key="item.name"
          style="position: relative; border: none; display: flex"
        >
          <div
            :style="{ 'background-color': color[idx] }"
            style="
              width: 10px;
              height: 10px;
              position: absolute;
              top: 50%;
              left: -10px;
              transform: translateY(-50%);
            "
          ></div>
          <p >{{ item.name }}</p>
          <div style="margin-left: 10px" :style="{ color: color[idx] }">
            <span>{{
              ((item.value / total) * 100).toFixed(2)
            }}{{ unit }}</span>
          </div>
        </li>
      </ul>
    </div>
  </div>
</template>

<script>
import ECharts from '@/components/echarts/ECharts.vue'
export default {
  components: {
    ECharts
  },
  props: {
    ids: {
      default: 'echartsPieCircle'
    },
    data: {
      default: function () {
        return [
          {
            name: '1',
            value: 17
          },
          {
            name: '2',
            value: 11
          }
        ]
      }
    },
    unit: {
      default: '%'
    },
    split: {
      default: 2
    }
  },
  data() {
    return {
      color: ['#1CE2FF', '#00FFE3', '#26E4A7'],
      total: '',
      options: {}
    }
  },
  computed: {},
  created() {},
  mounted() {
    this.initPie()
  },
  updated() {},
  activated() {},
  watch: {},
  methods: {
    initPie() {
      var datas = this.data

      var data = []
      var color = this.color
      var total = 0
      if (datas && datas.length > 0) {
        datas.forEach((item) => {
          total += item.value
        })
        this.total = total
      }
      for (var i = 0; i < datas.length; i++) {
        data.push({
          value: datas[i].value,
          name: datas[i].name,
          unit: datas[i].unit || '',
          itemStyle: {
            normal: {
              borderWidth: 1,
              borderColor: color[i]
            }
          }
        })
        if (datas.length > 1) {
          data.push({
            value: (total * this.split) / 100,
            tooltip: {
              show: false
            },
            name: '',
            itemStyle: {
              normal: {
                label: {
                  show: false
                },
                labelLine: {
                  show: false
                },
                color: 'rgba(0, 0, 0, 0)',
                borderColor: 'rgba(0, 0, 0, 0)',
                borderWidth: 0
              }
            }
          })
        }
      }
      var seriesOption = [
        {
          name: '',
          type: 'pie',
          clockWise: false,
          radius: [
            (document.getElementById(this.ids).clientHeight * 3) / 9,
            (document.getElementById(this.ids).clientHeight * 3) / 9 + 6
          ],
          hoverAnimation: false,
          itemStyle: {
            normal: {
              label: {
                show: false
              },
              labelLine: {
                length: 30,
                length2: 100,
                show: false
              }
            }
          },
          data: data
        }
      ]
      var option = {
        color: color,
        title: {
          show: false
        },
        graphic: {
          elements: [
            {
              type: 'image',
              z: 3,
              style: {
                width:
                  (document.getElementById(this.ids).clientHeight * 3) / 5 - 14,
                height:
                  (document.getElementById(this.ids).clientHeight * 3) / 5 - 14,
                image: '/assets/images/echarts/circle.png'
              },
              left: 'center',
              top: 'center',
              position: [100, 100]
            },
            {
              type: 'group',
              top: document.getElementById(this.ids).clientHeight / 2 - 16,
              left: 'center',
              style: {
                textAlign: 'center'
              },
              children: [
                {
                  type: 'text',
                  left: -10,
                  style: {
                    text: total,
                    fill: '#fff',
                    fontSize: '36px',
                    fontWeight: 400
                  }
                },
                {
                  type: 'text',
                  top: 8,
                  left: total.toString().length * 6 + 30,
                  style: {
                    text: '个',
                    fill: '#fefefe',
                    font: '16px "Microsoft YaHei"'
                  }
                }
              ]
            }
          ]
        },
        tooltip: {
          confine: true,
          formatter: (params) => {
            return (
              params.data.name +
              ':' +
              params.data.value +
              ' ' +
              params.data.unit
            )
          }
        },
        legend: {
          show: false,
          icon: 'circle',
          orient: 'horizontal',
          // x: 'left',
          data: ['火车'],
          right: 340,
          bottom: 150,
          align: 'right',
          textStyle: {
            color: '#fff'
          },
          itemGap: 20
        },
        toolbox: {
          show: false
        },
        series: seriesOption
      }
      // let myChart = this.$echarts.init(document.getElementById(this.ids));
      // myChart.setOption(option);
      this.options = option
    }
  },
  filters: {}
}
</script>
<style scoped lang="scss">
.echarts-content {
  width: 180px;
  height: 80%;
  max-height: 200px;
  vertical-align: middle;
  display: inline-block;
  position: absolute;
  top: 50%;
  left: 0;
  transform: translate(0, -50%);
}
.echarts-legend {
  display: inline-block;
  vertical-align: middle;
  position: absolute;
  left: 200px;
  top: 50%;
  transform: translate(0, -50%);
  li {
    border-left: 2px solid;
    padding-left: 10px;
    margin-bottom: 15px;
    &:last-of-type {
      margin-bottom: 0;
    }
    p {
      font-size: 16px;
      color: #fff;
    }
    span {
      font-size: 18px;
    }
  }
}
</style>
调用:
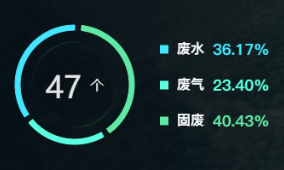
<EchartsPieCircie :data="data" />
数据:
data =  [
        {
          name: '废水',
          value: 17,
          unit: '个'
        },
        {
          name: '废气',
          value: 11,
          unit: '个'
        },
        {
          name: '固废',
          value: 19,
          unit: '个'
        }
      ]
circle.png

效果:


 1903
1903


 被折叠的 条评论
为什么被折叠?
被折叠的 条评论
为什么被折叠?
 到【灌水乐园】发言


