


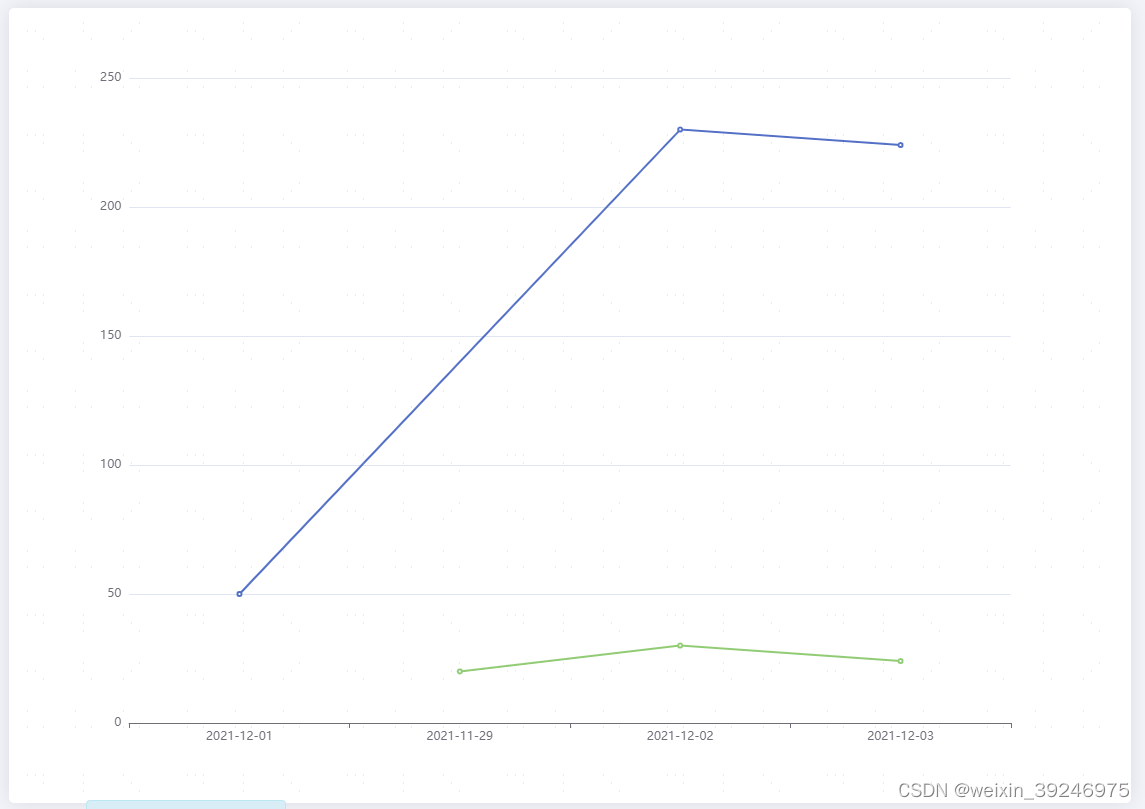
1、先上图
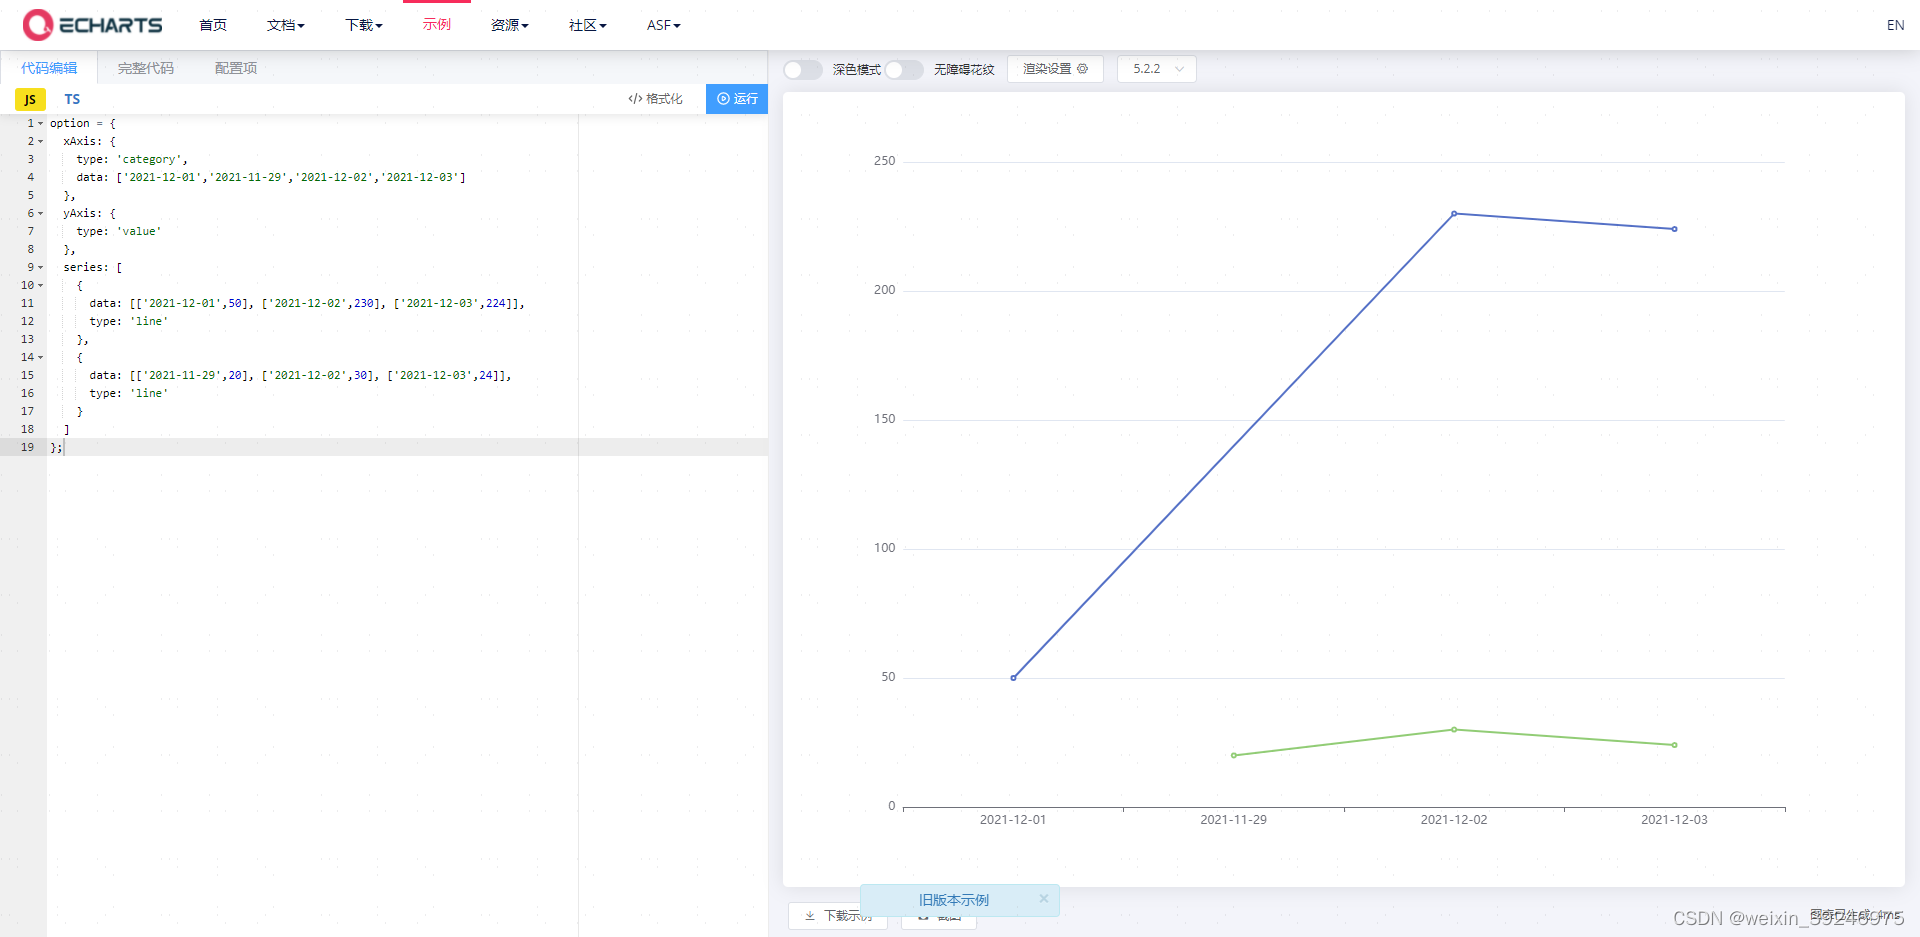
2、echarts 配置
option = {
  xAxis: {
    type: 'category',
    data: ['2021-12-01','2021-11-29','2021-12-02','2021-12-03']
  },
  yAxis: {
    type: 'value'
  },
  series: [
    {
      data: [['2021-12-01',50], ['2021-12-02',230], ['2021-12-03',224]],
      type: 'line'
    },
    {
      data: [['2021-11-29',20], ['2021-12-02',30], ['2021-12-03',24]],
      type: 'line'
    }
  ]
};
最终的效果:


 2868
2868

 被折叠的 条评论
为什么被折叠?
被折叠的 条评论
为什么被折叠?
 到【灌水乐园】发言


