


前言
创作开始时间:2021年10月4日16:33:06
本文旨在探索:
1)图表在论文中的作用;
2)图表制作技巧;
3)图表制作案例及规律总结。
图表的作用
参考:Figures and tables https://www.springer.com/gp/authors-editors/authorandreviewertutorials/writing-a-journal-manuscript/figures-and-tables/10285530
Figures and tables (display items) are often the quickest way to communicate large amounts of complex information that would be complicated to explain in text.
Many readers will only look at your display items without reading the main text of your manuscript. Therefore, ensure your display items can stand alone from the text and communicate clearly your most significant results.
Display items are also important for attracting readers to your work. Well designed and attractive display items will hold the interest of readers, compel them to take time to understand a figure and can even entice them to read your full manuscript.
Finally, high-quality display items give your work a professional appearance. Readers will assume that a professional-looking manuscript contains good quality science. Thus readers may be more likely to trust your results and your interpretation of those results.
简言之,图表的作用可总结如下:
- 表述/展示文章核心内容
- 吸引读者
- 显得文章非常专业。
什么时候需要图表?
When deciding which of your results to present as display items consider the following questions:
- Are there any data that readers might rather see as a display item rather than text?
- Do your figures supplement the text and not just repeat what you have already stated?
- Have you put data into a table that could easily be explained in the text such as simple statistics or p values?
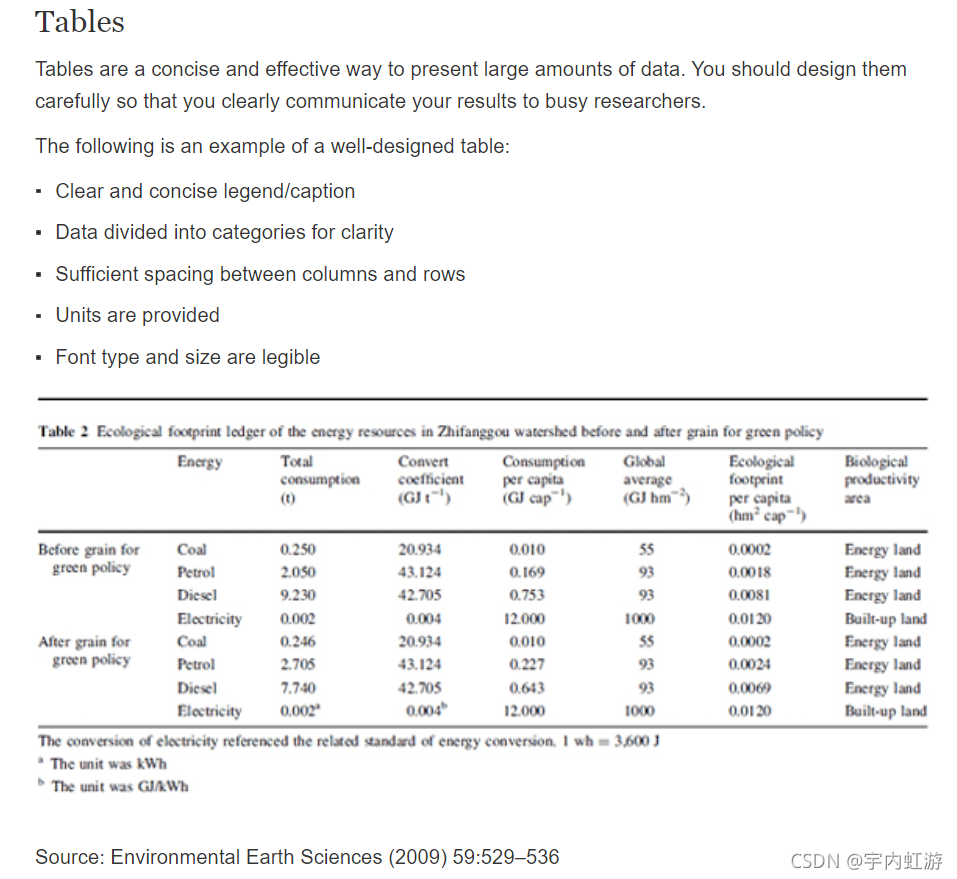
表格的技巧
技巧1
参考:Figures and tables https://www.springer.com/gp/authors-editors/authorandreviewertutorials/writing-a-journal-manuscript/figures-and-tables/10285530
图的技巧
技巧1
参考:
- Tips on effective use of tables and figures in research papers https://www.editage.com/insights/tips-on-effective-use-of-tables-and-figures-in-research-papers
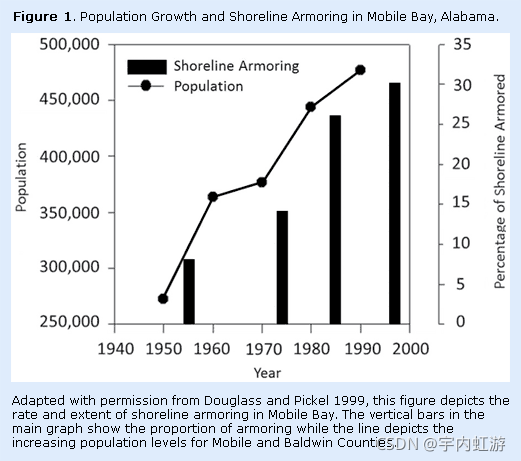
- informative title
- The axes are labeled clearly
- The key clearly identifies what each element in the graph stands for.
- A figure legend at the bottom draws the reader’s attention to the graph’s key points.
- A note at the bottom acknowledges the source.
- The graph is 2-dimensional, with no clutter.
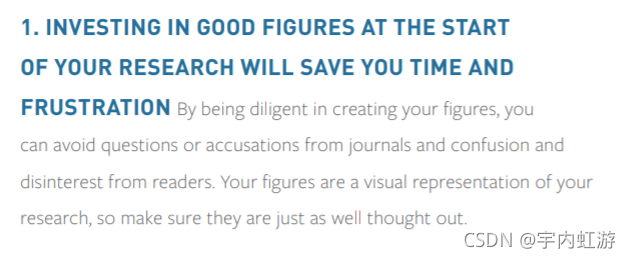
技巧2
参考:
- https://www.aje.com/dist/docs/Guide-Creating-Effective-Scientific-Figures-for-Publication.pdf
- 在论文起始之初就要多多作图。这样才不容易让读者失去兴趣(有道理)。
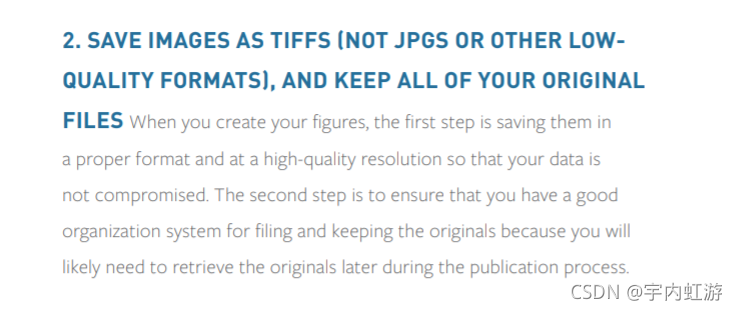
- 存储图的时候需要用tiff格式,而不是jpg等低质量的图片格式。
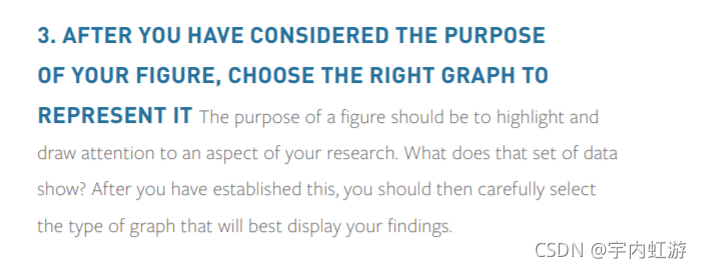
- 选择最适合的图像类型!
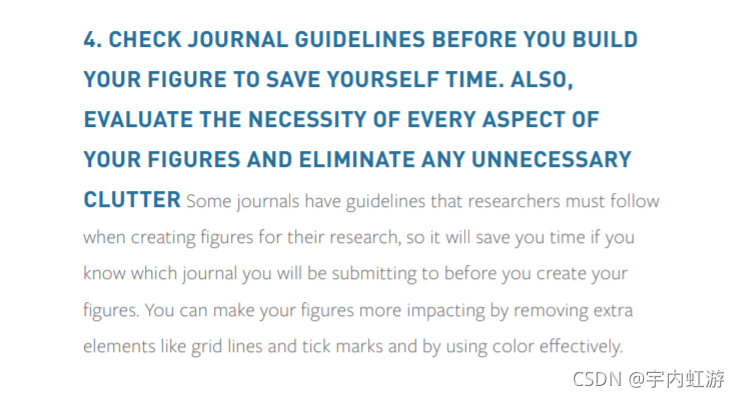
- 要遵循期刊或者会议的要求。
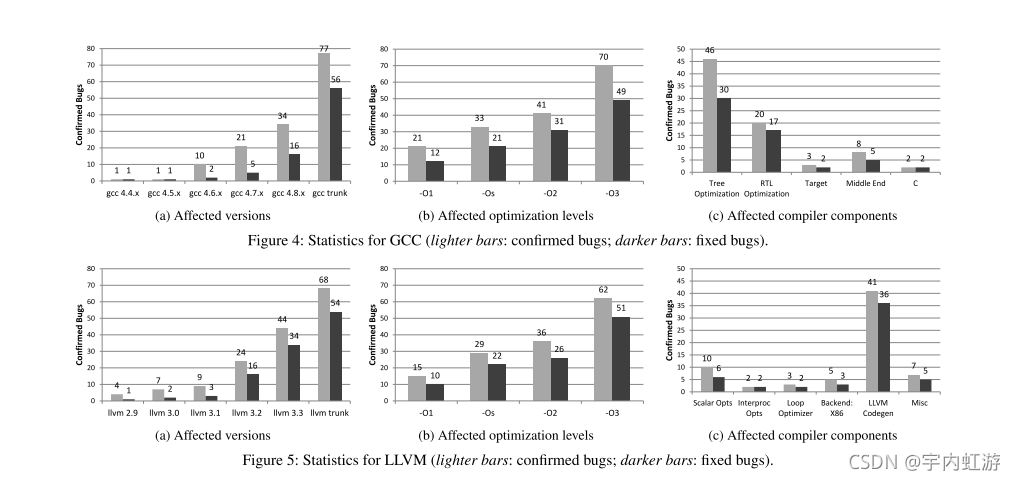
基于论文中的优秀图表案例,总结出一些规律
方法
在Mendeley中,搜索几位大牛老师,如:
- zhendong su
规律总结
- 整个文章内部的图表风格一致(配色,layout)
- 简洁。
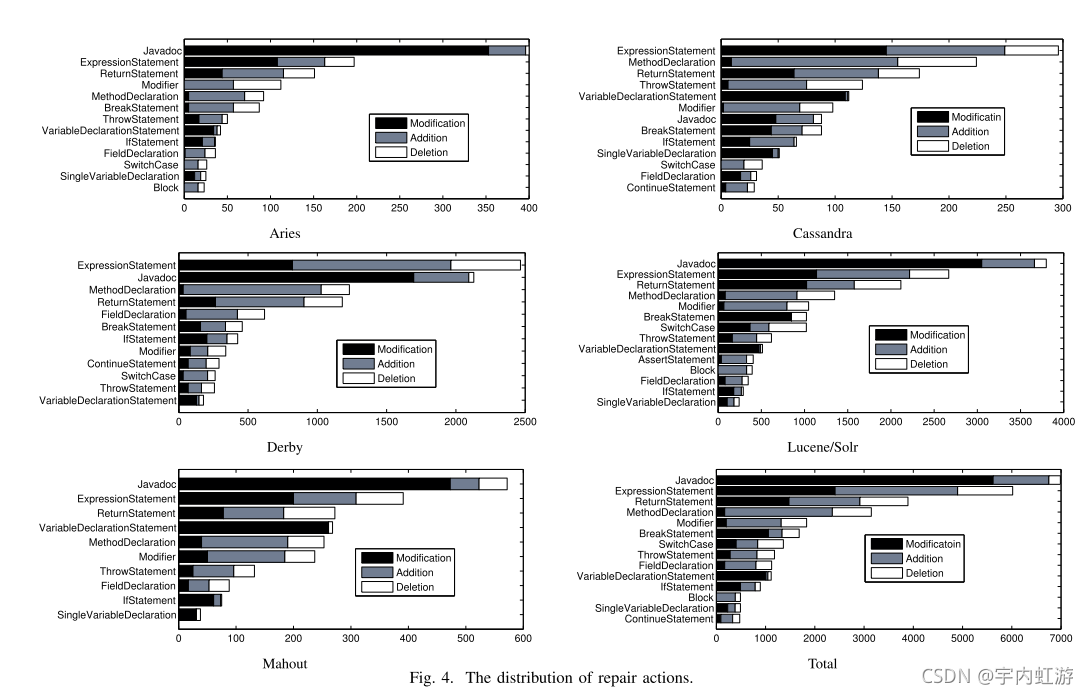
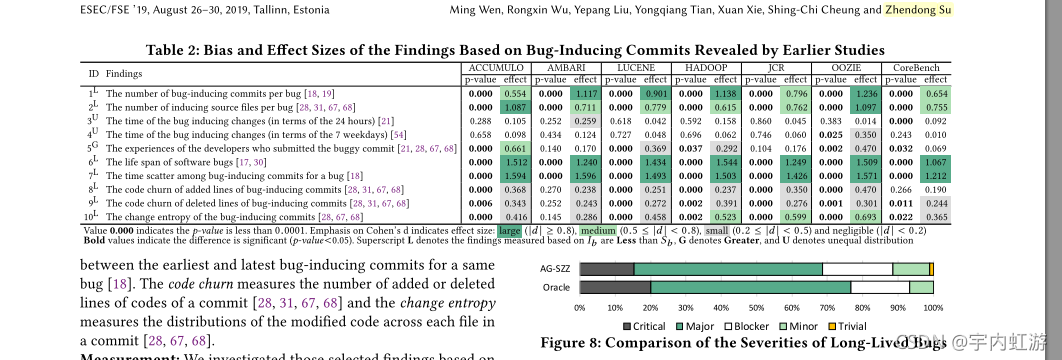
- 有自己的基础配色!
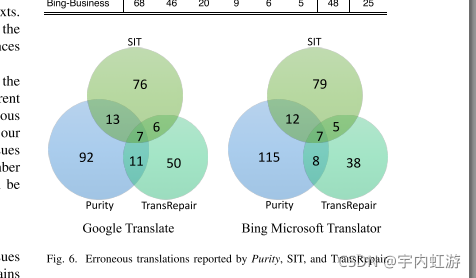
4. 图表不多的时候,灰色系也不错。
结论
综上,我感觉画出好看的图表的关键是: simple and effective。
创作结束时间:2021年10月4日16:54:59
参考文献
其他参考:
- http://www.bris.ac.uk/Depts/DeafStudiesTeaching/dissert/Figures,%20Tables%20&%20References.htm


 被折叠的 条评论
为什么被折叠?
被折叠的 条评论
为什么被折叠?
 到【灌水乐园】发言


