


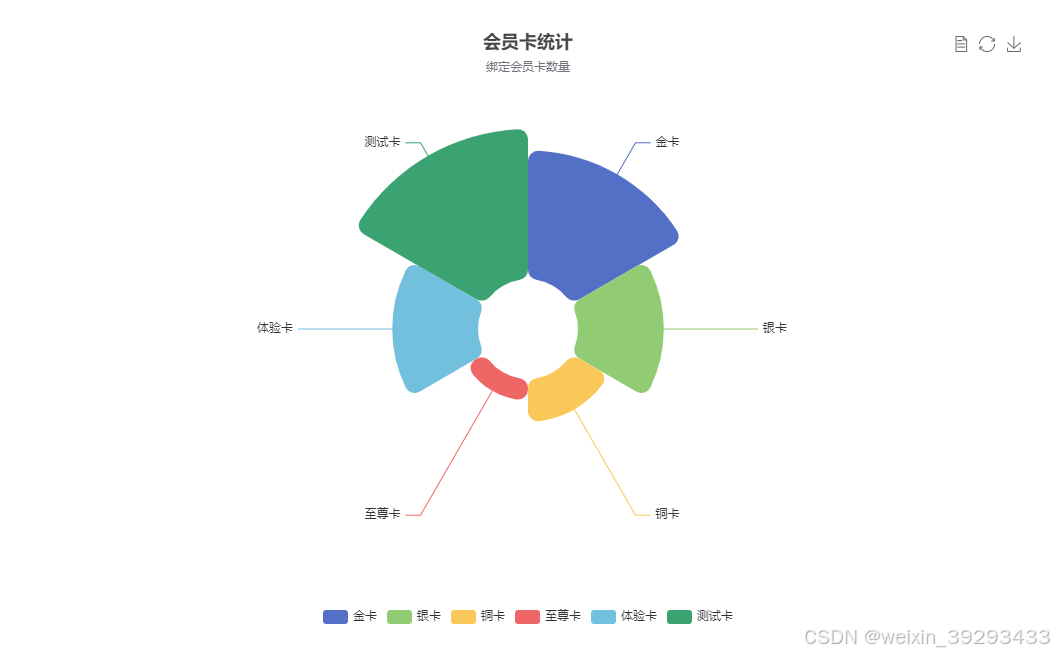
实现效果图:
实现步骤如下:
1.在vue项目中引入Echarts
npm install echarts --save2.在vue组件作用引入
import * as echarts from 'echarts'3.Demo.vue实现
<template>
        <div class="container mt20">
             <div ref="chartDom3" style="height: 600px;"></div>
        </div>
    </div>
</template>

<script setup>
import {ref,reactive,onMounted,nextTick} from 'vue'
import * as echarts from 'echarts'
import { statisticsOfMemberCard  } from '@/api/index'


const chartDom3 = ref()
let myChartPie = ref(null)
const option3 = reactive({
        title: {
            text: '会员卡统计',
            subtext: '绑定会员卡数量',
            left: 'center'
        },
        tooltip: {
            trigger: 'item',
            formatter: '{a} <br/>{b} : {c} ({d}%)'
        },
        legend: {
             left: 'center',
            top: 'bottom',
            //  data: ['rose 1', 'rose 2', 'rose 3', 'rose 4', 'rose 5', 'rose 6', 'rose 7', 'rose 8']
        },
        toolbox: {
            show: true,
            feature: {
                mark: { show: true },
                dataView: { show: true, readOnly: false },
                restore: { show: true },
                saveAsImage: { show: true }
            }
        },
        series: [
            {
                name: 'Nightingale Chart',
                type: 'pie',
                radius: [50, 200],
                center: ['50%', '50%'],
                roseType: 'area',
                itemStyle: {
                    borderRadius: 10
                },

                emphasis: {
                    label: {
                        show: true,
                        fontSize: '20',
                        fontWeight: 'bold'
                    }
                },
                data:[]
            }
        ]
    }
)


const drawer3 = () => {
     myChartPie = echarts.init(chartDom3.value)
     //todo调用后端接口获取数据
     statisticsOfMemberCard().then(res=>{
        // console.log(res)
        const info1 = res.data.data
        option3.series[0].data=info1
        myChartPie.setOption(option3);
     })
    }


onMounted( async ()=>{
   await nextTick()
    drawer3()
})

</script >
<style lang="less" scoped>
 .mt20{
    margin-top: 20px;
 }
 .box1{
   margin-left: 10px ;
   width: 300px;
 }
</style>
json数据模拟所需要的数据
{
    "msg": "success",
    "code": 0,
    "data": {
        "title": "当月每日收费统计",
        "xname": "日",
        "time": [
            "1",
            "2",
            "3",
            "4",
            "5",
            "6",
            "7",
            "8",
            "9",
            "10",
            "11",
            "12",
            "13",
            "14",
            "15",
            "16"
        ],
        "data": [
            0,
            17200,
            0,
            0,
            0,
            0,
            0,
            0,
            21400,
            0,
            0,
            0,
            1500,
            0,
            7000,
            21200
        ],
        "data2": null
    }
}
axios 发送数据请求
export const statisticsOfMemberCard=() => {
    return axios({
        url: '../index/third.json',
        method: 'get',
    })
}


 4350
4350

 被折叠的 条评论
为什么被折叠?
被折叠的 条评论
为什么被折叠?
 到【灌水乐园】发言


