


scikit-learn接口的分类器能够给出预测的不确定度估计,一般来说,分类器会预测一个测试点属于哪个类别,还包括它对这个预测的置信程度。
scikit-learn中有两个函数可以用于获取分类器的不确定度估计:decidion_function和predict_proba。
以一个二维数据集为例:
import mglearn.tools
from sklearn.ensemble import GradientBoostingClassifier
from sklearn.datasets import make_circles
import numpy as np
from sklearn.model_selection import train_test_split
import matplotlib.pyplot as plt

X,y=make_circles(noise=0.25,factor=0.5,random_state=1)

y_named=np.array(['type0','type1'])[y]
#所有数组的划分方式都是一致的
X_train,X_test,y_train_named,y_test_named,y_train,y_test=train_test_split(
    X,y_named,y,random_state=0
)
#梯度提升模型
gbrt=GradientBoostingClassifier(random_state=0)
gbrt.fit(X_train,y_train_named)
对于二分类的情况,decidion_function返回值的形状是(n_samples,),为每个样本都返回一个浮点数:
print('X_test形状:{}'.format(X_test.shape))
print('Decision_function 形状:{}'.format(gbrt.decision_function(X_test).shape))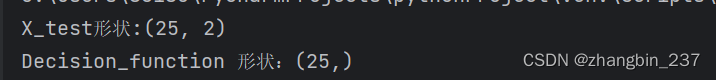
对于类别1来说,值代表模型对数据点属于“正”类的置信程度。正值代表对正类的偏好,负值代表对反类的偏好,还可以通过查看决策值的正负号来展示预测值:
print('Decision_function:{}'.format(gbrt.decision_function(X_test)[:10]))
print('正负-Decision_function:{}'.format(gbrt.decision_function(X_test)>0))
print('分类:{}'.format(gbrt.predict(X_test)))
对于二分类问题,反类始终是classes_属性的第一个元素,正类是第二个元素,因此,如果想要完全再现predict的输出,需要利用classes_属性:
greater_zore=(gbrt.decision_function(X_test)>0).astype(int)
pred=gbrt.classes_[greater_zore]
print('索引是否与输出相同:{}'.format(np.all(pred==gbrt.predict(X_test))))
decidion_function可以在任意范围取值,取决于数据和参数模型:
decision_function=gbrt.decision_function(X_test)
print('decision_function结果的最大值和最小值:{:.3f}、{:.3f}'.format(np.max(decision_function),np.min(decision_function)))

利用颜色编码画出所有点的decidion_function,还有决策边界:
plt.rcParams['font.sans-serif']=['SimHei']
plt.rcParams['axes.unicode_minus'] = False
fig,axes=plt.subplots(1,2,figsize=(13,5))
mglearn.tools.plot_2d_separator(gbrt,X,ax=axes[0],alpha=.4,fill=True,cm=mglearn.cm2)
scores_image=mglearn.tools.plot_2d_scores(gbrt,X,ax=axes[1],alpha=.4,cm=mglearn.ReBl)
for ax in axes:
    mglearn.discrete_scatter(X_test[:, 0], X_test[:, 1], y_test, markers='^', ax=ax)
    mglearn.discrete_scatter(X_train[:, 0], X_train[:, 1], y_train, markers='o', ax=ax)
    ax.set_xlabel('特征0')
    ax.set_ylabel('特征1')
cbar=plt.colorbar(scores_image,ax=axes.tolist())
axes[0].legend(['测试分类0','测试分类1','训练分类0','训练分类1'],ncol=4,loc=(.1,1.1))
plt.show()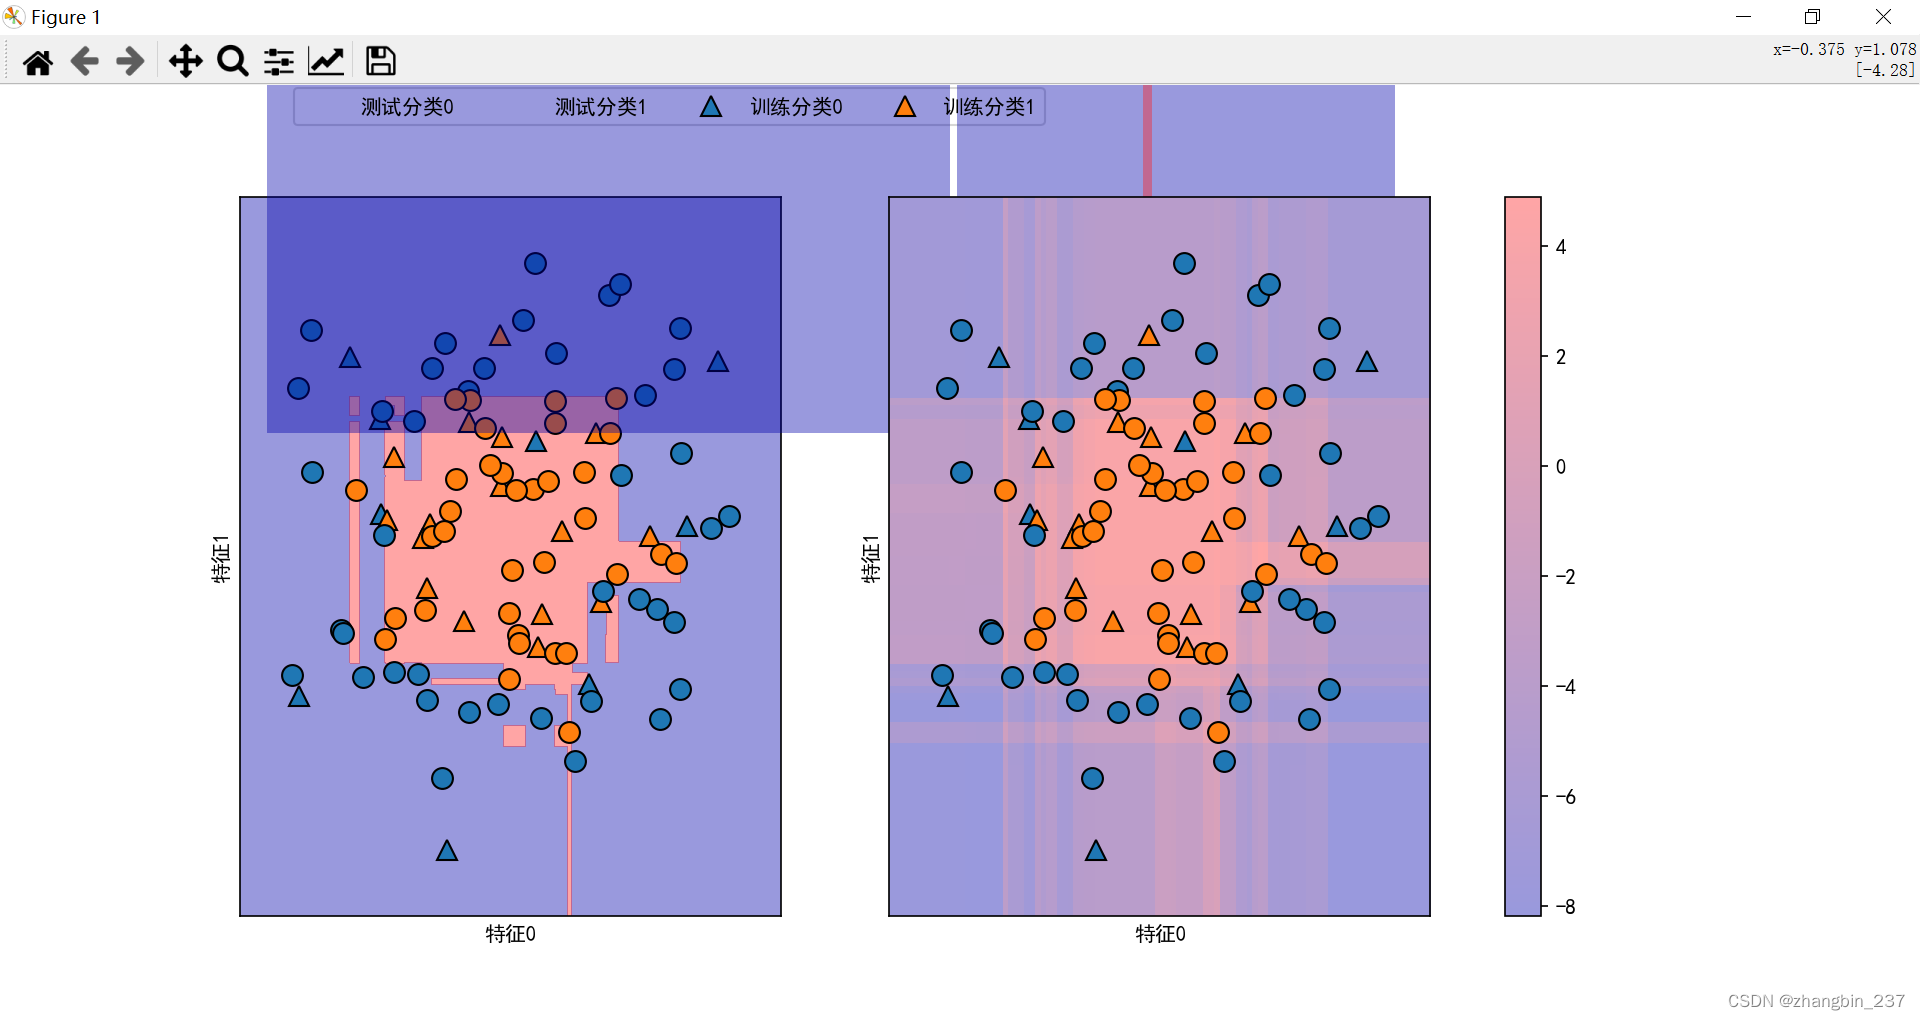


 被折叠的 条评论
为什么被折叠?
被折叠的 条评论
为什么被折叠?
 到【灌水乐园】发言


