


tooltip: {
backgroundColor: 'rgba(255,255,255,.9)',
position: ['40%', '10%'],
textStyle:{
color:'#000',
},
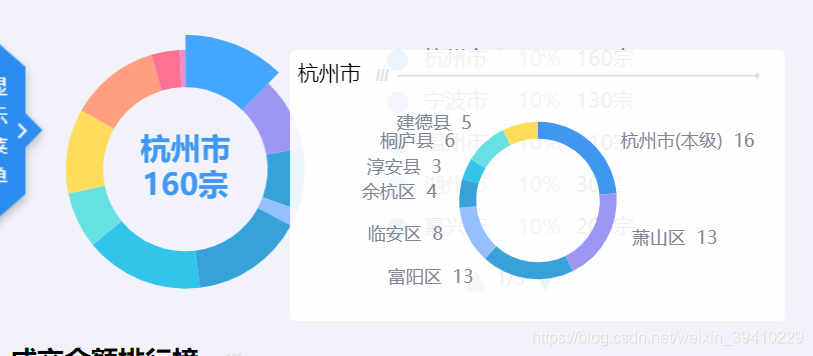
formatter: function(param){
setTimeout(function(){
that.childRegByChart(param.name,"regChart")},100)
var res = param.name + "<img style='width:80%;height:8px;margin-left:10px' src='"+ that.titleImg +"'/><div style='width:320px;height:150px' id='regChart'></div>"
return res
},
},
childRegByChart()传入id 绘制一个新的饼图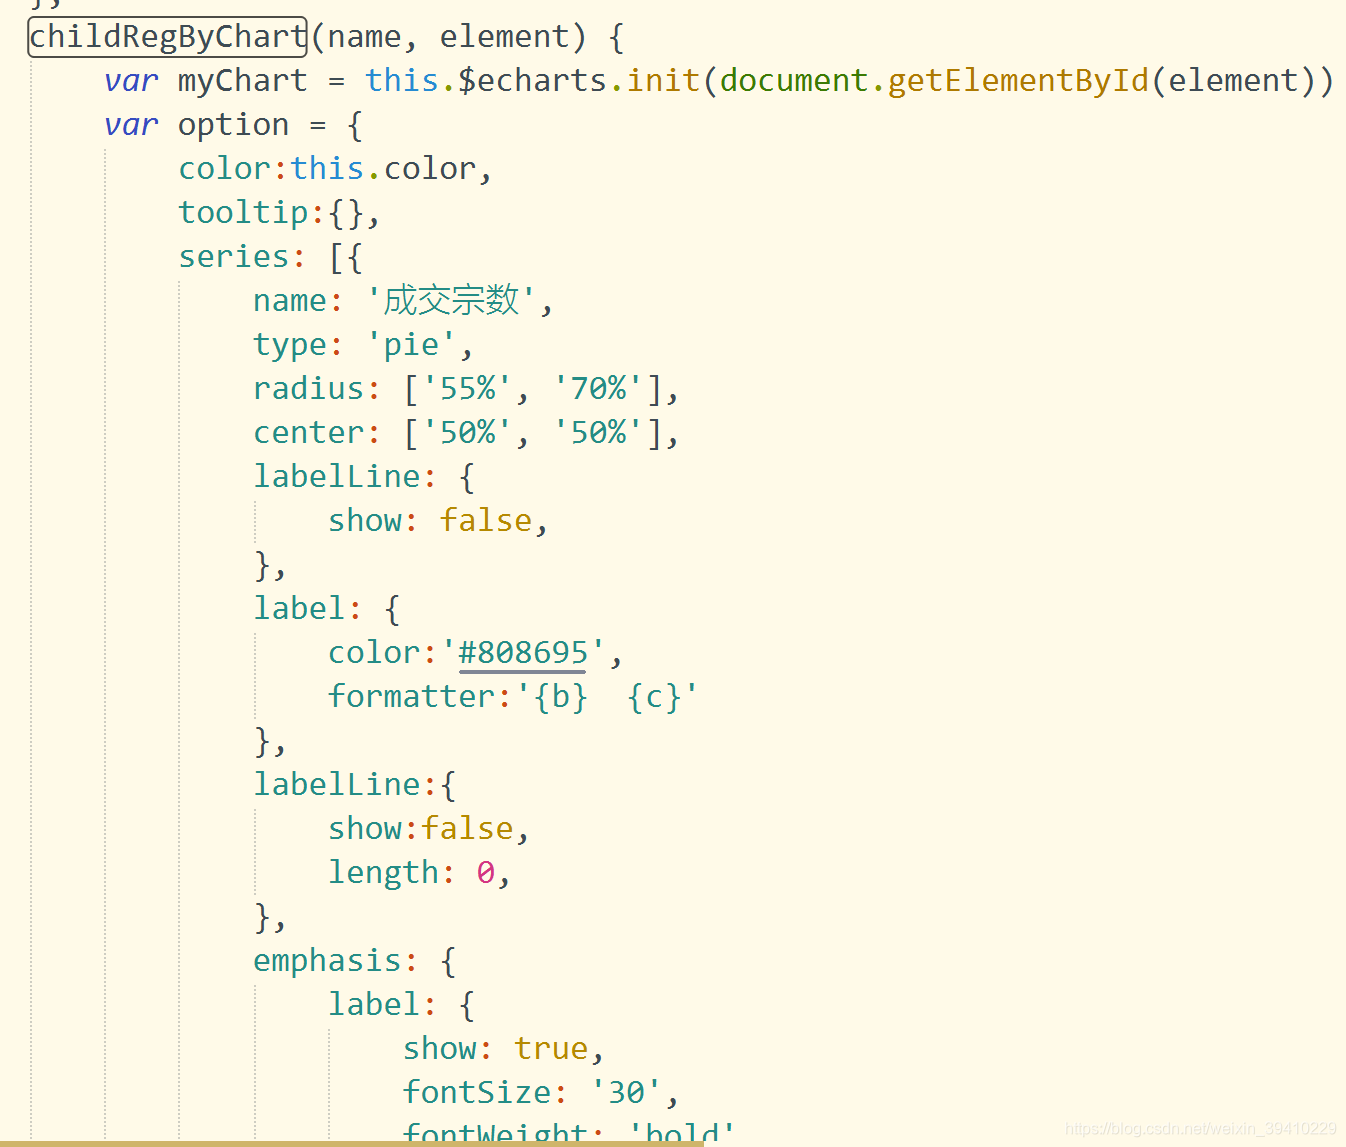
自定义二echart的legend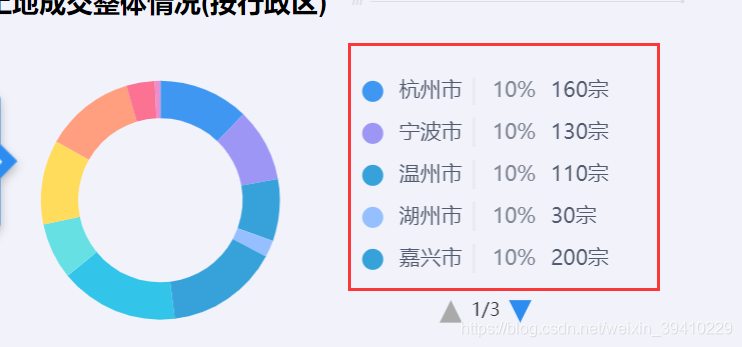
legend: {
	icon: 'circle',
	type: "scroll",
	orient: 'vertical',
	top:'center',
	right:'10%',
	align: 'left',
	top: 'middle',
	// itemGap: 18,
	pageIconColor:'#2D8CF0',
	formatter: function(name) {
		var value = 0;
		var percent = '10%';	//占比
		for(var i = 0;i<that.dataArr.length;i++){
			if(name == that.dataArr[i].name){
				value = that.dataArr[i].value
			}
		}
		var arr =["{a|" + name + "}","{b| |}", "{c|" + percent + "}", "{a|" + value + "宗}"];
	return arr.join("");
},
textStyle: {
	color: '#8C8C8C',
	rich: {
	  a: {
		color: "#515A6E",
		fontSize:14
	  },
	  b: {
		color: "#E8EAEC",
		fontSize:18
	  },
	  c: {
		color: '#808695',
		fontSize:14,
		padding:[0,10]
	  }
	},
},
height: '82%'
},


 被折叠的 条评论
为什么被折叠?
被折叠的 条评论
为什么被折叠?
 到【灌水乐园】发言


