


背景:
MySQL-5.7.12, debian 8核16G虚拟机, 业务方反馈在某一个时间点, 出现了大量的数据库报错, 之后恢复正常;
场景:
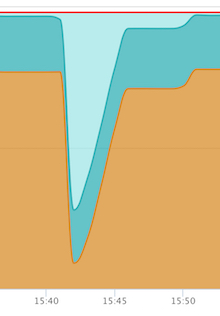
开发查看日志后, 发现在某个时间点, 应用断开了所有与数据库的连接, 几秒钟以后就恢复了;同时监控系统的内存使用率出现了异常的骤降;
3min之后收到了报警系统的信息, 内存使用率82%;
分析:
第一时间的判断是网络的问题造成了应用层的连接断开了, 但是这种内存使用率骤降的现象不会是网络造成的;查看MySQL的日志, 发现MySQL实例发生了crash, 相关的报错信息如下:
07:42:44 UTC - mysqld got signal 11 ;
This could be because you hit a bug. It is also possible that this binary
or one of the libraries it was linked against is corrupt, improperly built,
or misconfigured. This error can also be caused by malfunctioning hardware.
Attempting to collect some information that could help diagnose the problem.
As this is a crash and something is definitely wrong, the information
collection process might fail.
key_buffer_size=8388608
read_buffer_size=16777216
max_used_connections=29
max_threads=5000
thread_count=32
connection_count=22
It is possible that mysqld could use up to
key_buffer_size + (read_buffer_size + sort_buffer_size)*max_threads = 245834871 K bytes of memory
Hope that is ok; if not, decrease some variables in the equation.
Thread pointer: 0x7f607c0072c0
Attempting backtrace. You can use the following information to find out
where mysqld died. If you see no messages after this, something went
terribly wrong...
stack_bottom = 7f6141b36e80 thread_stack 0x40000
/usr/sbin/mysqld(my_print_stacktrace+0x2c)[0xe7
 最低0.47元/天 解锁文章


 3279
3279


 被折叠的 条评论
为什么被折叠?
被折叠的 条评论
为什么被折叠?
 到【灌水乐园】发言


