


 在Matlab中,使用pcolor绘制不同数据集时,每个子图的色标可能不同,导致比较困难。解决方法是通过设置'CLim'属性或使用caxis函数来确保所有子图共用相同的色标范围。例如,可以先设置'CLim'为[0 1],然后再调用colorbar,或者直接使用caxis([0,1])来设定色标范围。"
112198625,10543555,GB28181设备注册NodeJS实现-SIP注册流程详解,"['SIP协议', '通信协议', '视频监控', 'Node.js库', '设备接入']
在Matlab中,使用pcolor绘制不同数据集时,每个子图的色标可能不同,导致比较困难。解决方法是通过设置'CLim'属性或使用caxis函数来确保所有子图共用相同的色标范围。例如,可以先设置'CLim'为[0 1],然后再调用colorbar,或者直接使用caxis([0,1])来设定色标范围。"
112198625,10543555,GB28181设备注册NodeJS实现-SIP注册流程详解,"['SIP协议', '通信协议', '视频监控', 'Node.js库', '设备接入']
Reference:http://www.mathworks.com/matlabcentral/answers/100950-how-can-i-have-a-standard-colorbar-for-different-plots-in-matlab-7-0-4-r14sp2
Question:
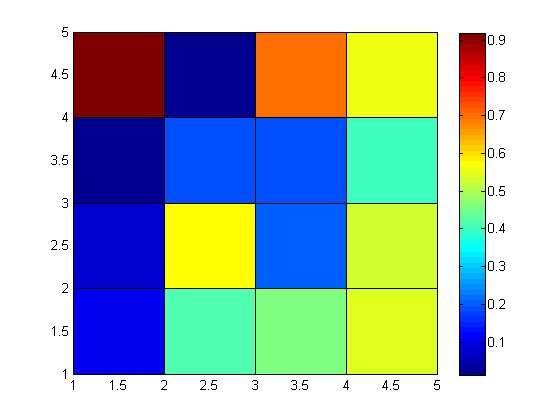
I am trying to compare different sets of data, with different sets of ranges using PCOLOR.
% Plot # 1figure(1);
C= rand(5); % Random values between 0 and 1 for Plot#1p=pcolor(C);
colorbar;% colorbar is set for figure(1)%Clears the workspace
clear all;
clc;% Plot # 2figure(2);
C= .25*rand(5) + .5; % Create random values between .375 and .625 for Plot # 2p=pcolor(C);
colorbar;% colorbar is set for figure(2)
 最低0.47元/天 解锁文章


 2085
2085


 被折叠的 条评论
为什么被折叠?
被折叠的 条评论
为什么被折叠?
 到【灌水乐园】发言


