


水平有限有误请谅解
这个问题是一位朋友@DBA-老庄的,他们使用的是PXC环境如下:
MySQL:5.7.18-15
wsrep:29.20
os:Red Hat Enterprise Linux Server release 6.5
实际上我对PXC并不是很熟,通过分析pstack还是找到了问题。并且提交Bug,percona确认了。虽然我不是第一个发现这个问题的人。
一、问题描述
数据库处于完全hang住的状态,不能连接,不能kill连接,不能show engine innodb 等等。已有的连接通过show processlist看到大量如下的连接:
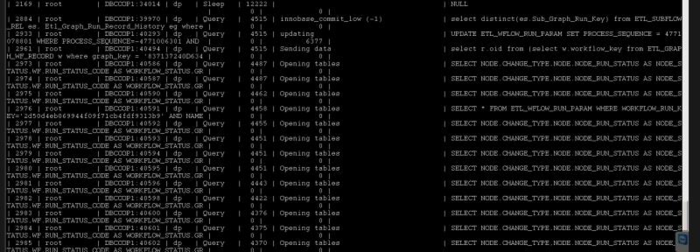
image.png
操作系统层面基本看不出来任何负载:
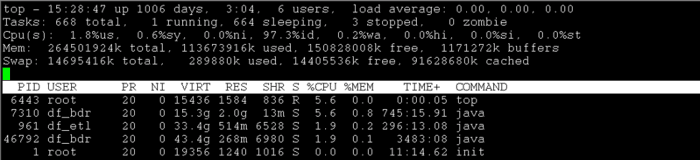
image.png
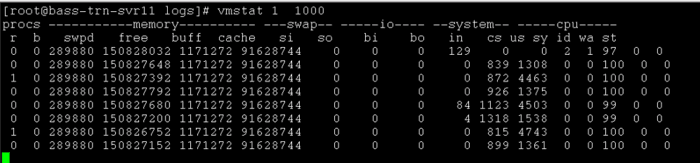
image.png
对于这种问题只能用pstack进行问题确认了。
二、为什么这么多opening tables的会话
通过pstack我发现很多会话堵塞在trx_allocate_for_mysql()如下:
Thread 54 (Thread 0x7f9085cf6700 (LWP 17448)): #0 0x0000003715e0b5bc in pthread_cond_wait@@GLIBC_2.3.2 () from /lib64/libpthread.so.0 #1 0x00000000011059cb in os_event::wait_low(long) () #2 0x00000000011b0449 in sync_array_wait_event(sync_array_t*, sync_cell_t*&) () #3 0x000000000108a8c4 in TTASEventMutex::wait(char const*, unsigned int, unsigned int) () #4 0x000000000108aa3b in PolicyMutex >::enter(unsigned int, unsigned int, char const*, unsigned int) () #5 0x00000000011e5974 in trx_allocate_for_mysql() () #wait trx #6 0x000000000106fa9f in innobase_trx_allocate(THD*) () #7 0x0000000001076d28 in ha_innobase::extra(ha_extra_function) () #8 0x0000000000ce4229 in open_tables(THD*, TABLE_LIST**, unsigned int*, unsigned int, Prelocking_strategy*) () #9 0x0000000000ce5912 in open_tables_for_query(THD*, TABLE_LIST*, unsigned int) ()
简单的说对于innodb表进行任何操作即便是select也需要分配事物,如果在事物池中没有可用的事物就行要调用这个函数进行分配,以下是栈帧:
#0 trx_allocate_for_mysql () at /mysql/mysql-5.7.17/storage/innobase/trx/trx0trx.cc:538 #1 0x0000000001913d62 in innobase_trx_allocate (thd=0x7fffc8000d30) at /mysql/mysql-5.7.17/storage/innobase/handler/ha_innodb.cc:2580 #2 0x0000000001913e04 in check_trx_exists (thd=0x7fffc8000d30) at /mysql/mysql-5.7.17/storage/innobase/handler/ha_innodb.cc:2605 #3 0x0000000001914482 in ha_innobase::update_thd (this=0x7fffc8009990, thd=0x7fffc8000d30) at /mysql/mysql-5.7.17/storage/innobase/handler/ha_innodb.cc:2825 #4 0x00000000019296b4 in ha_innobase::info_low (this=0x7fffc8009990, flag=26, is_analyze=false) at /mysql/mysql-5.7.17/storage/innobase/handler/ha_innodb.cc:13805 #5 0x000000000192a385 in ha_innobase::info (this=0x7fffc8009990, flag=26) at /mysql/mysql-5.7.17/storage/innobase/handler/ha_innodb.cc:14211 #6 0x000000000191ad83 in ha_innobase::open (this=0x7fffc8009990, name=0x7fffcc1b4540 "./test/test1", mode=2, test_if_locked=2) at /mysql/mysql-5.7.17/storage/innobase/handler/ha_innodb.cc:6130 #7 0x0000000000f48d09 in handler::ha_open (this=0x7fffc8009990, table_arg=0x7fffc8008fe0, name=0x7fffcc1b4540 "./test/test1", mode=2, test_if_locked=2) at /mysql/mysql-5.7.17/sql/handler.cc:2759 #8 0x0000000001674fd1 in open_table_from_share (thd=0x7fffc8000d30, share=0x7fffcc1b4170, alias=0x7fffc80051d8 "test1", db_stat=39, prgflag=8, ha_open_flags=0, outparam=0x7fffc8008fe0, is_create_table=false) at /mysql/mysql-5.7.17/sql/table.cc:3336 #9 0x00000000014f9577 in open_table (thd=0x7fffc8000d30, table_list=0x7fffc80051e0, ot_ctx=0x7ffff149fb80) at /mysql/mysql-5.7.17/sql/sql_base.cc:3522 #10 0x00000000014fbf7f in open_and_process_table (thd=0x7fffc8000d30, lex=0x7fffc8003028, tables=0x7fffc80051e0, counter=0x7fffc80030e8, flags=0, prelocking_strategy=0x7ffff149fcb0, has_prelocking_list=false, ot_ctx=0x7ffff149fb80) at /mysql/mysql-5.7.17/sql/sql_base.cc:5108 #11 0x00000000014fd06a in open_tables (thd=0x7fffc8000d30, start=0x7ffff149fc70, counter=0x7fffc80030e8, flags=0, prelocking_strategy=0x7ffff149fcb0) at /mysql/mysql-5.7.17/sql/sql_base.cc:5719
而这个函数里面包含如下代码:
trx_sys_mutex_enter(); ##获取trx_sys->mutex锁 ut_d(trx->in_mysql_trx_list = TRUE);
UT_LIST_ADD_FIRST(trx_sys->mysql_trx_list, trx); ##将事物加入trx_sys全局结构中的链表中 trx_sys_mutex_exit();
trx_sys是一个全局的数据结构,各个事物都以链表的形式挂载到它下面,那么修改这些链表需要通过一个mutex来保护这个全局数据结构避免多线程并发的修改。比如这里就是更新链表操作。但是我们从栈帧来看他处于open_table函数,本函数主要建立table cache同时做好表的实例化,也就是建立好mysql层和innodb层文件的对应关系,此外还会获取相应的MDL LOCK和打开frm文件。
为了测试我简单的在代码中加入了sleep(10),停顿10秒,可以看到如下。证明这里的opening tables确实是在trx_allocate_for_mysql 发生了等待出现的状态:
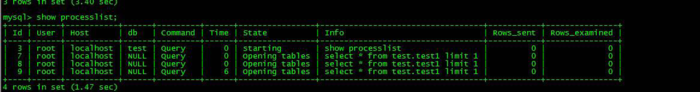
image.png
所以show processlist的state只是一个状态值,它代表是代码某一段到某一段的执行阶段,下面是一个典型的
select的状态切换流程。但是要确认问题,有时候光靠这个是不够的。
T@2: | THD::enter_stage: 'starting' /root/mysql5.7.14/percona-server-5.7.14-7/sql/conn_handler/socket_connection.cc:100
T@2: | | | | | THD::enter_stage: 'checking permissions' /root/mysql5.7.14/percona-server-5.7.14-7/sql/auth/sql_authorization.cc:843 T@2: | | | | | | THD::enter_stage: 'Opening tables' /root/mysql5.7.14/percona-server-5.7.14-7/sql/sql_base.cc:5719 T@2: | | | | | THD::enter_stage: 'init' /root/mysql5.7.14/percona-server-5.7.14-7/sql/sql_select.cc:121
T@2: | | | | | | | THD::enter_stage: 'System lock' /root/mysql5.7.14/percona-server-5.7.14-7/sql/lock.cc:321 T@2: | | | | | | | THD::enter_stage: 'optimizing' /root/mysql5.7.14/percona-server-5.7.14-7/sql/sql_optimizer.cc:151
T@2: | | | | | | | THD::enter_stage: 'statistics' /root/mysql5.7.14/percona-server-5.7.14-7/sql/sql_optimizer.cc:386 T@2: | | | | | | | THD::enter_stage: 'preparing' /root/mysql5.7.14/percona-server-5.7.14-7/sql/sql_optimizer.cc:494
T@2: | | | | | | THD::enter_stage: 'executing' /root/mysql5.7.14/percona-server-5.7.14-7/sql/sql_executor.cc:119
T@2: | | | | | | THD::enter_stage: 'Sending data' /root/mysql5.7.14/percona-server-5.7.14-7/sql/sql_executor.cc:195
T@2: | | | | | THD::enter_stage: 'end' /root/mysql5.7.14/percona-server-5.7.14-7/sql/sql_select.cc:199 T@2: | | | | THD::enter_stage: 'query end' /root/mysql5.7.14/percona-server-5.7.14-7/sql/sql_parse.cc:5174 T@2: | | | | THD::enter_stage: 'closing tables' /root/mysql5.7.14/percona-server-5.7.14-7/sql/sql_parse.cc:5252 T@2: | | | THD::enter_stage: 'freeing items' /root/mysql5.7.14/percona-server-5.7.14-7/sql/sql_parse.cc:5855
T@2: | | THD::enter_stage: 'cleaning up' /root/mysql5.7.14/percona-server-5.7.14-7/sql/sql_parse.cc:1884
三、详细的分析pstack
因为pstack日志太长了。我就不贴了。详细的分析pstack日志在开头给出的bug连接。其实要在冗长的pstack中找到有用的信息和合理的解释是一个困难的过程,因为源码能力非常有限,某些时候只能通过搜索临界区来确认问题。下面是我分析的结果,也是提交bug给出了的:
I use pstack to review stack discover Dead lock
Analyze pstack i find some problem: Thread 56: lock:trx_sys (when parameter wsrep_log_conflicts=ON lock0lock.cc 2281 line) requisite:LOCK_wsrep_thd
Thread 9: lock: LOCK_thd_list (mysql_thread_manager.cc 339 line) requisite:LOCK_thd_data (sql_parse.h 175 line)
Thread 26: lock: LOCK_thd_data (in PFS_status_variable_cache::do_materialize_all after PFS_status_variable_cache::manifest release LOCK_thd_data ,but hang) requisite:trx_sys->mutex (srv0srv.cc 1703 line)
a lot of Thread wait when call function trx_allocate_for_mysql at mutex trx_sys
a lot of Thread wait when call function THD::release_resources at mutex LOCK_thd_data
a lot of Thread wait when call function Global_THD_manager::add_thd at mutex LOCK_thd_list and any other mutex wait!!
but I not find which thread hold LOCK_wsrep_thd mutex.
Now we do follow things hope to resolve this problem: 1、wsrep_log_conflicts=off 2、SET global optimizer_switch = 'materialization=off'; 3、at high load time not execute sql 'show [global] status/select * from performance_schema.global_status'
简单的说我发现有多个线程获取mutex近乎出现环状,但是其中一环没有找到。最终percona恢复如下:
Your problem sounds quite similar to one mentioned here: https://jira.percona.com/browse/PXC-877 Said release fix the issue https://www.percona.com/blog/2018/01/26/percona-xtradb-cluster-5-7-20-29-24-is-now-available/ You may want to consider an upgrade to latest one though which has more fixes 5.7.21.
虽然我不是第一个发现的人,但是起码确认我的分析基本确认的问题。蛋疼又说升级升级。
作者微信:

微信.jpg


 192
192


 被折叠的 条评论
为什么被折叠?
被折叠的 条评论
为什么被折叠?
 到【灌水乐园】发言


