


perf可以忽略语言或者一些开发框架,从os的角度看到进程的cpu时间都耗费在哪些调用栈上。
perf与火焰图搭配使用,提供一个比较友好的交互方式,来观察调用栈的耗时
验证环境是ubuntu环境
安装
安装perf
$ sudo apt install linux-tools-common
# 装完使用perf的时候,提示还需要安装其它包
$ sudo apt install linux-tools-4.15.0-91-generic linux-cloud-tools-4.15.0-91-generic
装完之后就可以使用perf命令了。
常用的命令:是 perf record命令,help一下,可以发现
$ perf record -h
Usage: perf record [] []
or: perf record [] -- []
-a, --all-cpus system-wide collection from all CPUs
-b, --branch-any sample any taken branches
-B, --no-buildid do not collect buildids in perf.data
-c, --count event period to sample
-C, --cpu list of cpus to monitor
-d, --data Record the sample addresses
-D, --delay ms to wait before starting measurement after program s
-e, --event event selector. use 'perf list' to list available even
-F, --freq profile at this frequency
-g enables call-graph recording
-G, --cgroup monitor event in cgroup name only
-I, --intr-regs[=]
sample selected machine registers on interrupt, use -I
-i, --no-inherit child tasks do not inherit counters
-j, --branch-filter branch stack filter modes
-k, --clockid clockid to use for events, see clock_gettime()
-m, --mmap-pages number of mmap data pages and AUX area tracing mmap pa
-N, --no-buildid-cache
do not update the buildid cache
-n, --no-samples don't sample
-o, --output output file name
-P, --period Record the sample period
-p, --pid record events on existing process id
-q, --quiet don't print any message
-R, --raw-samples collect raw sample records from all opened counters
-r, --realtime collect data with this RT SCHED_FIFO priority
-S, --snapshot[=]
AUX area tracing Snapshot Mode
-s, --stat per thread counts
-t, --tid record events on existing thread id
-T, --timestamp Record the sample timestamps
-u, --uid user to profile
-v, --verbose be more verbose (show counter open errors, etc)
-W, --weight sample by weight (on special events only)
--all-kernel Configure all used events to run in kernel space.
--all-user Configure all used events to run in user space.
--buildid-all Record build-id of all DSOs regardless of hits
--call-graph setup and enables call-graph (stack chain/backtrace):
record_mode: call graph recording mode (fp|dw
record_size: if record_mode is 'dwarf', max s
default: 8192 (bytes)
Default: fp
--clang-opt options passed to clang when compiling BPF scriptlets
--clang-path clang binary to use for compiling BPF scriptlets
--dry-run Parse options then exit
--exclude-perf don't record events from perf itself
--filter event filter
--group put the counters into a counter group
--namespaces Record namespaces events
--no-buffering collect data without buffering
--overwrite use overwrite mode
--per-thread use per-thread mmaps
--phys-data Record the sample physical addresses
--proc-map-timeout per thread proc mmap processing timeout in ms
--running-time Record running/enabled time of read (:S) events
--sample-cpu Record the sample cpu
--switch-events Record context switch events
--switch-output[=]
Switch output when receive SIGUSR2 or cross size,time
--tail-synthesize
synthesize non-sample events at the end of output
--timestamp-filename
append timestamp to output filename
--transaction sample transaction flags (special events only)
--user-regs[=]
sample selected machine registers on interrupt, use -I
--vmlinux vmlinux pathname
安装flamegraph
火焰图是脚本,只需要下载
$ git clone https://github.com/brendangregg/FlameGraph.git
使用
perf的教程主要参考 http://www.brendangregg.com/perf.html
火焰图的教程主要参考 http://www.brendangregg.com/flamegraphs.html
# -F是每秒的采样次数 -p 是进程id, -a 是采集所有cpu, -g是记录调用依赖关系,sleep
$ sudo perf record -F 99 -p 85356 -a -g -- sleep 10
# 上一步会在当前目录生成 perf.data文件,需要转化为profile未见
$ sudo perf script > out.perf
# 生成一个中间文件 out.folded
$ ./FlameGraph/stackcollapse-perf.pl out.perf > out.folded
# out.svg就是我们要的火焰图文件,可以用浏览器打开
$ ./FlameGraph/flamegraph.pl out.folded > out.svg
用浏览器打开
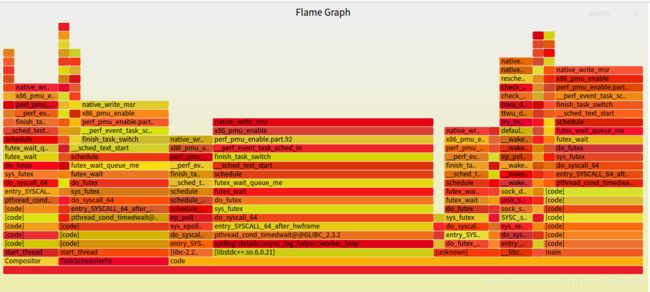
火焰图怎么看?
教程是这样说的
The x-axis shows the stack profile population, sorted alphabetically (it is not the passage of time), and the y-axis shows stack depth, counting from zero at the bottom. Each rectangle represents a stack frame. The wider a frame is is, the more often it was present in the stacks. The top edge shows what is on-CPU, and beneath it is its ancestry. The colors are usually not significant, picked randomly to differentiate frames.
x轴是按照字母排列的profile调用栈信息
y轴代表栈深度。每个矩形代表一个栈帧,矩形越宽,说明调用越频繁。
上下矩形具有祖先关系,下面矩形是上面矩形的祖先,调用关系的表现在这。
颜色是随机的,没有意义。
火焰图就是看顶层的哪个函数占据的宽度最大。只要有"平顶"(plateaus),就表示该函数可能存在性能问题。


 275
275


 被折叠的 条评论
为什么被折叠?
被折叠的 条评论
为什么被折叠?
 到【灌水乐园】发言


