


在开发过程中遇到图表绘制之后可能会改变大小的情景, 需要图表具有自适应容器大小的能力
首先先写个自适应大小的div, 随着页面的变化div大小也会动态的发生变化
<!DOCTYPE html>
<html>
<head>
<style>
html, body {
width: 100%;
height: 100%;
}
.main {
width: 100%;
height: 100%;
display: flex;
justify-content: center;
align-items: center;
}
.box {
width: 60%;
height: 50%;
border: 1px solid black;
}
</style>
</head>
<body style="height: 100%; margin: 0">
<div class="main">
<div id="container" class="box"></div>
</div>
<script type="text/javascript" src="http://echarts.baidu.com/gallery/vendors/echarts/echarts.min.js"></script>
<script type="text/javascript">
</script>
</body>
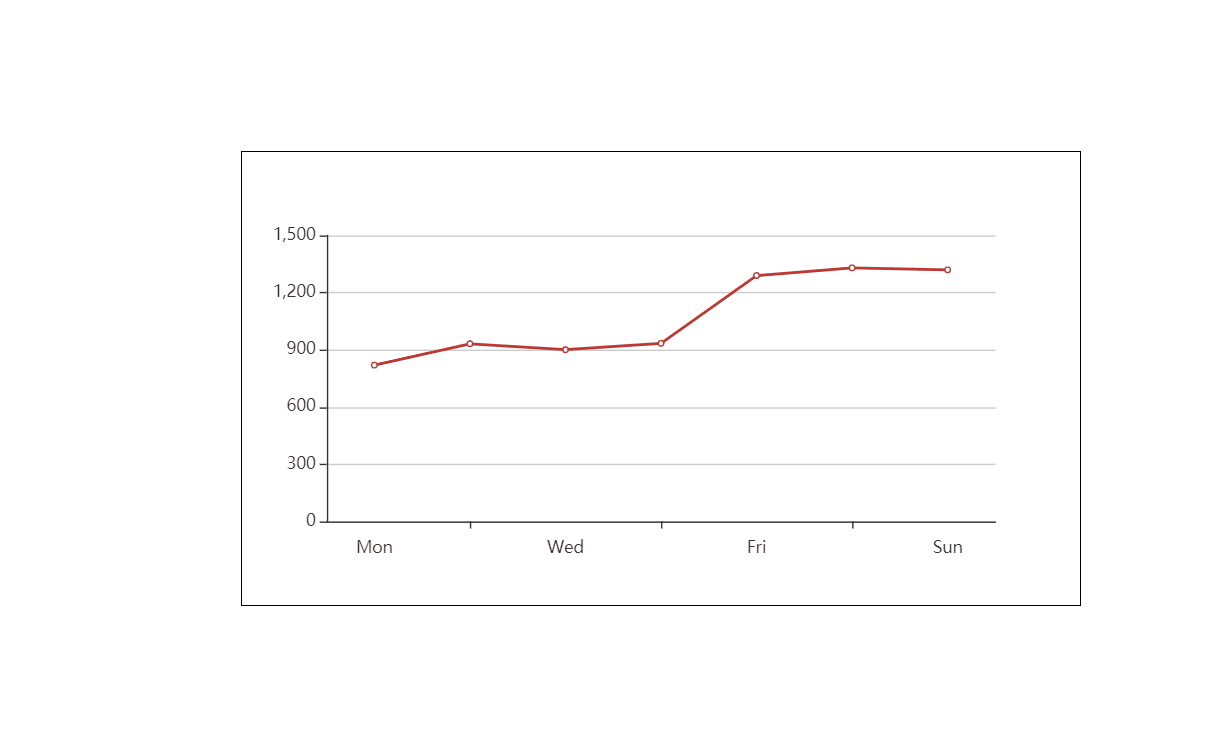
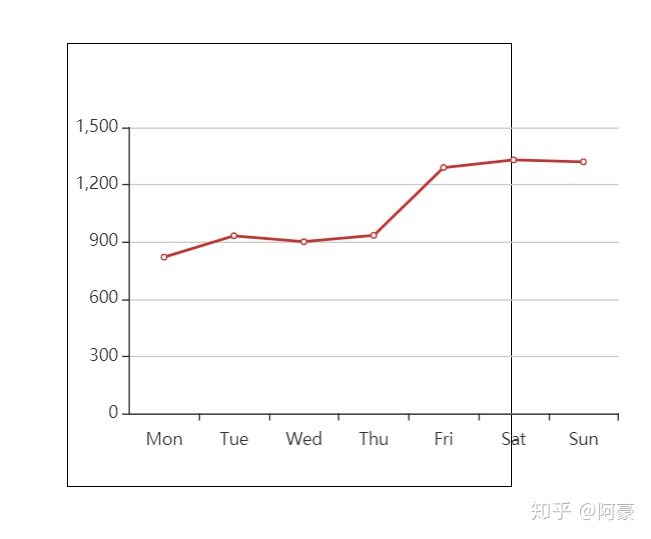
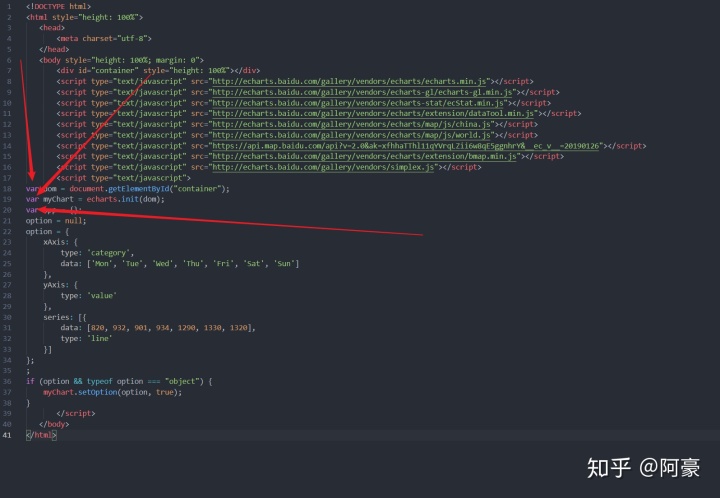
</html>开始绘制我们的图表, 用官网上的折现图, 但是发现当我们的页面大小发生变化后, 图表并没有变化, 导致溢出
  let dom = document.getElementById("container");
  let myChart = echarts.init(dom);
  let option = {
    xAxis: {
      type: 'category',
      data: ['Mon', 'Tue', 'Wed', 'Thu', 'Fri', 'Sat', 'Sun']
    },
    yAxis: {
      type: 'value'
    },
    series: [{
      data: [820, 932, 901, 934, 1290, 1330, 1320],
      type: 'line'
    }]
  };
  ;
  myChart.setOption(option, true);
通过在网上瞅瞅, 找到了可以重新改变大小的api, 但这个用法怎么看起来有点奇怪
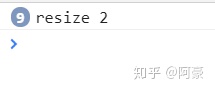
使用赋值的方式会有问题, 测试代码如下, 会覆盖之前绑定的函数
window.onresize = () => {
  console.log('resize 1')
}

window.onresize = () => {
  console.log('resize 2')
}
使用监听器的方式实现比较稳妥
window.addEventListener('resize', () => {
  console.log('resize')
  myChart.resize()
})
然后就是这东西咋和闭包有啥关系?

来来来, 闭包入门, 先想想输出是啥
let a = [1, 2, 3]
for (let i of a) {
  setTimeout(() => console.log(i), 0)
}

for (var i of a) {
  setTimeout(() => console.log(i), 0)
}
.
.
.
.
.
.
第一个输出 1,2,3没问题, 第二个输出3,3,3. emm
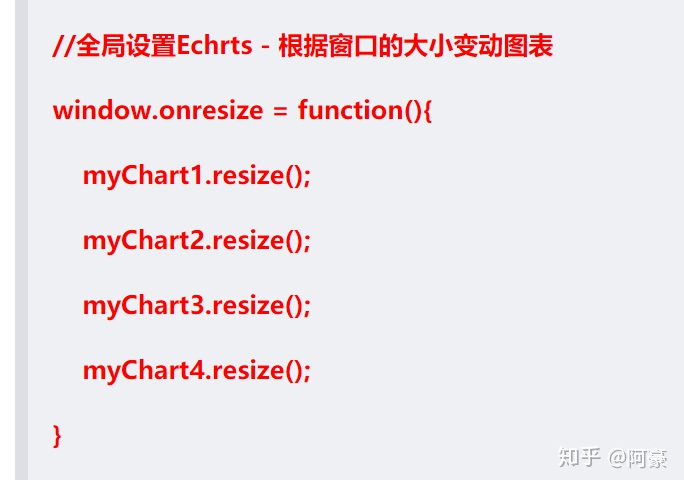
实际中我是绘制了多个图表, 但是踩了闭包的坑, 导致每次只有最后一个图表是自适应的!!!!
这段代码有错, 清小心使用
<!DOCTYPE html>
<html>
<head>
  <style>
    html, body {
      width: 100%;
      height: 100%;
    }

    .main {
      width: 100%;
      height: 100%;
      display: flex;
      justify-content: center;
      align-items: center;
    }

    .box {
      width: 45%;
      height: 50%;
      border: 1px solid black;
    }
  </style>
</head>
<body style="height: 100%; margin: 0">
<div class="main">
  <div id="box1" class="box"></div>
  <div id="box2" class="box"></div>
</div>
<script type="text/javascript" src="http://echarts.baidu.com/gallery/vendors/echarts/echarts.min.js"></script>
<script type="text/javascript">
  for (let name of ['box1', 'box2']) {
    let dom = document.getElementById(name);
    var myChart = echarts.init(dom);
    let option = {
      xAxis: {
        type: 'category',
        data: ['Mon', 'Tue', 'Wed', 'Thu', 'Fri', 'Sat', 'Sun']
      },
      yAxis: {
        type: 'value'
      },
      series: [{
        data: [820, 932, 901, 934, 1290, 1330, 1320],
        type: 'line'
      }]
    };
    ;
    myChart.setOption(option, true);
    window.addEventListener('resize', () => {
      console.log('resize')
      myChart.resize()
    })
  }

</script>
</body>
</html>
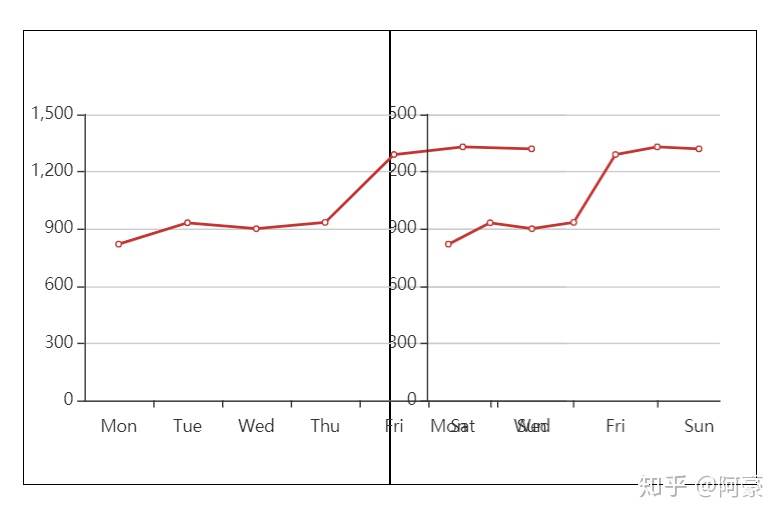
罪魁祸首就是它, 没错就是var
// var myChart = echarts.init(dom);
let myChart = echarts.init(dom);
那你为啥不用let 呢, 下面请欣赏官网案例 ↓↓↓


 939
939


 被折叠的 条评论
为什么被折叠?
被折叠的 条评论
为什么被折叠?
 到【灌水乐园】发言


