


根据大家的要求,及时更新了AQF编程语言Python丨金融数据获取之tushare (下)~历史阅读:金融数据获取之tushare(上)~
2 投资参考数据
import tushare as tsimport pandas as pd
2.1 分配预案
# argm: top=n,最近公布的那条数据# return: divi:每10股分红金额# return: shares:每10股转增和送股数df = ts.profit_data(year=2017, top=25)
df.head()
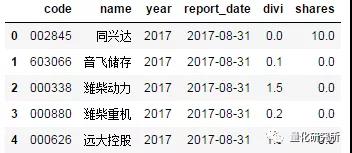
图2.1
2.2 业绩预告
# 获取2016年年报(第四季度)预报# return:report_date: 预报发布时间# return:pre_eps:去年同期每股收益# return:range:预报业绩变动范围df = ts.forecast_data(year=2017, quarter=3)
df.head()
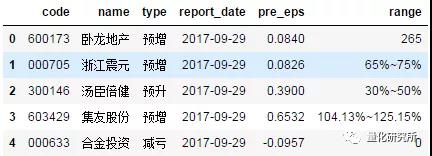
图2.2
2.3 限售股解禁
# 获取特定年月限售股解禁数据# return: count:解禁数量# return: ratio:占总股本比例df = ts.xsg_data(year=2017, month=1)
df.head()

图2.3
2.4 基金持股
# 获取特定季度基金持有上市公司股票的数据# return: nums:基金家数# return:nlast: 与上期相比持仓基金家数变动# return:count:基金持股数(万股)# return:clast: 与上期相比基金持股数量变动# return:amount:基金持股市值# return:ratio:基金持股占流通股比例df = ts.fund_holdings(year=2016, quarter=4)
df.head()
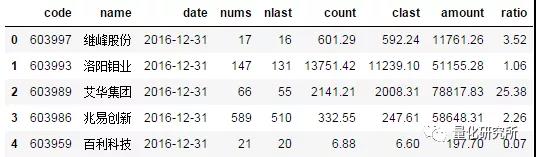
图2.4.1
# 获取IPO数据# return: ipo_date: 上网发行日期# return:issue_date: 上市日期# return: amount: 发行数量(万股)# return:markets: 上网发行数量(万股)# return:price:发行价格# return:pe: 发行市盈率# return:limit:个人申购上线(万股)# return:funds:募集资金(亿元)# return: ballot: 网上中签率(%)df = ts.new_stocks()
df.head()

图2.4.2
2.5 融资融券
2.5.1 汇总数据
# 获取融资融券数据# return: rzye: 当日融资余额(元)# return: rzmre: 当日融资买入金额(元)# return: rqyl: 当日融券余量# return: rqylje: 当日融券余量金额(元)# return: rqmcl: 当日融券卖出量# return: rzrqjyzl: 当日融资融券余额
# 沪市融资融券数据df = ts.sh_margins(start='2017-01-01', end='2017-01-31')
df.head()
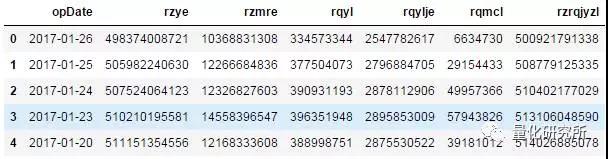
图2.5.1.1
# 深市融资融券数据df = ts.sz_margins(start='2017-01-01', end='2017-01-31')
df.head()
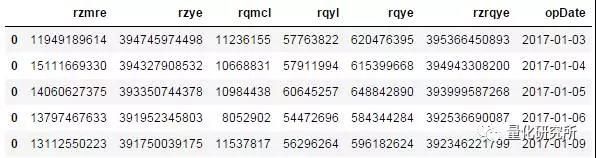
图2.5.1.2
2.5.2 明细数据
# 获取特定标的物的融资融券数据# return: rzche: 当日融资偿还额(元)# return:rqchl: 当日融券偿还量
# 沪市融资融券明细df = ts.sh_margin_details(start='2017-01-01', end='2017-01-31', symbol='600018')
df.head()
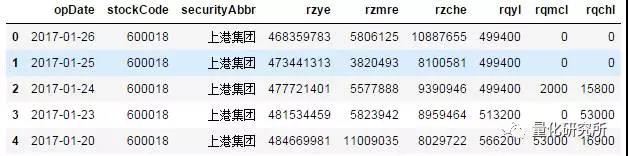
图2.5.2.1
# 深市融资融券明细# 深市融资融券名字每次只能获取一天的数据df = ts.sz_margin_details('2017-09-01')
df.head()

图2.5.2.2
2.6 应用实例
统计2016年末基金持仓比例最高和最低的100只股票在其后一个月和三个月的涨跌幅情况。
import tushare as tsimport pandas as pd
import seabornimport matplotlib.pyplot as plt
fund_holdings = ts.fund_holdings(year=2016, quarter=4)fund_holdings = fund_holdings[(fund_holdings.code.map(len)==6) & (fund_holdings.name.map(len)<5)]fund_holdings = fund_holdings.astype({'code': str, 'ratio':float}, copy=True)fund_holdings.head()

图2.6.1
fund_holdings = fund_holdings.sort_values('ratio')
bottom_stocks = fund_holdings.code[:100].tolist()top_stocks = fund_holdings.code[-100:].tolist()top_stocks[:5]
['002321', '600759', '600502', '002117', '600118']
series_list = []for code in top_stocks+bottom_stocks: s = ts.bar(code, '2016-12-30', '2017-03-31', adj='qfq').close s.name = code series_list.append(s)close = pd.DataFrame(series_list).Tclose.head()

图2.6.2
def cum_return(close_df, start:str, end:str):
close_df = close_df.astype('float')
close_df.index = pd.to_datetime(close_df.index)
change = close_df/close_df.shift(1)
start_dt, end_dt = pd.to_datetime((start, end))
change_part = change[start_dt:end_dt]
period_return = change_part.aggregate('prod') return period_return - 1def calc_return(close_df, top, bottom, start:str, end:str):
period_return = cum_return(close_df, start, end)
top_return = period_return[top].reset_index(drop=True)
bottom_return = period_return[bottom].reset_index(drop=True) return pd.DataFrame({'top': top_return, 'bottom':bottom_return})
return1 = calc_return(close, top_stocks, bottom_stocks, '2016-12-30','2017-01-31')return3 = calc_return(close, top_stocks, bottom_stocks, '2016-12-30','2017-03-31')return1.head()

图2.6.3
fig, ax = plt.subplots(1,2)fig.figsize = (90,45)ax[0].set_title('1 month return')ax[1].set_title('3 month return')ax[0].set_xlabel('period return')ax[1].set_xlabel('period return')return3.plot.hist(alpha=0.5, ax=ax[1])return1.plot.hist(alpha=0.5, ax=ax[0])ylim = ax[1].get_ylim()ax[0].set_ylim(ylim)plt.show()
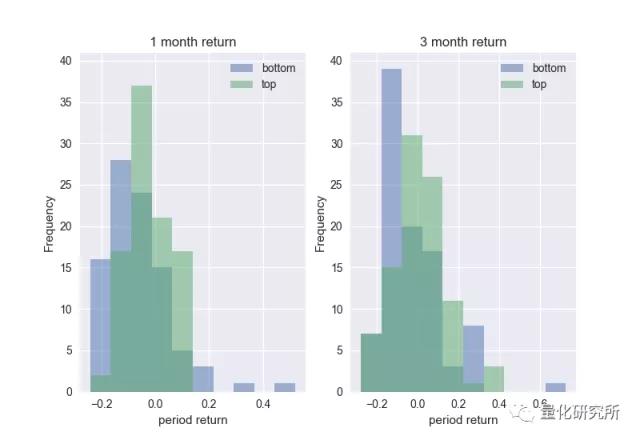
图2.6.5
从以上分布图可以看到,2016年底基金持仓比例前100名的个股在之后一个月和三个月的总体表现都优于基金持仓比例最后100名的个股。需要指出的是,由于样本有限,这里得到的结果并不具有统计意义。此处仅提供一个可能的研究方向和代码实现思路,希望可以对大家有所帮助。附上GIF动图版,让你能更直观了解Python那些事儿~那么,就祝大家学习愉快! >>>点击咨询Python金融应用实战

量化金融分析师AQF交流答疑群:737550026
声明▎更多内容请关注微信号量化金融分析师。原创文章,欢迎分享,若需引用或转载请保留此处信息。


 910
910


 被折叠的 条评论
为什么被折叠?
被折叠的 条评论
为什么被折叠?
 到【灌水乐园】发言


