


一、绘制简单的折线图
importmatplotlib.pyplot as plt
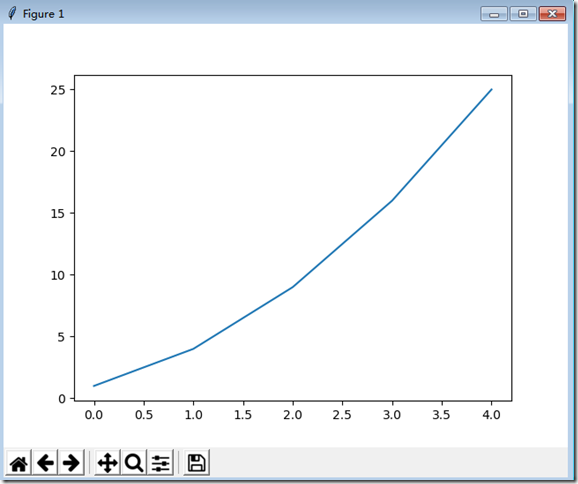
squares=[1,4,9,16,25]
plt.plot(squares)
plt.show()
我们首先导入模块pylot,并给他指定别名plt,然后创建列表,存储前述的平方数,再将这个列表传递给函数plot(),这个函数尝试根据这些数字绘制出有意义的图形。plot.show()打开matplotlib查看器,并显示绘制图形。
运行结果:
二、修改标签文字和线条粗细
#coding:UTF-8
importmatplotlib.pyplot as plt
squares=[1,4,9,16,25]
plt.plot(squares,linewidth= 5)#设置图形的标题,并给坐标轴加上标签
plt.title("Squares Numbers",fontsize=24)
plt.xlabel("Value",fontsize=14)
plt.ylabel("Square of value",fontsize=14)#设置刻度表标记的大小
plt.tick_params(axis="both",labelsize=14)
plt.plot(squares)
plt.show()
title():给图表指定标题
xlabel():给X轴设置标题
< 最低0.47元/天 解锁文章


 2324
2324


 被折叠的 条评论
为什么被折叠?
被折叠的 条评论
为什么被折叠?
 到【灌水乐园】发言


