


有几种不同的方法可以做到这一点。“最佳”方法主要取决于要绘制的线段数。
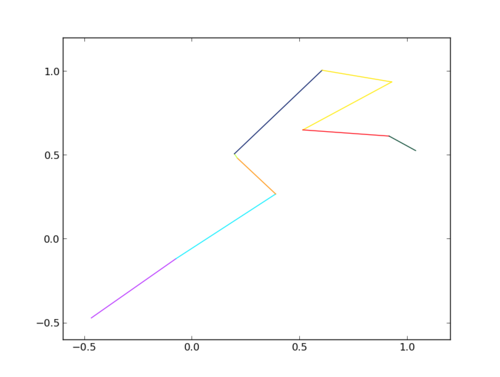
如果您只是要绘制少量(例如10条)线段,则可以执行以下操作:import numpy as npimport matplotlib.pyplot as pltdef uniqueish_color():
"""There're better ways to generate unique colors, but this isn't awful."""
return plt.cm.gist_ncar(np.random.random())xy = (np.random.random((10, 2)) - 0.5).cumsum(axis=0)fig, ax = plt.subplots()for start, stop in zip(xy[:-1], xy[1:]):
x, y = zip(start, stop)
ax.plot(x, y, color=uniqueish_color())plt.show()
但是,如果要绘制具有一百万个线段的图形,绘制起来将非常缓慢。在这种情况下,请使用LineCollection。例如import numpy as npimport matplotlib.pyplot as pltfrom matplotlib.collections import LineCollectionxy = (np.random.random((1000, 2)) - 0.5).cumsum(axis=0)# Reshape things so that we have a sequence of:# [[(x0,y0),(x1,y1)],[(x0,y0),(x1,y1)],...]xy = xy.reshape(-1, 1, 2)segments = np.hstack([xy[:-1], xy[1:]])fig, ax = plt.subplots()coll = LineCollection(segments, cmap=plt.cm.gist_ncar)coll.set_array(np.random.random(xy.shape[0]))ax.add_collection(coll)ax.autoscale_view()plt.show()
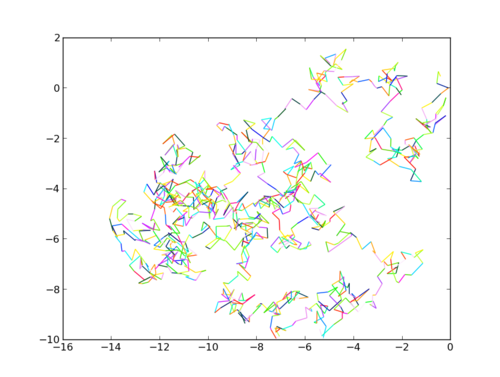
对于这两种情况,我们都只是从“ gist_ncar”颜色放大器中绘制随机颜色。在这里查看颜色图(gist_ncar大约是向下的2/3):http ://matplotlib.org/examples/color/colormaps_reference.html


 1673
1673

 被折叠的 条评论
为什么被折叠?
被折叠的 条评论
为什么被折叠?
 到【灌水乐园】发言


