


 本文介绍了在R语言中进行多重线性回归分析时,如何选择最佳自变量的多种方法,包括使用olsrr包和leaps包进行模型构建和变量筛选。详细展示了从输入代码到得到结果的步骤,提供了清晰的操作示例。
微信公众号:医学统计与R语言
Code
√输入1:
install.packages("rio")
library(rio)
qol1 import("qol.sav")
linqol data=qol1)
summary(linqol)
√结果1:
  Call:
lm(formula = 生理功能 ~ newincome + Q34 + newQ35 + Q36, data = qol1)

Residuals:
    Min      1Q  Median      3Q     Max
-41.130  -9.744  -0.272  10.653  27.853

Coefficients:
            Estimate Std. Error t value Pr(>|t|)
(Intercept)  89.5463     2.7487  32.577  2e-16 ***
newincome     2.6830     0.6792   3.950 8.61e-05 ***
Q34           2.0889     0.9786   2.135   0.0331 *
newQ35       -9.5109     0.9972  -9.538  2e-16 ***
Q36          -1.5746     1.1292  -1.394   0.1636
---
Signif. codes:  0 ‘***’ 0.001 ‘**’ 0.01 ‘*’ 0.05 ‘.’ 0.1 ‘ ’ 1

Residual standard error: 12.68 on 688 degrees of freedom
Multiple R-squared:  0.1701,    Adjusted R-squared:  0.1653
F-statistic: 35.26 on 4 and 688 DF,  p-value: 2.2e-16
√输入2:
coefficients(linqol) # model coefficients
confint(linqol, level=0.95) # CIs for model parameters
fitted(linqol) # predicted values
residuals(linqol) # residuals
anova(linqol) # anova table
vcov(linqol) # covariance matrix for model parameters
influence(linqol) # regression diagnostics
√输入3:
 install.packages("lm.beta")
 library(lm.beta)
 stlm <- lm.beta(linqol)
 summary(stlm)
√结果3:
Call:
lm(formula = 生理功能 ~ newincome + Q34 + newQ35 + Q36, data = qol1)

Residuals:
    Min      1Q  Median      3Q     Max
-41.130  -9.744  -0.272  10.653  27.853

Coefficients:
            Estimate Standardized Std. Error t value Pr(>|t|)
(Intercept) 89.54626      0.00000    2.74875  32.577  2e-16 ***
newincome    2.68304      0.14019    0.67918   3.950 8.61e-05 ***
Q34          2.08892      0.07442    0.97857   2.135   0.0331 *
newQ35      -9.51092     -0.34045    0.99719  -9.538  2e-16 ***
Q36         -1.57462     -0.04968    1.12919  -1.394   0.1636
---
Signif. codes:  0 ‘***’ 0.001 ‘**’ 0.01 ‘*’ 0.05 ‘.’ 0.1 ‘ ’ 1

Residual standard error: 12.68 on 688 degrees of freedom
Multiple R-squared:  0.1701,    Adjusted R-squared:  0.1653
F-statistic: 35.26 on 4 and 688 DF,  p-value: 2.2e-16
√输入4:
install.packages("MASS")
library(MASS)
step "both")
√结果4:
Start:  AIC=3525.82
生理功能 ~ newincome + Q34 + newQ35 + Q36

            Df Sum of Sq    RSS    AIC
- Q36        1     312.8 110990 3525.8
                   110677 3525.8- Q34        1     733.0 111410 3528.4- newincome  1    2510.5 113187 3539.4- newQ35     1   14633.7 125310 3609.9
Step:  AIC=3525.78
生理功能 ~ newincome + Q34 + newQ35
Df Sum of Sq RSS AIC 110990 3525.8+ Q36 1 312.8 110677 3525.8- Q34 1 730.4 111720 3528.3- newincome 1 2754.7 113744 3540.8- newQ35 1 15874.9 126864 3616.4√输入5:
step$anova
√结果5:
  Stepwise Model Path
Analysis of Deviance Table

Initial Model:
生理功能 ~ newincome + Q34 + newQ35 + Q36

Final Model:
生理功能 ~ newincome + Q34 + newQ35


   Step Df Deviance Resid. Df Resid. Dev      AIC
1                         688   110676.8 3525.824
2 - Q36  1 312.8098       689   110989.6 3525.780
√输入6:
 install.packages("olsrr")
 library(olsrr)
 ols_step_best_subset(linqol)
olsrr:Tools for Building OLS Regression Models
√结果6:
 Best Subsets Regression
---------------------------------------
Model Index    Predictors
---------------------------------------
     1         newQ35
     2         newincome newQ35
     3         newincome Q34 newQ35
     4         newincome Q34 newQ35 Q36
---------------------------------------

                                                      Subsets Regression Summary
---------------------------------------------------------------------------------------------------------------------------------------
                       Adj.        Pred
Model    R-Square    R-Square    R-Square     C(p)         AIC         SBIC          SBC         MSEP        FPE        HSP       APC
---------------------------------------------------------------------------------------------------------------------------------------
  1        0.1398      0.1385      0.1348    24.1685    5513.3715    3546.6080    5526.9946    166.5088    166.5074    0.2406    0.8652
  2        0.1623      0.1599       0.155     7.4850    5496.9744    3530.3127    5515.1385    162.6173    162.6139    0.2350    0.8450
  3        0.1678      0.1641      0.1581     4.9445    5494.4287    3527.8153    5517.1338    162.0238    162.0177    0.2341    0.8419
  4        0.1701      0.1653       0.158     5.0000    5494.4728    3527.8966    5521.7190    162.0375    162.0280    0.2342    0.8420
---------------------------------------------------------------------------------------------------------------------------------------
AIC: Akaike Information Criteria
 SBIC: Sawa's Bayesian Information Criteria
 SBC: Schwarz Bayesian Criteria
 MSEP: Estimated error of prediction, assuming multivariate normality
 FPE: Final Prediction Error
 HSP: Hocking's Sp
 APC: Amemiya Prediction Criteria
√输入7:
ols_step_forward_p(linqol)
√结果7:
Variables Entered:

✔ newQ35
✔ newincome
✔ Q34
✔ Q36


Final Model Output
------------------

                         Model Summary
---------------------------------------------------------------
R                       0.412       RMSE                12.683
R-Squared               0.170       Coef. Var           15.567
Adj. R-Squared          0.165       MSE                160.867
Pred R-Squared          0.158       MAE                 10.589
---------------------------------------------------------------
 RMSE: Root Mean Square Error
 MSE: Mean Square Error
 MAE: Mean Absolute Error

                                 ANOVA
-----------------------------------------------------------------------
                  Sum of
                 Squares         DF    Mean Square      F         Sig.
-----------------------------------------------------------------------
Regression     22686.456          4       5671.614    35.256    0.0000
Residual      110676.752        688        160.867
Total         133363.208        692
-----------------------------------------------------------------------

                                   Parameter Estimates
-----------------------------------------------------------------------------------------
      model      Beta    Std. Error    Std. Beta      t        Sig       lower     upper
-----------------------------------------------------------------------------------------
(Intercept)    89.546         2.749                 32.577    0.000     84.149    94.943
     newQ35    -9.511         0.997       -0.340    -9.538    0.000    -11.469    -7.553
  newincome     2.683         0.679        0.140     3.950    0.000      1.350     4.017
        Q34     2.089         0.979        0.074     2.135    0.033      0.168     4.010
        Q36    -1.575         1.129       -0.050    -1.394    0.164     -3.792     0.642
-----------------------------------------------------------------------------------------

                             Selection Summary
----------------------------------------------------------------------------
        Variable                   Adj.
Step     Entered     R-Square    R-Square     C(p)         AIC        RMSE
----------------------------------------------------------------------------
   1    newQ35         0.1398      0.1385    24.1685    5513.3715    12.8852
   2    newincome      0.1623      0.1599     7.4850    5496.9744    12.7245
   3    Q34            0.1678      0.1641     4.9445    5494.4287    12.6920
   4    Q36            0.1701      0.1653     5.0000    5494.4728    12.6834
----------------------------------------------------------------------------
√输入8:
ols_step_backward_p(linqol)
√结果8:
Backward Elimination Method
---------------------------

Candidate Terms:

1 . newincome
2 . Q34
3 . newQ35
4 . Q36

We are eliminating variables based on p value...

Variables Removed:


No more variables satisfy the condition of p value = 0.3


Final Model Output
------------------

                         Model Summary
---------------------------------------------------------------
R                       0.412       RMSE                12.683
R-Squared               0.170       Coef. Var           15.567
Adj. R-Squared          0.165       MSE                160.867
Pred R-Squared          0.158       MAE                 10.589
---------------------------------------------------------------
 RMSE: Root Mean Square Error
 MSE: Mean Square Error
 MAE: Mean Absolute Error

                                 ANOVA
-----------------------------------------------------------------------
                  Sum of
                 Squares         DF    Mean Square      F         Sig.
-----------------------------------------------------------------------
Regression     22686.456          4       5671.614    35.256    0.0000
Residual      110676.752        688        160.867
Total         133363.208        692
-----------------------------------------------------------------------

                                   Parameter Estimates
-----------------------------------------------------------------------------------------
      model      Beta    Std. Error    Std. Beta      t        Sig       lower     upper
-----------------------------------------------------------------------------------------
(Intercept)    89.546         2.749                 32.577    0.000     84.149    94.943
  newincome     2.683         0.679        0.140     3.950    0.000      1.350     4.017
        Q34     2.089         0.979        0.074     2.135    0.033      0.168     4.010
     newQ35    -9.511         0.997       -0.340    -9.538    0.000    -11.469    -7.553
        Q36    -1.575         1.129       -0.050    -1.394    0.164     -3.792     0.642
-----------------------------------------------------------------------------------------
[1] "No variables have been removed from the model."
√输入9:
ols_step_both_p(linqol)
√结果9:
Stepwise Selection Method
---------------------------

Candidate Terms:

1. newincome
2. Q34
3. newQ35
4. Q36

We are selecting variables based on p value...

Variables Entered/Removed:

✔ newQ35
✔ newincome
✔ Q34

No more variables to be added/removed.


Final Model Output
------------------

                         Model Summary
---------------------------------------------------------------
R                       0.410       RMSE                12.692
R-Squared               0.168       Coef. Var           15.578
Adj. R-Squared          0.164       MSE                161.088
Pred R-Squared          0.158       MAE                 10.627
---------------------------------------------------------------
 RMSE: Root Mean Square Error
 MSE: Mean Square Error
 MAE: Mean Absolute Error

                                 ANOVA
-----------------------------------------------------------------------
                  Sum of
                 Squares         DF    Mean Square      F         Sig.
-----------------------------------------------------------------------
Regression     22373.647          3       7457.882    46.297    0.0000
Residual      110989.561        689        161.088
Total         133363.208        692
-----------------------------------------------------------------------

                                   Parameter Estimates
-----------------------------------------------------------------------------------------
      model      Beta    Std. Error    Std. Beta      t        Sig       lower     upper
-----------------------------------------------------------------------------------------
(Intercept)    87.732         2.423                 36.208    0.000     82.975    92.489
     newQ35    -9.754         0.983       -0.349    -9.927    0.000    -11.683    -7.825
  newincome     2.792         0.675        0.146     4.135    0.000      1.466     4.117
        Q34     2.085         0.979        0.074     2.129    0.034      0.163     4.008
-----------------------------------------------------------------------------------------

                               Stepwise Selection Summary
----------------------------------------------------------------------------------------
                      Added/                   Adj.
Step    Variable     Removed     R-Square    R-Square     C(p)         AIC        RMSE
----------------------------------------------------------------------------------------
   1     newQ35      addition       0.140       0.139    24.1680    5513.3715    12.8852
   2    newincome    addition       0.162       0.160     7.4850    5496.9744    12.7245
   3       Q34       addition       0.168       0.164     4.9450    5494.4287    12.6920
----------------------------------------------------------------------------------------
√输入10:
 library(leaps)
 leaps<-regsubsets(生理功能~newincome+ Q34 +newQ35+ Q36,data=qol1)summary(leaps)
leaps() performs an exhaustive search for the best subsets of the variables in x for predicting y in linear regression, using an efficient branch-and-bound algorithm
√结果10:
Subset selection object
Call: regsubsets.formula(生理功能 ~ newincome + Q34 + newQ35 + Q36,
    data = qol1)
4 Variables  (and intercept)
          Forced in Forced out
newincome     FALSE      FALSE
Q34           FALSE      FALSE
newQ35        FALSE      FALSE
Q36           FALSE      FALSE
1 subsets of each size up to 4
Selection Algorithm: exhaustive
         newincome Q34 newQ35 Q36
1  ( 1 ) " "       " " "*"    " "
2  ( 1 ) "*"       " " "*"    " "
3  ( 1 ) "*"       "*" "*"    " "
4  ( 1 ) "*"       "*" "*"    "*"
An asterisk indicates that a given variable is included in the corresponding model.
√输入11:
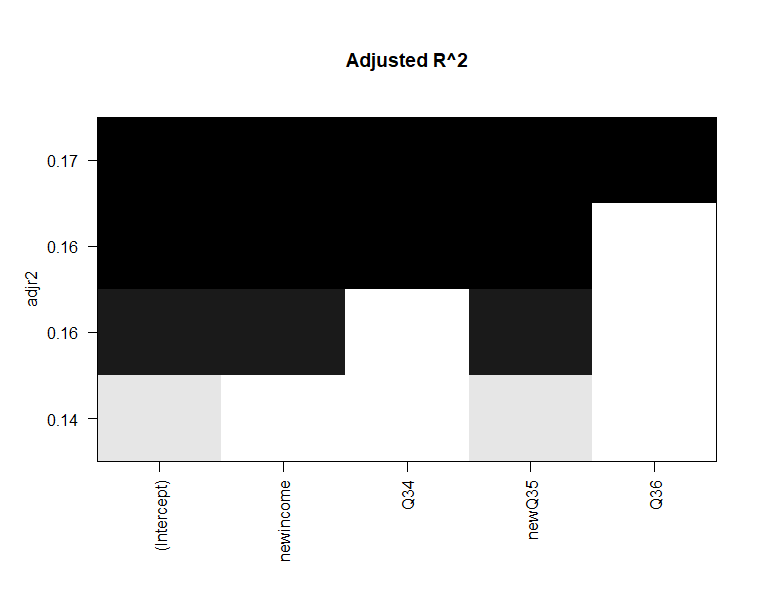
plot(leaps, scale = "adjr2", main = "Adjusted R^2")
√结果11:
√输入12:
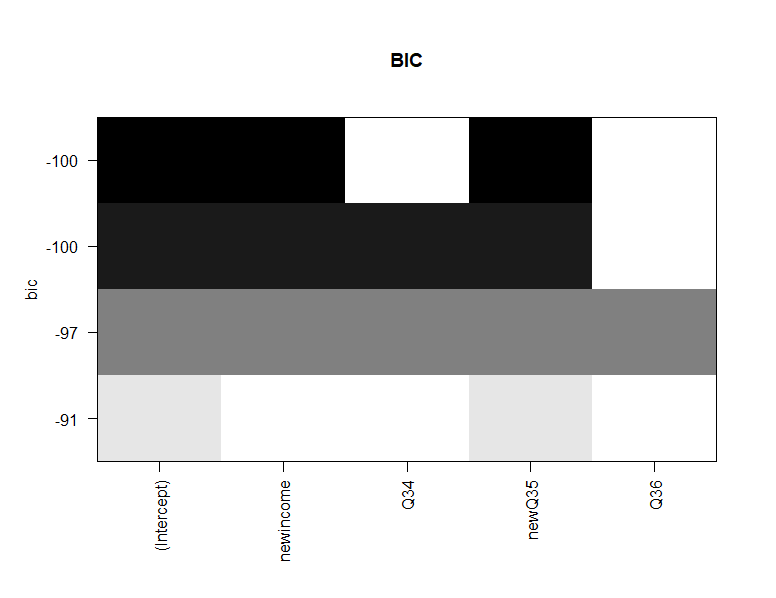
plot(leaps, scale = "bic", main = "BIC")
√结果12:
√输入13:
install.packages("car")
library(car)
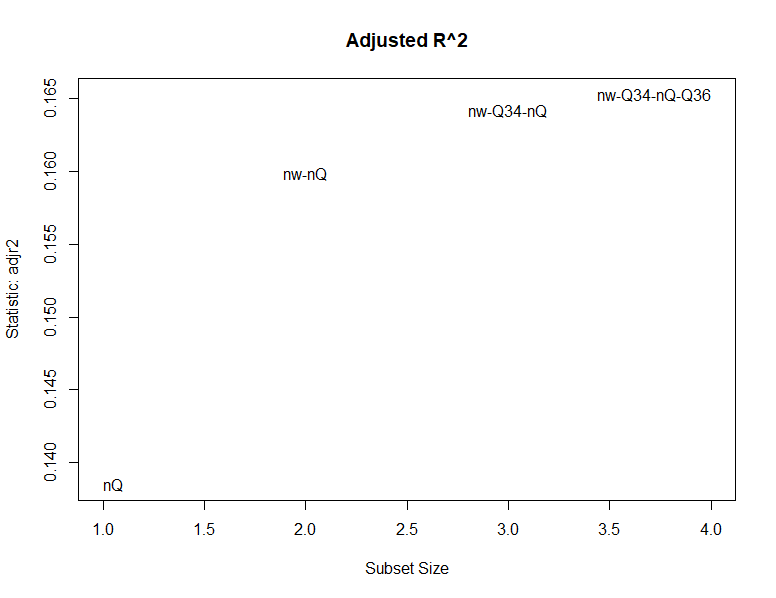
subsets(leaps, statistic="adjr2", main = "Adjusted R^2")
√结果13:


 被折叠的 条评论
为什么被折叠?
被折叠的 条评论
为什么被折叠?
 到【灌水乐园】发言


