


最近在用Taro写一个小程序,有一些数据统计,需要使用到echarts,今天就来说说它的使用方法。
首先我们需要看看需求:
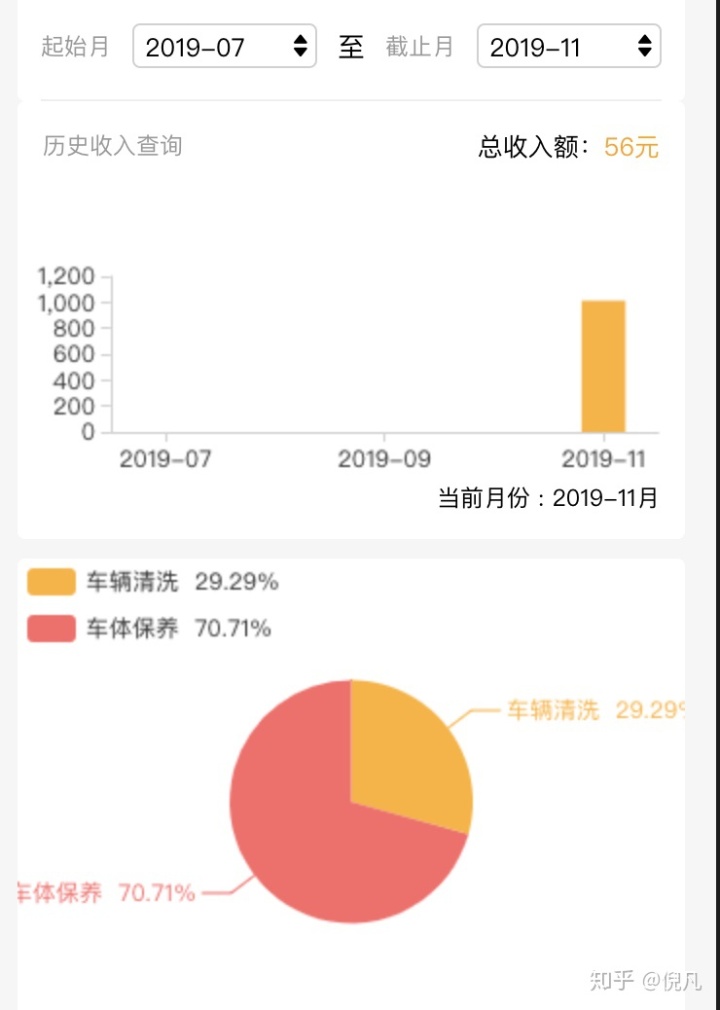
我们需要选择日期,确定显示的月份,然后会展示对应月份的柱形图,当我们点击对应月份时,下面的扇形图会展示对应的详情,所以我们会用到 echarts的点击事件。
首先我们需要下载echarts,然后引入它: import * as echarts from '../ec-canvas/echarts'
然后需要注册组件:
config = {
    usingComponents: {
      'ec-canvas': '../ec-canvas/ec-canvas'
    }
  }
然后我们在需要画图的地方定义好需要的图:
<ec-canvas
    ref={this.refHistoryHipperChart}
    canvas-id="mychart-history-hipper"
    ec={ec}
    />
<ec-canvas
    ref={this.refHistoryRollChart}
    canvas-id="mychart-history-roll"
    ec={ec}
    />
这分别对应柱形图,和扇形图。ref分别时我们需要获取对应节点的函数:
refHistoryHipperChart = (node) => (this.HistoryHipperChart = node)

  refHistoryRollChart = (node) => (this.HistoryRollChart = node)
分别存到实例中,方便使用,然后就是渲染函数:
refreshHistoryHipperChart(names, data) {
    let _this = this,
      clickTime
    this.HistoryHipperChart.init((canvas, width, height) => {
      const chart = echarts.init(canvas, null, {
        width: width,
        height: height
      })
      setChartData(chart, data)

      chart.getZr().on('click', () => {
        _this.requsetHistoryRollData(clickTime)
      })

      return chart

      function setChartData(chart, data) {
        let option = {
          color: ['#FFB228'],
          tooltip: {
            trigger: 'axis',
            position: function(point, params, dom, rect, size) {
              // 固定在顶部
              return [point[0] - 46, '10%']
            },
            axisPointer: {
              // 坐标轴指示器,坐标轴触发有效
              type: 'shadow' // 默认为直线,可选为:'line' | 'shadow'
            },
            formatter(val) {
              clickTime = val[0].name
              return `${val[0].name} : ${val[0].value}元`
            }
          },
          grid: {
            left: '3%',
            right: '4%',
            bottom: '3%',
            containLabel: true
          },
          xAxis: [
            {
              type: 'category',
              data: names,
              axisTick: {
                alignWithLabel: true
              },
              axisLabel: {
                show: true,
                textStyle: {
                  color: '#333'
                }
              },
              // 控制网格线是否显示
              splitLine: {
                show: false,
                //  改变轴线颜色
                lineStyle: {
                  // 使用深浅的间隔色
                  color: 'red'
                }
              },
              // x轴的颜色和宽度
              axisLine: {
                lineStyle: {
                  color: '#d1d1d1'
                }
              }
            }
          ],

          yAxis: [
            {
              type: 'value',
              axisLabel: {
                show: true,
                textStyle: {
                  color: '#333'
                }
              },
              // 控制网格线是否显示
              splitLine: {
                show: false,
                //  改变轴线颜色
                lineStyle: {
                  // 使用深浅的间隔色
                  color: 'red'
                }
              },
              // x轴的颜色和宽度
              axisLine: {
                lineStyle: {
                  color: '#d1d1d1'
                }
              }
            }
          ],
          series: [
            {
              label: {
                normal: {
                  rich: {}
                }
              },
              type: 'bar',
              barWidth: '40%',
              data: data
            }
          ]
        }
        chart.setOption(option)
      }
    })
  }

  refreshHistoryRollChart(data) {
    this.HistoryRollChart.init((canvas, width, height) => {
      const chart = echarts.init(canvas, null, {
        width: width,
        height: height
      })
      setChartData(chart, data)
      return chart

      function setChartData(chart, data) {
        let legendArr = []
        data.forEach((item) => {
          legendArr.push(item.name)
        })

        let option = {
          color: ['#FFB228', '#FD6767', '#32D5A1'],
          tooltip: {
            trigger: 'item',
            position: 'top',
            formatter: '{c}元'
          },
          legend: {
            orient: 'vertical',
            left: 'left',
            data: legendArr
          },
          series: [
            {
              label: {
                normal: {
                  rich: {}
                }
              },
              name: '访问来源',
              type: 'pie',
              radius: '50%',
              center: ['50%', '50%'],
              data: data,
              itemStyle: {
                emphasis: {
                  shadowBlur: 10,
                  shadowOffsetX: 0,
                  shadowColor: 'rgba(0, 0, 0, 0.5)'
                }
              }
            }
          ]
        }
        chart.setOption(option)
      }
    })
  }
这里是渲染的函数,options是我们需要的设置,然后将我们需要的样式,格式对应文档修改即可:
下面是请求函数:
requsetHistoryRollData(time = deadlineMouth) {
    http
      .request({
        url: 'mershop/incomehistorydetail',
        method: 'POST',
        isSpecial: true,
        data: {
          time: time
        },
        needMerShopToken: true
      })
      .then((res) => {
        let _this = this
        if (res.code === 1) {
          setTimeout(() => {
            _this.refreshHistoryRollChart(res.data)
          }, 17)
        }
      })
  }

  requestHistoryData() {
    const { dateSelStart, dateSelEnd } = this.state
    http
      .request({
        url: 'mershop/incomehistory',
        method: 'POST',
        data: {
          start_time: dateSelStart,
          end_time: dateSelEnd
        },
        needMerShopToken: true
      })
      .then((res) => {
        if (res.code === 1) {
          let arr = res.data.data,
            names = [],
            values = []
          arr.forEach((item) => {
            names.push(item.name)
            values.push(item.value)
          })
          setTimeout(() => {
            this.refreshHistoryHipperChart(names, values)
          }, 17)
          this.setState(() => {
            return {
              ishistorySeen: true,
              curMonth: res.data.current_time
            }
          })
        } else {
          this.setState({
            ishistorySeen: false
          })
        }
      })
  }
每次请求后,我们需要执行渲染函数,但是注意: **渲染函数一定要能获取到存入实例的节点,说我这里给它加了个定时器,如果您使用vue,可以使用$nextTick,下面重点是讲讲echarts的点击事件在哪里实现:
tooltip: {
            formatter(val) {
              clickTime = val[0].name
              return `${val[0].name} : ${val[0].value}元`
            }
          },
tooltip里有一个格式化点击显示的函数,这是一个回调,它这里算是一个点击事件但是它的bug就是点击一次,它内部会执行两次,所以这里如果直接请求,也会请求两次,不是非常好,而且他本生提供了点击函数;
chart.on('click', (parmas) => {
        _this.requsetHistoryRollData(clickTime)
      })
这个函数是echarts提供的点击回调函数,但是它只有在你点击有数据的情况下才会执行
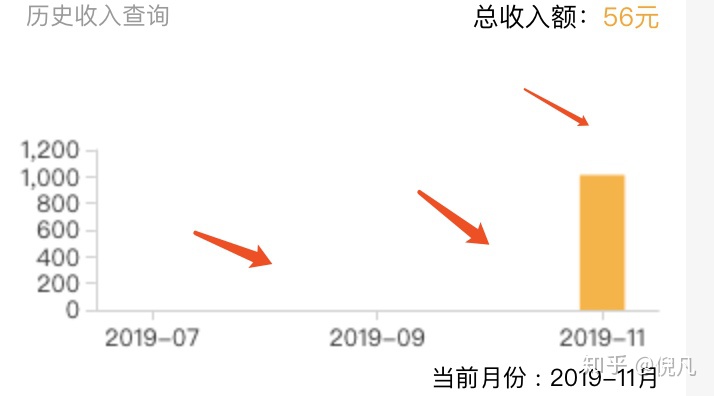
像点击这样的空白地方,这里是没有效果的,所以我们还有更好的解决方法
chart.getZr().on('click', () => {
        _this.requsetHistoryRollData(clickTime)
      })
这次,是监听的整个canvas所以我们不管点击哪里都会有反应,但是它没有返回值,所以我们要和formatter合起来用,一个存,一个取,这样就实现了点击范围放大的作用。


 1236
1236

 被折叠的 条评论
为什么被折叠?
被折叠的 条评论
为什么被折叠?
 到【灌水乐园】发言


