


I am new to r but am using it for a project in which I wish to represent 3 different y values with same x value on the same scatteplot including linear regression lines for each along with the value. I don't know if what I have done so far is the best but:
leafdata.long
ggplot(leafdata.long, aes(Percent.Area.Loss, value, color=variable))+
geom_point()+geom_smooth(method=lm, se=FALSE)+opts(title="Compiled Leaf Data")
Here's the plot that it produced:
http://imgur.com/eXNFY5d
Any help with changing the x and y labels along with the legend would be appreciated also. I'm very much lost.
解决方案
The above link seems to do this way nicer. However, since I already had this done by the time I saw the post above I figured I'd post anyways.
library(plyr)
d
r2
names(r2)
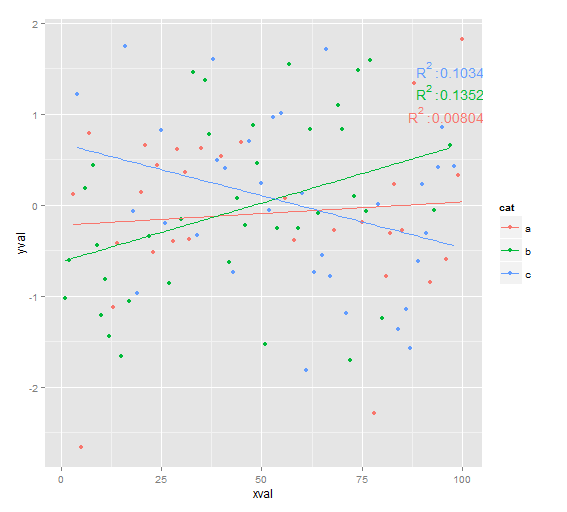
g
g
g+geom_text(data=r2,aes(color=cat, label = paste("R^2: ", r2,sep="")),parse=T,x=100,y=c(1,1.25,1.5), show_guide=F)


 被折叠的 条评论
为什么被折叠?
被折叠的 条评论
为什么被折叠?
 到【灌水乐园】发言


