


用tensorflow训练完网络后,有时想看一下graph中每个op是如何计算已经耗时,这个时候就可以用到timeline工具,就可以有针对性的进行优化了。
直接上代码,分别针对pb和tf-serving模型,只需要在sess.run的基础上加上options和run_metadata参数:
# -*- coding: UTF-8 -*-
import cv2
import tensorflow as tf
import os,time
os.environ['TF_CPP_MIN_LOG_LEVEL'] = '3'
from tensorflow.python.client import timeline

run_options = tf.RunOptions(trace_level=tf.RunOptions.FULL_TRACE)
run_metadata = tf.RunMetadata()

tf_serving_model = '/xxx/tf_serving_model/1/'

def inference_tf_serving():
    im_file = '1.jpg'
    with open(im_file, 'rb') as f:
        img_str = f.read()

        # with tf.Session(graph=tf.Graph(), config=tf.ConfigProto(log_device_placement=True)) as sess:
        with tf.Session(graph=tf.Graph()) as sess:

            tf.saved_model.loader.load(sess, [tf.saved_model.tag_constants.SERVING], tf_serving_model)
            sess.run(tf.global_variables_initializer())
            # # 查看图中的op
            # for op in sess.graph.get_operations():
            #     print(op.name, op.values())
            # # 获取张量的第二种方法

            input_images = sess.graph.get_tensor_by_name('images:0')
            boxes_tf = sess.graph.get_tensor_by_name('import/xxx:0')
            scores_tf = sess.graph.get_tensor_by_name('import_1/xxx:0')
            classes_tf = sess.graph.get_tensor_by_name('import_1/xxx:0')

            t1 = time.time()
            boxes, scores, classes = sess.run([boxes_tf, scores_tf, classes_tf], feed_dict={input_images: img_str}
                                              ,options=run_options, run_metadata=run_metadata)
            t2 = time.time()
            print('time:',t2-t1)
            # timeline
            tl = timeline.Timeline(run_metadata.step_stats)
            ctf = tl.generate_chrome_trace_format()
            with open('xxx.json', 'w') as f:
                f.write(ctf)
            print('done ... ')
    return


def load_graph(frozen_graph_filename):
    # We load the protobuf file from the disk and parse it to retrieve the
    # unserialized graph_def
    with tf.gfile.GFile(frozen_graph_filename, "rb") as f:
        graph_def = tf.GraphDef()
        graph_def.ParseFromString(f.read())
    # Then, we import the graph_def into a new Graph and returns it
    with tf.Graph().as_default() as graph:
        # The name var will prefix every op/nodes in your graph
        # Since we load everything in a new graph, this is not needed
        tf.import_graph_def(graph_def)
    return graph

def inference_pb():
    model_path = 'xxx.pb'
    graph = load_graph(model_path)
    im_file = '1.jpg'
    with open(im_file, 'rb') as f:
        img_str = f.read()

        # with tf.Session(graph=tf.Graph(), config=tf.ConfigProto(log_device_placement=True)) as sess:
        with tf.Session(graph=graph) as sess:

            # # 查看图中的op
            # for op in sess.graph.get_operations():
            #     print(op.name, op.values())
            # # 获取张量的第二种方法

            input_images = sess.graph.get_tensor_by_name('import/tf_image_string:0')
            boxes_tf = sess.graph.get_tensor_by_name('import/xxx:0')
            scores_tf = sess.graph.get_tensor_by_name('import/xxx:0')
            classes_tf = sess.graph.get_tensor_by_name('import/xxx:0')

            t1 = time.time()
            boxes,scores, classes = sess.run([boxes_tf,scores_tf, classes_tf], feed_dict={input_images: img_str}
                                            ,options=run_options, run_metadata=run_metadata)
            t2 = time.time()
            print('time:',t2-t1)
            # timeline
            tl = timeline.Timeline(run_metadata.step_stats)
            ctf = tl.generate_chrome_trace_format()
            with open('xxx.json', 'w') as f:
                f.write(ctf)
            print('done ... ')
    return

if __name__ == '__main__':
    # inference_tf_serving()
    inference_pb()
打开chrome, 进到这个页面: chrome://tracing, 然后load刚刚生成的JSON文件就可以了。
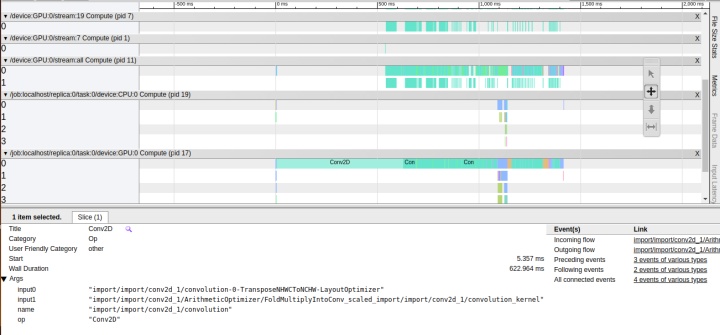
可以看到,NHWCToNCHW这个op就耗时一半了,点击相应的op就能看到该op的执行过程和耗时等。使用wsad键可进行放大缩小等操作,从左到右就是整个graph的执行顺序。
参考:
tensorflow性能调优实践
https://blog.csdn.net/mtj66/article/details/79967241


 348
348


 被折叠的 条评论
为什么被折叠?
被折叠的 条评论
为什么被折叠?
 到【灌水乐园】发言


