


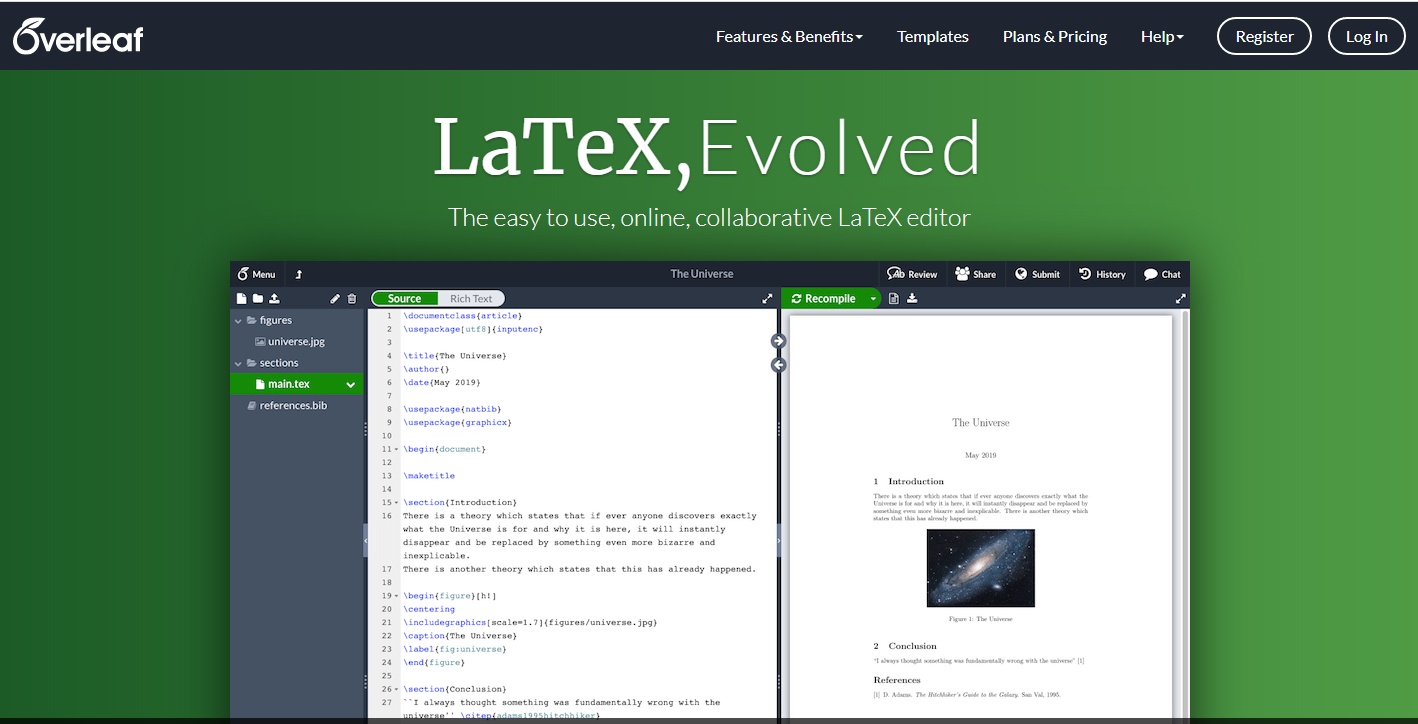
转载 https://blog.csdn.net/gentleman_qin/article/details/79963396
一、文本/排版:
1、定版型:
documentclass [A] {B}
A:①字体10pt(默认值),11pt,12pt,例子:documentclass[11pt]{article};
②纸张大小有几个,最常见的就是a4paper,letterpaper(默认值),例子:documentclass[a4paper]{article};
③单双面oneside(article,report默认值),twoside(book默认值),例子:documentclass[twoside]{article};
④组合实现:documentclass[a4paper,twoside,11pt]{article}顺序随意;
B:①常用:Article(英文科研文章)/report/book;②ctex文档类(支持中文):ctexart/ctexrep/ctexbook;
2、加标题/日期/作者:
在begin{document}之前输入:title{标题}author{作者}date{日期}; %输入空格即为空
在begin{document}之前输入:maketitle ; %输入后,前三者才生效
3、修改页边距:
Usepackage{ geometry };Gemometry(left=2.54cm,right=2.54cm,top=3.09cm,bottom=3.09cm); %A4版上下为 2.54厘米;左右为 3.09厘米
4、文本加粗: textbf{ };
5、左对齐: noindent ; %本行左对齐不缩进
6、换行: newline或者 ;
7、空格: 单格quad 双格quad;
8、居中/左对齐/右对齐:
①部分居中:
centering; %小范围内(比如表格)居中后面部分内容
②全部居中/左对齐/右对齐:
begin{center/flushleft/flushright}要居中的内容end{center/flushleft/flushright };
9、首行缩进:
usepackage{indentfirst};
setlength{parindent}{2em}; %缩进的距离(2em 表示缩进 2 个字符位置)
indent %首行缩进
noindent. 不首行缩进
二、公式编辑(2-8均是在1的条件下使用):
1、(1)行中插入公式: $公式$,例子:$frac{L^4}{2}+frac{L^3}{6}-frac{4L}{3}$;
(2)行间插入公式(自动带上公式标号),begin{equation}公式end{equation},
例子:begin{equation}frac{L^4}{2}+frac{L^3}{6}-frac{4L}{3}end{equation};
2、粗体(向量或矩阵):用mathbf{}(有时textbf{}仍然有用);
3、上标:字母^上标;下标:字母_下标;
4、括号:left(括号内容right) 或者直接输入();
5、分数:frac{分子}{分母};
6、求和:sum_{下标}^{上标};
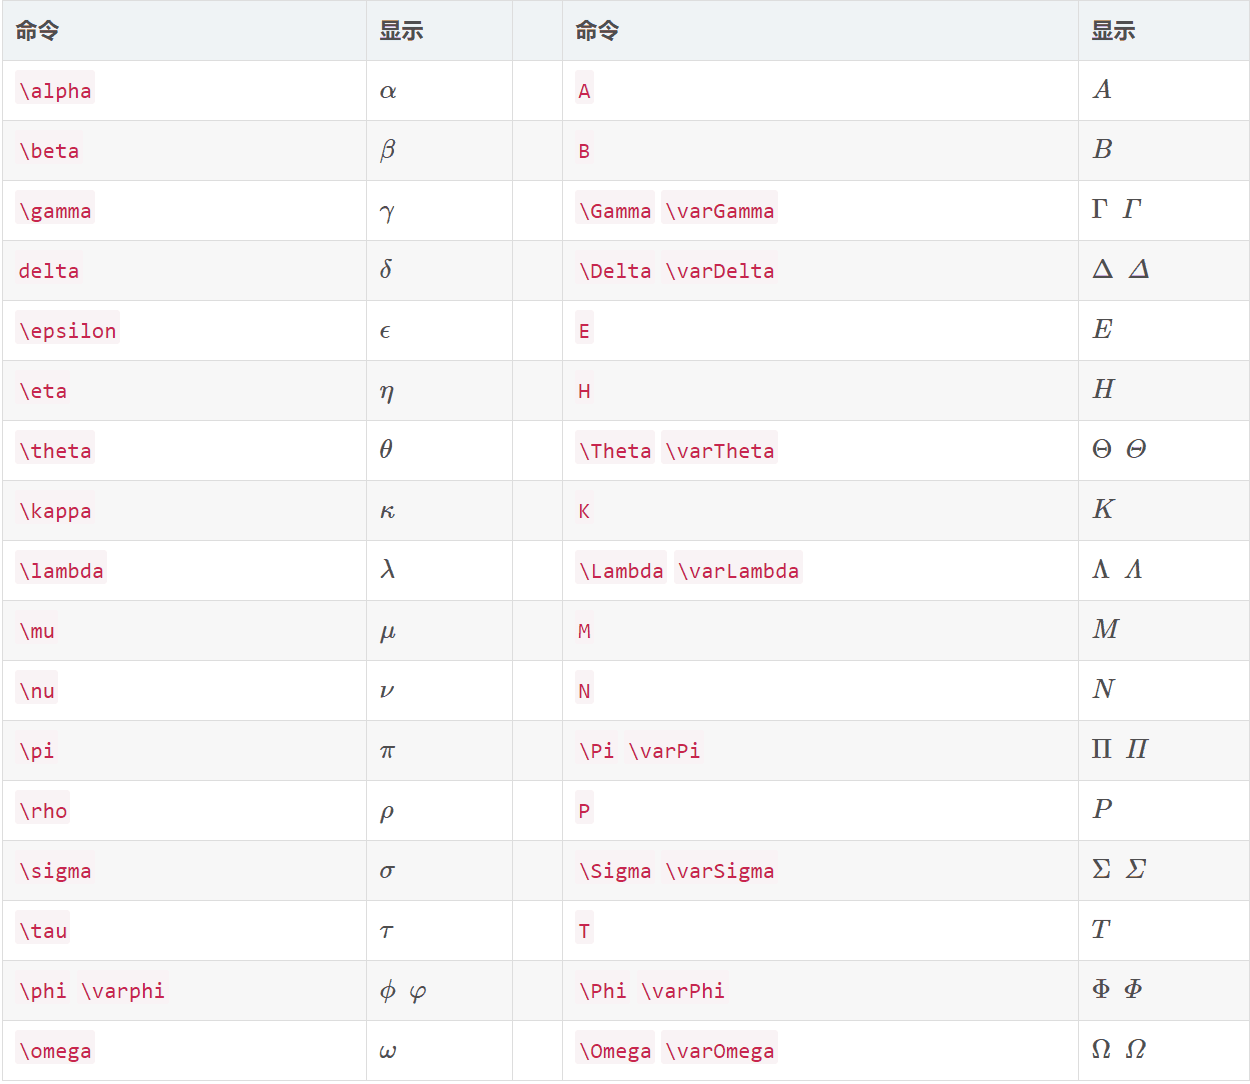
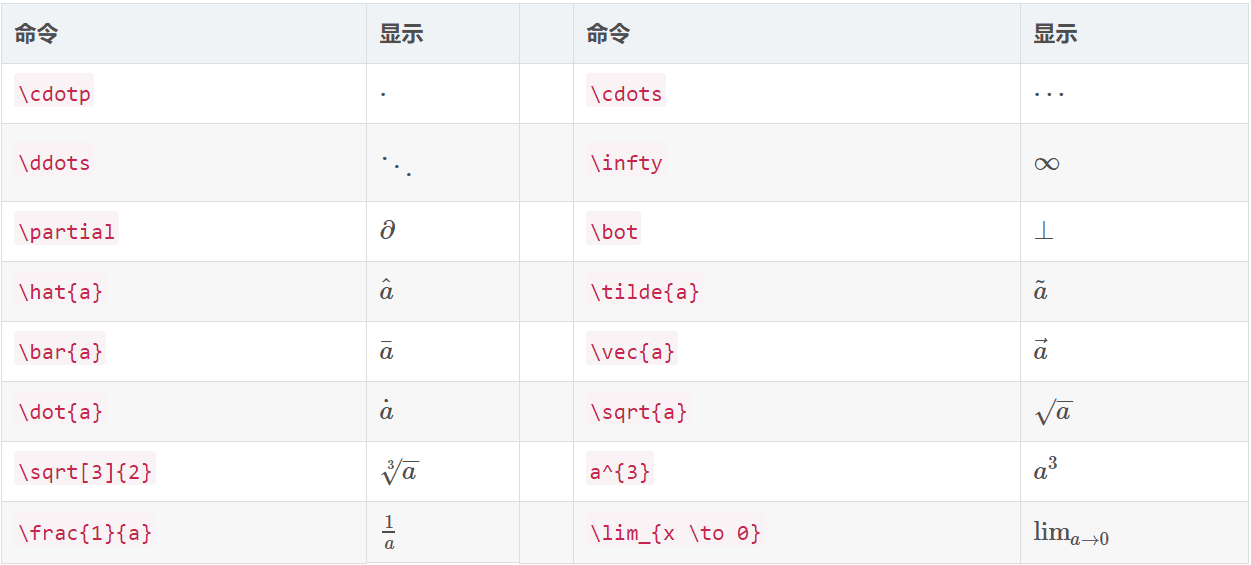
7、符号(求余符号为%):
(1)希腊字母:
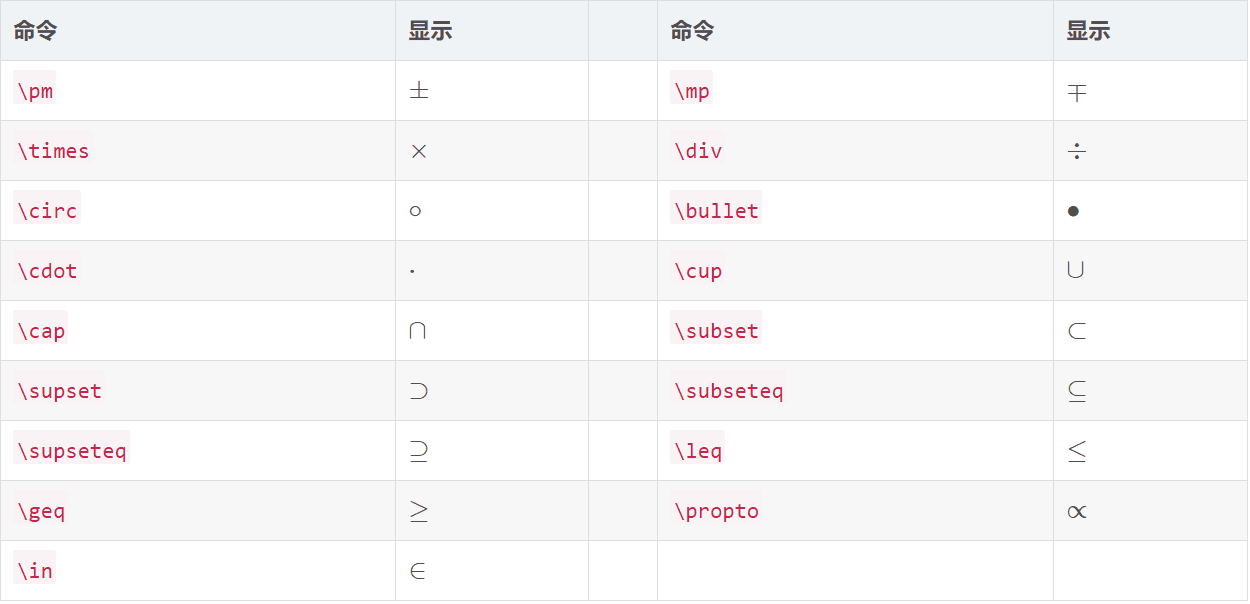
(2)基本运算符:
(3)积分运算符:
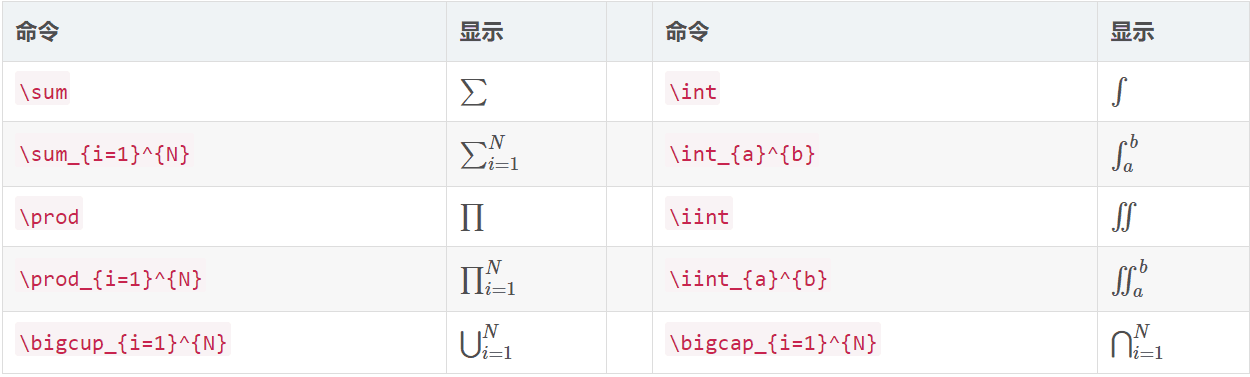
(3)其他运算符:
三、插入图片:
1、首先将需要插入的图片上传到当前编辑文件的云端库中;
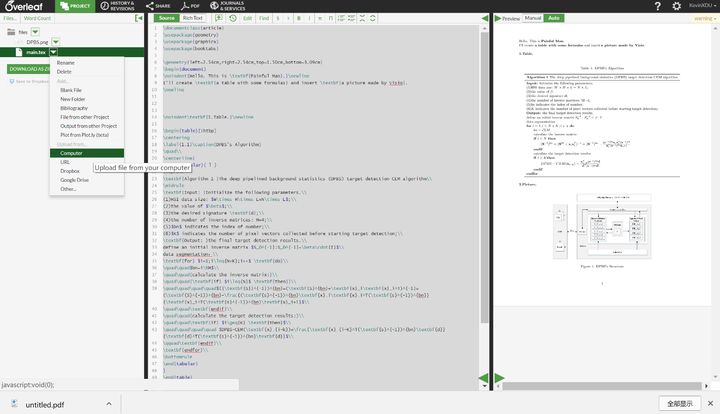

2、其次开始编程:
usepackage{graphicx} %加入头文件
begin{figure}[!htpb]/[H] %[htbp]是自动排版;[H]固定位置
centering %图片居中
includegraphics[scale=0.3]/[width=4.5in]{DPBS.png} %设置大小和名称
caption{DPBS}label{1} %图片名称和图片标号
end{figure} %结束
其中,{figure}的可选参数[!htbp]:
h代表here,将表格排在当前文字位置 ;t表示将表格放在下一页的top (页首);p表示p-page-of-its-own;b表示将表格放在当前页的 bottom(底部);!表示忽略美观因素,尽可能按照参数指定的方式来处理图片浮动位置;
四、插入表格:
1、粗线(表格的第一根线和最后一根线比表格中的横线更粗一些):
usepackage{booktabs}
toprule %第一根线
midrule %中间的线
bottomrule %最后一根线
2、调整位置:
begin{table}[!htbp]
end{table}
其中,{table}有若干可选参数[!htbp]
h代表here,将表格排在当前文字位置 ;t表示将表格放在下一页的 top (页首) ;p表示p-page-of-its-own;b表示将表格放在当前页的 bottom (底部) ;!表示忽略美观因素,尽可能按照参数指定的方式来处理表格浮动位置;
3、居中:
长度不长时centering
长度过长时centerline{} %把tabular的所有内容放进去
4、制表:
begin{tabular}{|l |c | r |} %“|”表示竖线,“l/c/r”表示格内居左/中/右,
A & B & C %“&”分隔不同列内的内容,“”表示换行
E & F & G
end{tabular}
5、标签和名称:label{label}caption{name}
6、普通线:hline或cline{2-5} %后者可以画如下图这种表格:

7、行高:
renewcommandarraystretch{2} %表格行高设置为默认的2倍
五、参考文献:
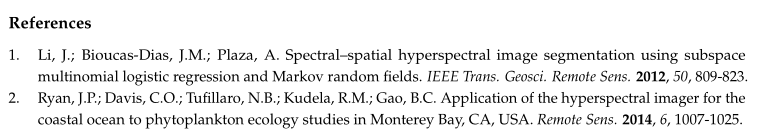
1、格式:
(1)期刊:作者名.题目.期刊(缩写,斜体)年份(加粗),卷(斜体),页码.
(2)会议:作者名.题目.会议名称(不缩写,斜体),年份(不加粗);pp. 页码.
2、函数:
begin{thebibliography}{}
bibitem{ref label}
内容 %{em要斜体的内容} {bf要加粗的内容}
end{thebibliography}
3、例子:
(1)效果图:
(2)代码:
begin{thebibliography}{}

     bibitem{ref 1 }
       Li, J.; Bioucas-Dias, J.M.; Plaza, A. Spectral–spatial hyperspectral image segmentation using subspace multinomial  logistic regression and Markov random fields. {em IEEE Trans. Geosci. Remote Sens.} {bf 2012}, {em 50}, 809-823.
     bibitem{ref 2 }
       Li, J.; Bioucas-Dias, J.M.; Plaza, A. Spectral–spatial hyperspectral image segmentation using subspace multinomial  logistic regression and Markov random fields. {em IEEE Trans. Geosci. Remote Sens.} {bf 2012}, {em 50}, 809-823.

end{thebibliography}六、引用:(label是为了方便之后直接引用):
1、参考文献加label:在命令bibitem写{ref A }
引用:cite{ref A }
2、表格/图片加label:label{ A }
引用:???
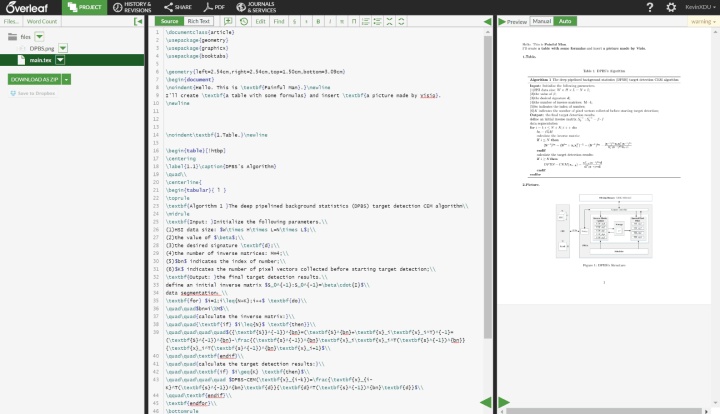
七、笔者的实例:
1、效果图:
2、代码:
documentclass{article} %英文科研文献常用类型
usepackage{geometry} %更改页边距所需
usepackage{graphicx} %插入图片所需
usepackage{booktabs} %表格线条加粗所需
geometry{left=2.54cm,right=2.54cm,top=1.0cm,bottom=1.0cm} %更改页边距
begin{document} %开始正文
I'll create textbf{a table with some formulas} and insert textbf{a picture made by Visio}.
newlinenewline %换行
noindenttextbf{1.Table.}newline %加粗左对齐显示标题
begin{table}[!htbp] %开始制表
label{1.1}caption{DPBS's Algorithm} %加标签和名称
%换行
centerline{ %表格居中开始
begin{tabular}{ l } %构造只有一列的左对齐的表格
toprule %第一条粗线
textbf{Algorithm 1 }The deep pipelined background statistics (DPBS) target detection CEM algorithm %第一行标题
midrule %中间普通粗细的线
textbf{Input: }Initialize the following parameters. %以下为第二条线和第三条线之间的内容
(1)HSI data size: $Wtimes Htimes L=Ntimes L$;
(2)the value of $beta$;
(3)the desired signature textbf{d};
(4)the number of inverse matrices: M=4;
(5)$bn$ indicates the index of number;
(6)$K$ indicates the number of pixel vectors collected before starting target detection;
textbf{Output: }the final target detection results.
define an initial inverse matrix $S_0^{-1}:S_0^{-1}=betacdot{I}$
data segmentation:
textbf{for} $i=1;ileq{N+K};i++$ textbf{do}
quadquad$bn=i%M$
quadquad{calculate the inverse matrix:}
quadquad{textbf{if} $ileq{N}$ textbf{then}}
quadquadquadquad$({textbf{S}}^{-1})^{bn}=(textbf{S}^{bn}+textbf{x}_itextbf{x}_i^T)^{-1}=(textbf{S}^{-1})^{bn}-frac{(textbf{s}^{-1})^{bn}textbf{x}_itextbf{x}_i^T(textbf{s}^{-1})^{bn}}{textbf{x}_i^T(textbf{s}^{-1})^{bn}textbf{x}_i+1}$
quadquadtextbf{endif}
quadquad{calculate the target detection results:}
quadquadtextbf{if} $igeq{K} textbf{then}$
quadquadquadquad $DPBS-CEM(textbf{x}_{i-k})=frac{textbf{x}_{i-K}^T(textbf{s}^{-1})^{bn}textbf{d}}{textbf{d}^T(textbf{s}^{-1})^{bn}textbf{d}}$
qquadtextbf{endif}
textbf{endfor}
bottomrule %最后一条粗线
end{tabular} %构造表格结束
} %表格居中结束
end{table} %制表结束
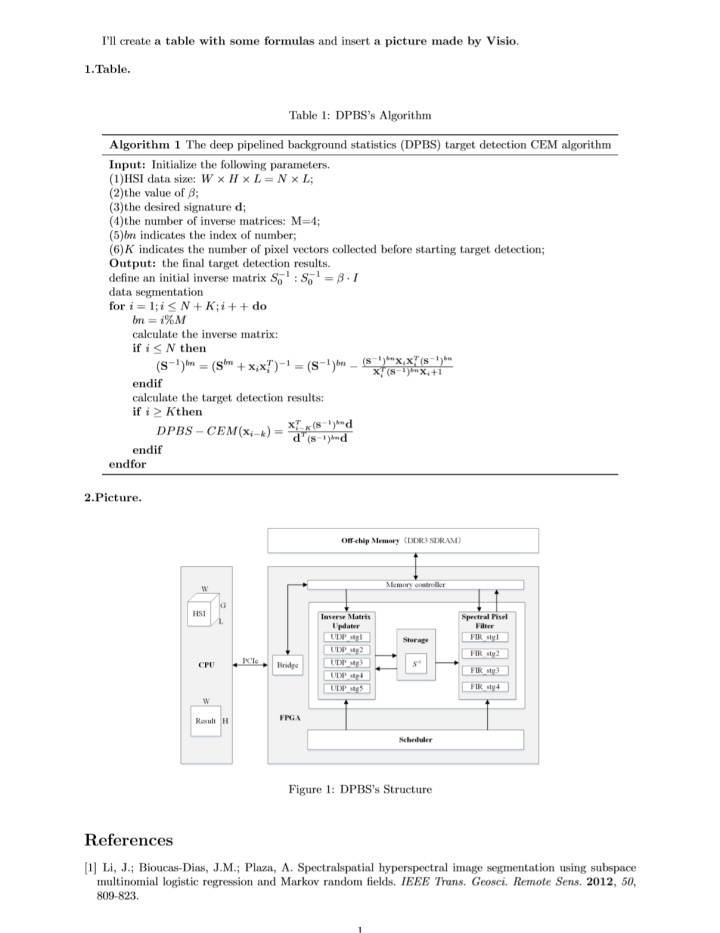
noindenttextbf{2.Picture.}newline %加粗左对齐显示标题
begin{figure}[!htbp] %开始插图
centering %图片居中
includegraphics[scale=0.55]{DPBS.png} %确定图片大小/位置
caption{DPBS's Structure}label{1.1} %加名称和标签
end{figure} %结束插图
begin{thebibliography}{} %开始编辑参考文献
bibitem{ref1.1} %加标签
Li, J.; Bioucas-Dias,J.M.; Plaza, A. Spectral–spatial hyperspectral image segmentation usingsubspace multinomial logistic regression and Markov random fields. {em IEEETrans. Geosci. Remote Sens.} {bf 2012}, {em 50}, 809-823.
end{thebibliography} %结束编辑参考文献
end{document} %结束正文原文链接:LaTeX基本命令使用教程(清晰实例)(Overleaf平台)(论文排版)_人工智能_星智云图Startimagine-CSDN博客


 2万+
2万+


 被折叠的 条评论
为什么被折叠?
被折叠的 条评论
为什么被折叠?
 到【灌水乐园】发言


