


你的浏览器不支持canvas,请升级浏览器
(function(){
var canvas = document.querySelector( '#cavsElem' );
var ctx = canvas.getContext( '2d' );
canvas.width = 600;
canvas.height = 600;
canvas.style.border = "1px solid #000";
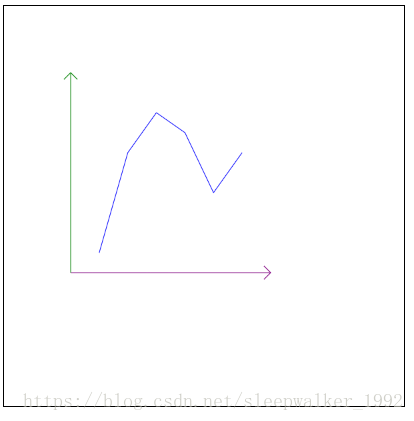
//原点坐标(100,400)
var x0=100,y0=400;
var arrowWith = 10;
//绘制x轴
ctx.beginPath();
ctx.moveTo(x0, y0);
ctx.lineTo( 400,400);
ctx.lineTo( 400 - arrowWith, 400 - arrowWith);
ctx.moveTo(400,400);
ctx.lineTo( 400 - arrowWith, 400 + arrowWith);
ctx.strokeStyle = 'purple';
ctx.stroke();
//绘制y轴
ctx.beginPath();
ctx.moveTo(x0, y0);
ctx.lineTo(100,100);
ctx.lineTo(100 - arrowWith, 100 + arrowWith);
ctx.moveTo(100,100);
ctx.lineTo(100 + arrowWith, 100 + arrowWith);
ctx.strokeStyle = 'green';
ctx.stroke();
//绘制 点的坐标
var data = [.1,.6,.8,.7, .4, .6];
var maxHeight = 300;
var maxWidth = 300;
//每个点之间的距离
var widthSpace = maxWidth / (data.length+1);
ctx.beginPath();
for( var i = 1; i <= data.length; i++ ) {
var x= x0 + i * widthSpace;
var y= y0 - data[i-1] * maxHeight;
ctx.lineTo(x,y);
}
ctx.strokeStyle = 'blue';
ctx.stroke();
})();
效果:
本文来源于网络:查看 >https://blog.csdn.net/sleepwalker_1992/article/details/80596841


 4576
4576


 被折叠的 条评论
为什么被折叠?
被折叠的 条评论
为什么被折叠?
 到【灌水乐园】发言


