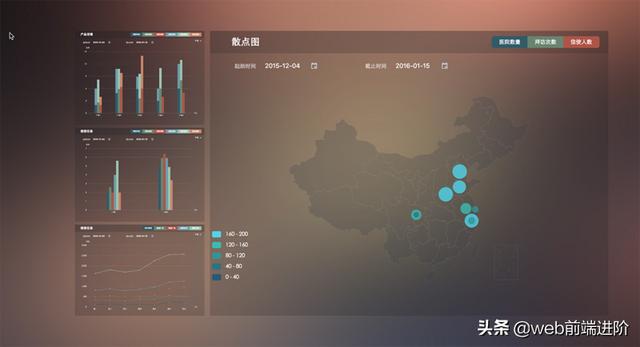
今天给大家分享一款超不错的Vue可视化图表数据大屏Dashboard。
![981a4f89e34511d41b989c7c40065798.png](https://img-blog.csdnimg.cn/img_convert/981a4f89e34511d41b989c7c40065798.png)
基于Vue+Echarts+ElementUI构建的数据图表可视化大屏,star高达1.5K+。包含柱状图、折线图、热力图、预览面板等功能。
![5795ad4ab3519cc191b58ccdf82c5e20.gif](https://img-blog.csdnimg.cn/img_convert/5795ad4ab3519cc191b58ccdf82c5e20.gif)
技术栈
- 技术框架:vue2.x+vuex+vue-router
- UI组件库:element-ui 饿了么vue2桌面组件库
- 图表组件:echarts ^3.3.2
- 其它技术:Webpack+ES6+Babel+Stylus
![6dfbdc2d546146b65f17aa780cce52e2.png](https://img-blog.csdnimg.cn/img_convert/6dfbdc2d546146b65f17aa780cce52e2.png)
快速安装
# 克隆项目git clone https://github.com/SimonZhangITer/DataVisualization.git# 进入目录cd DataVisualization# 安装依赖npm install# 开启服务npm run dev
大家可以在此基础上拓展一些新颖的项目,比如下面这些可视化系统平台。
![f6fc1aef5319494d50aa20caf1df7d5e.png](https://img-blog.csdnimg.cn/img_convert/f6fc1aef5319494d50aa20caf1df7d5e.png)
智慧农业系统
![f4d80f8355b6efd703c4aacb0530aa42.png](https://img-blog.csdnimg.cn/img_convert/f4d80f8355b6efd703c4aacb0530aa42.png)
智慧农业系统
![5e46cbe746f2440bdaf93560f780476e.png](https://img-blog.csdnimg.cn/img_convert/5e46cbe746f2440bdaf93560f780476e.png)
疫情可视化平台
![84bc044e8517894827f3f90c4af50094.png](https://img-blog.csdnimg.cn/img_convert/84bc044e8517894827f3f90c4af50094.png)
交通安全平台
![042e0d38b95637482987e98235fad5e4.png](https://img-blog.csdnimg.cn/img_convert/042e0d38b95637482987e98235fad5e4.png)
教务管理系统
![88798c828818063d15868c0626ca4fc6.png](https://img-blog.csdnimg.cn/img_convert/88798c828818063d15868c0626ca4fc6.png)
政务系统平台
将数据通过图表展现出来,让你的可视化平台充分展现数据魅力、凸显数据价值、演绎视觉盛宴。
可视化平台在电商、公共交通、教育、政务、卫生医疗等领域均有应用前景。
最后附上项目地址链接。
# 演示地址https://simonzhangiter.github.io/DataVisualization# 仓库地址https://github.com/SimonZhangITer/DataVisualization
Okay,今天就分享到这里。如果有兴趣的话可以去看下,希望对大家有所帮助!