


配置说明
本次使用的ip分别为17到21服务器,还有52服务器,均已配置jdk,使用root账号,并且关闭了防火墙。
其中控制台为21,安装的节点为17,18,21三台服务器。19和20服务器用来安装 Prometheus Exporter,20安装了grafana,52服务器安装Prometheus 。
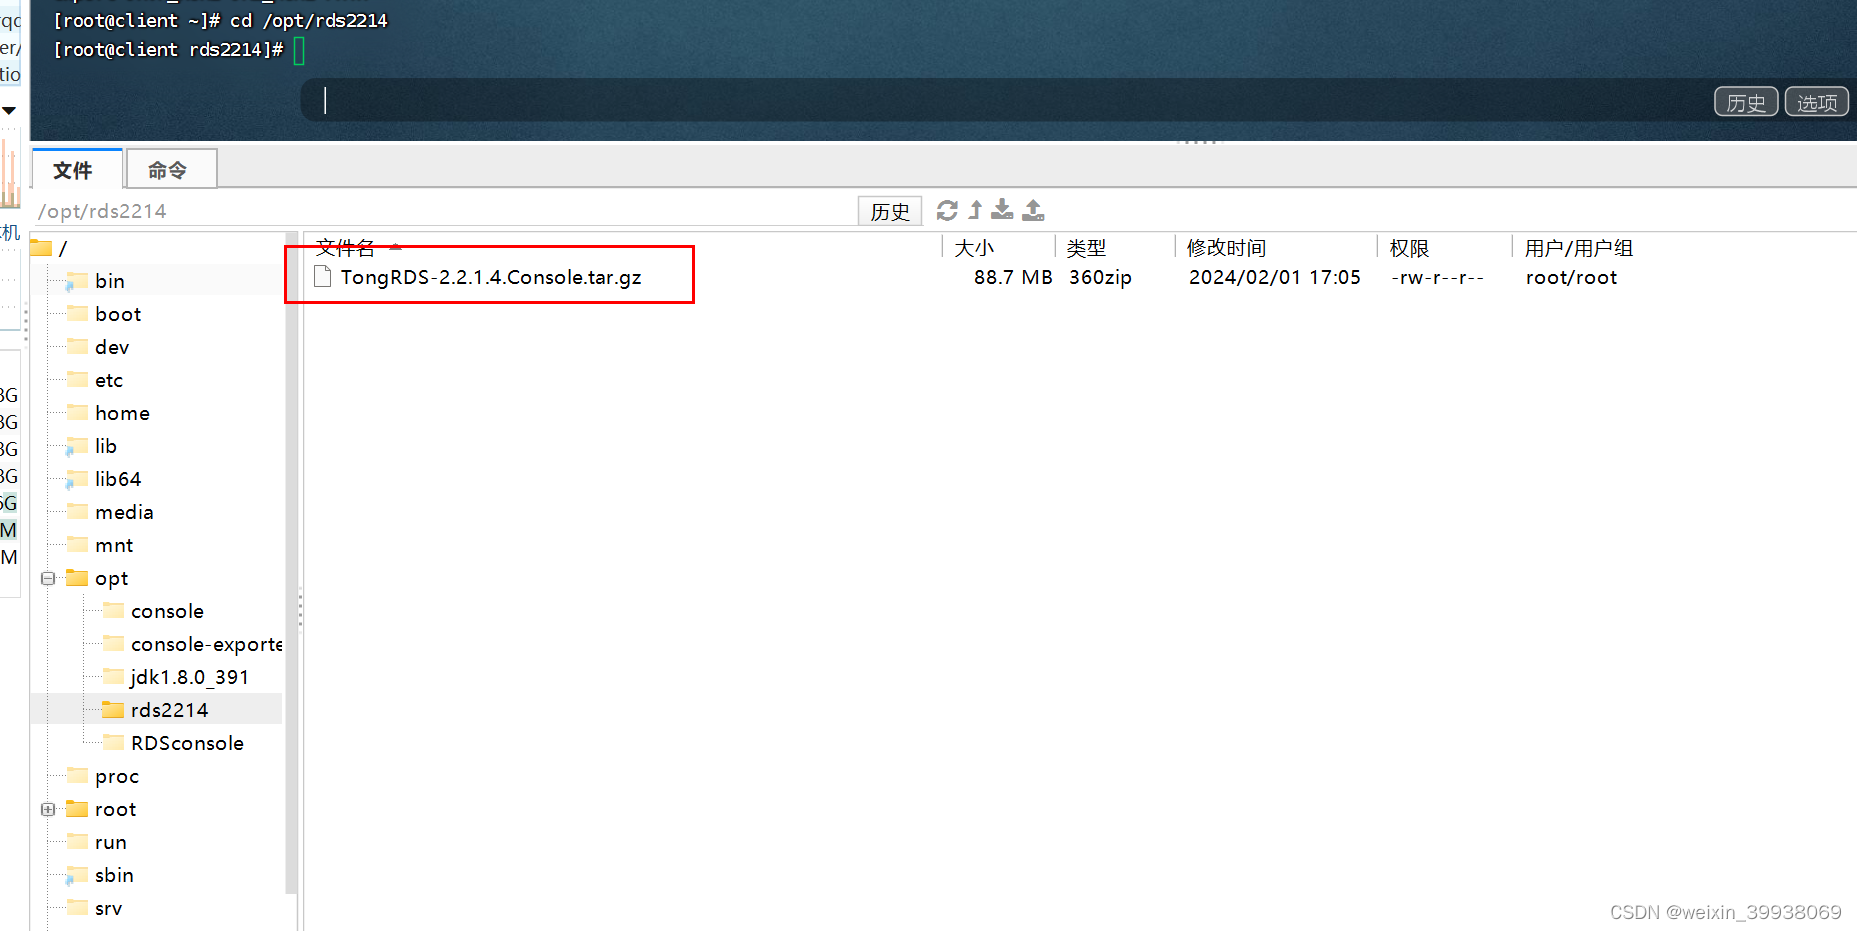
解压和部署RDS控制台
首先解压对应控制台安装包:
tar -vxf TongRDS-2.2.1.4.Console.tar.gz
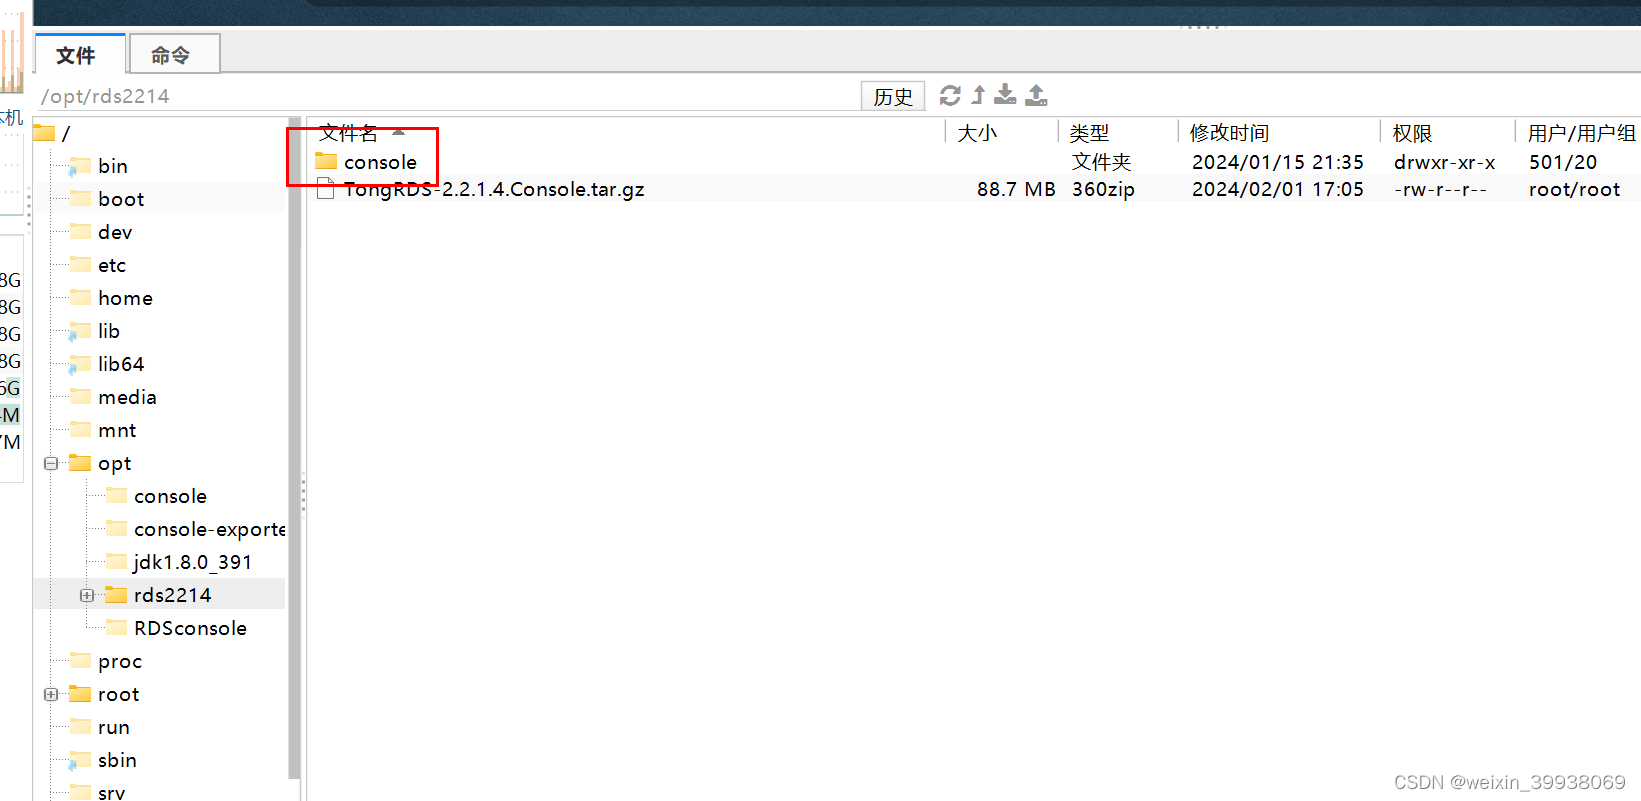
解压后到console的bin目录,执行以下脚本:
./console.sh start
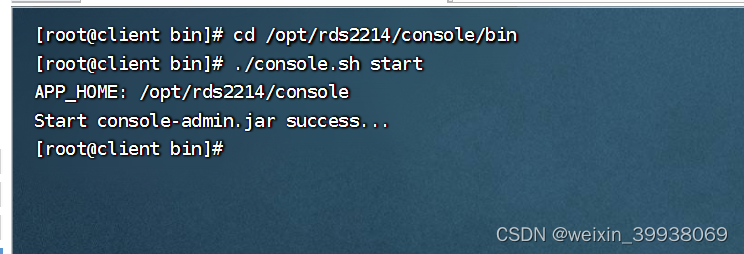
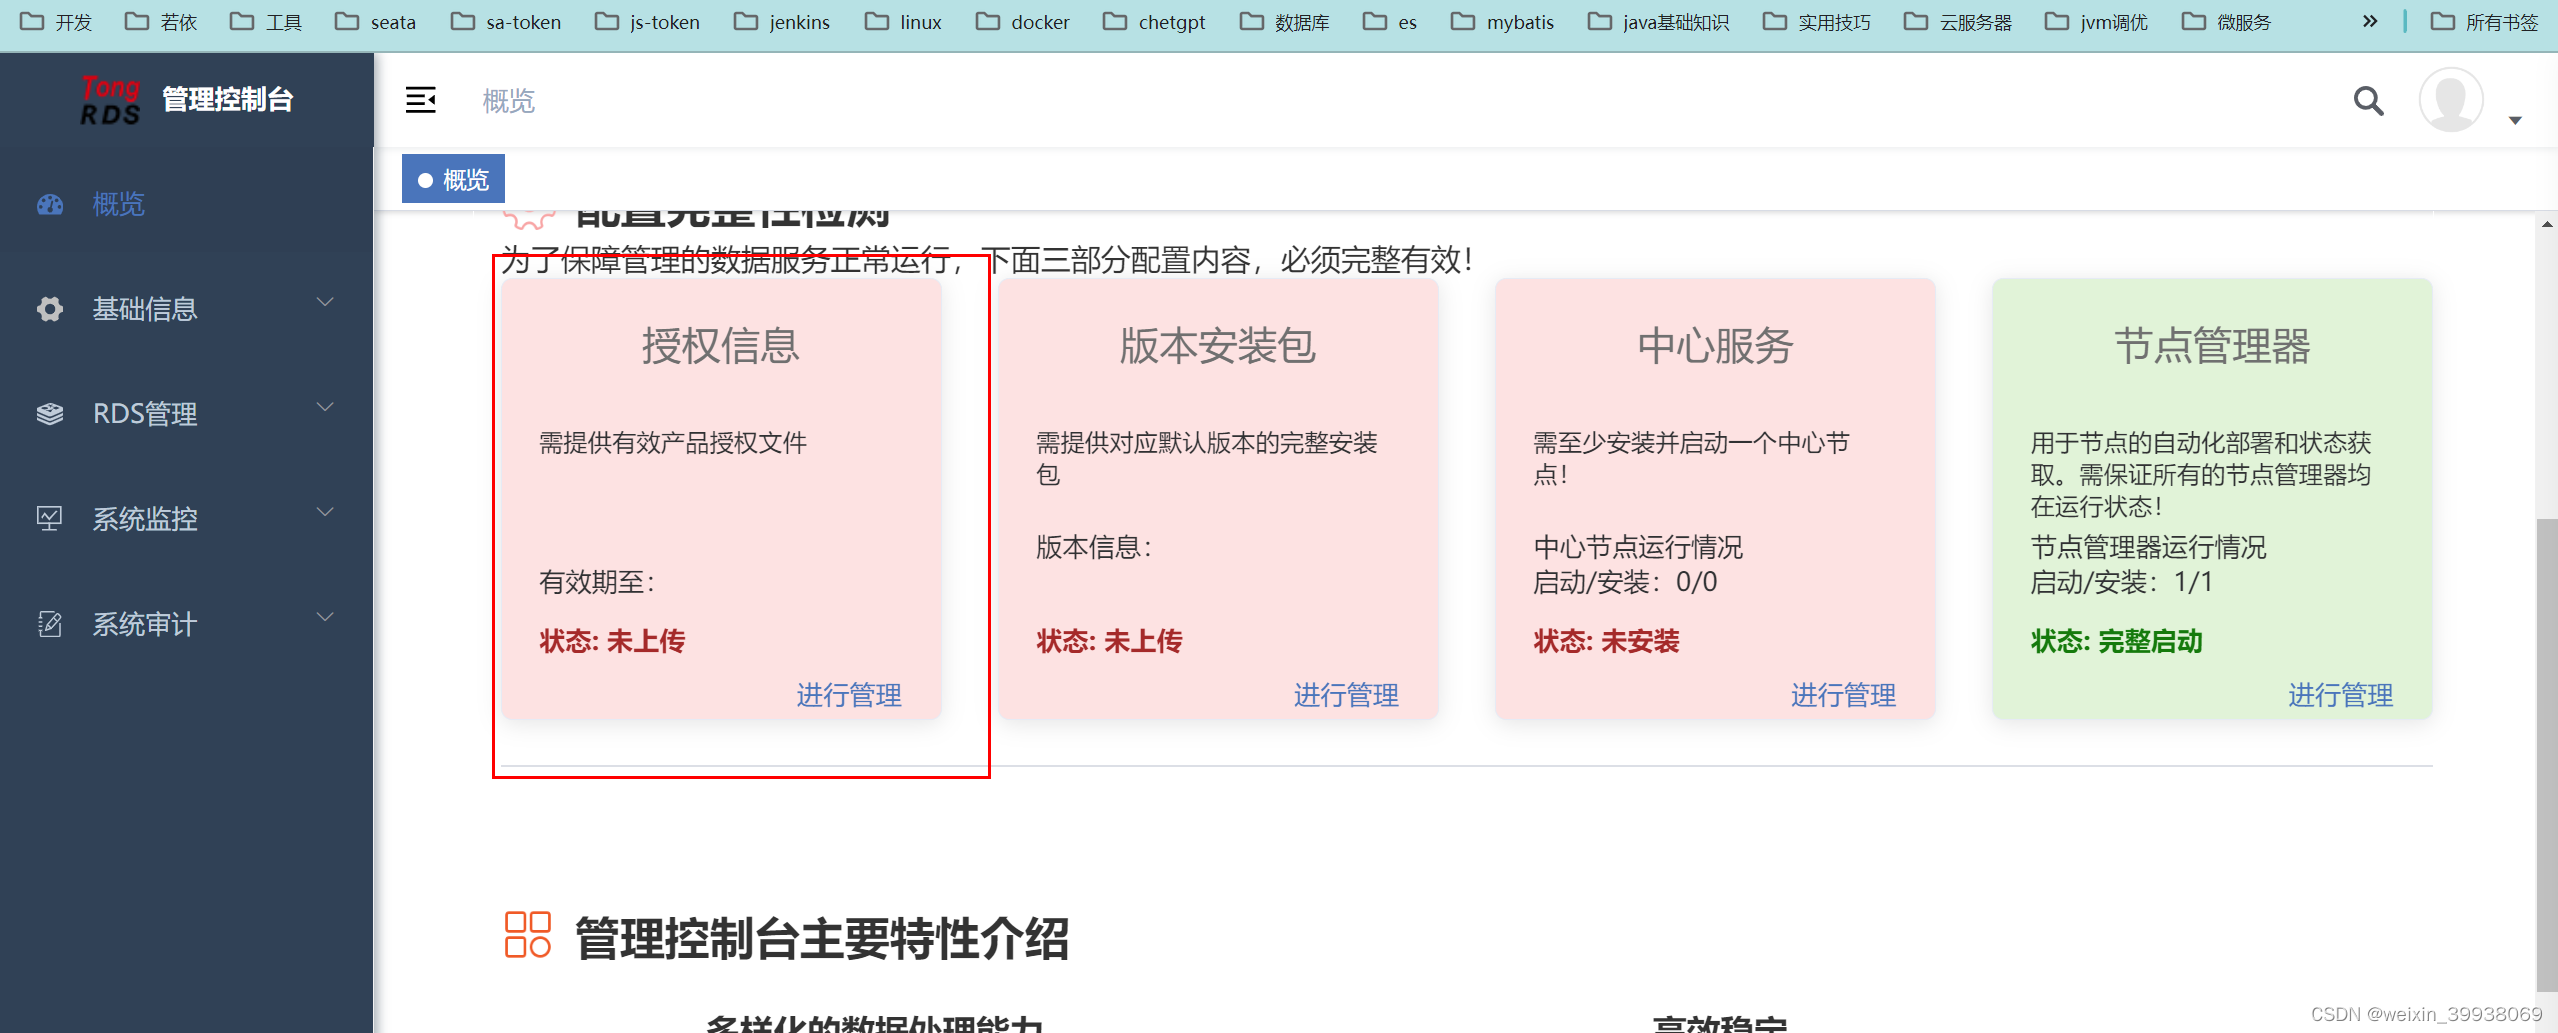
之后访问服务器ip:8083,账号admin,密码admin123
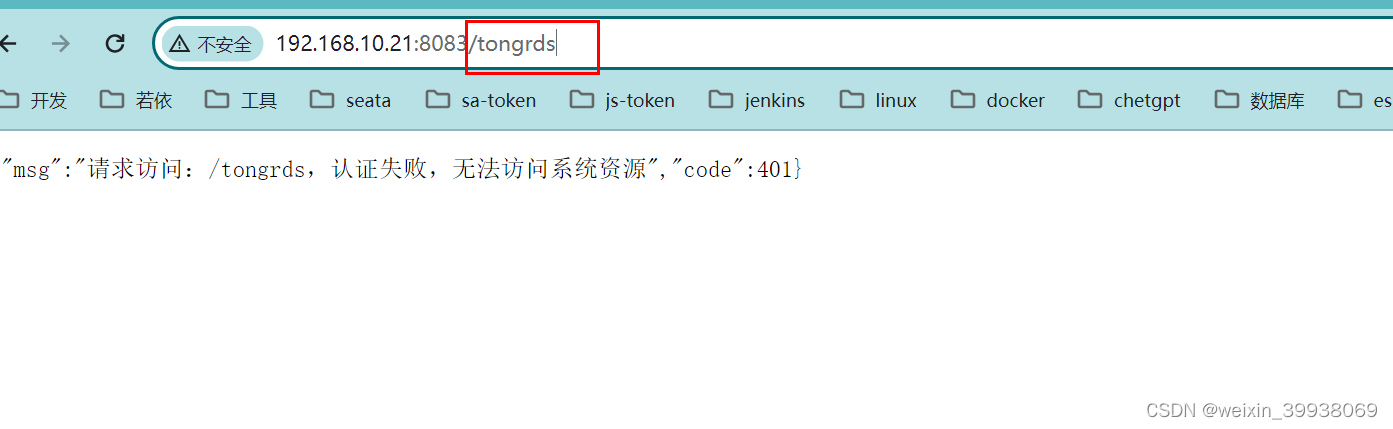
注意:
2212版本和2214版本的区分在于tongrds这个后缀,不要输入tongrds了
首次进入需要修改密码,修改密码重新登录后,上传授权文件:
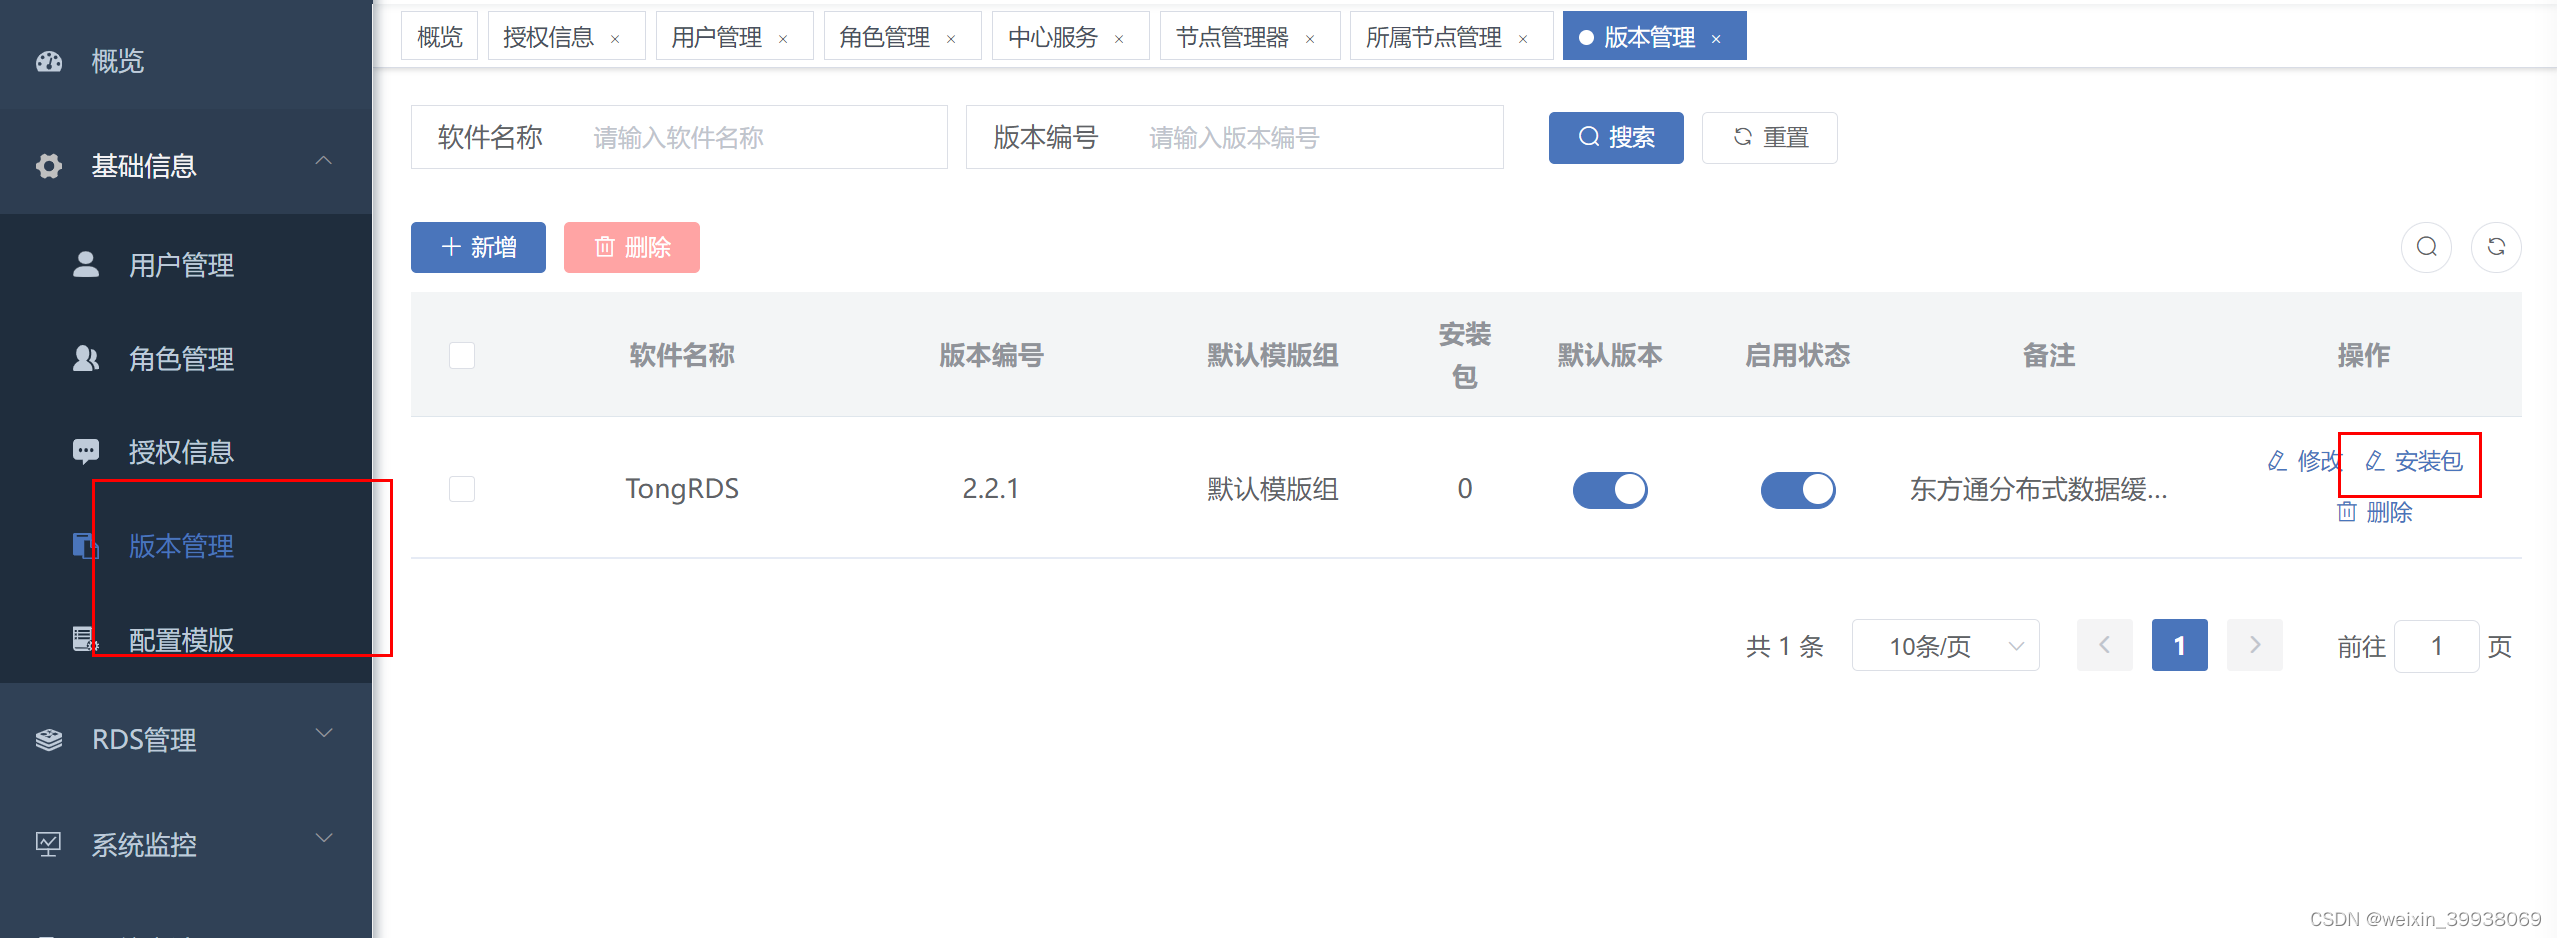
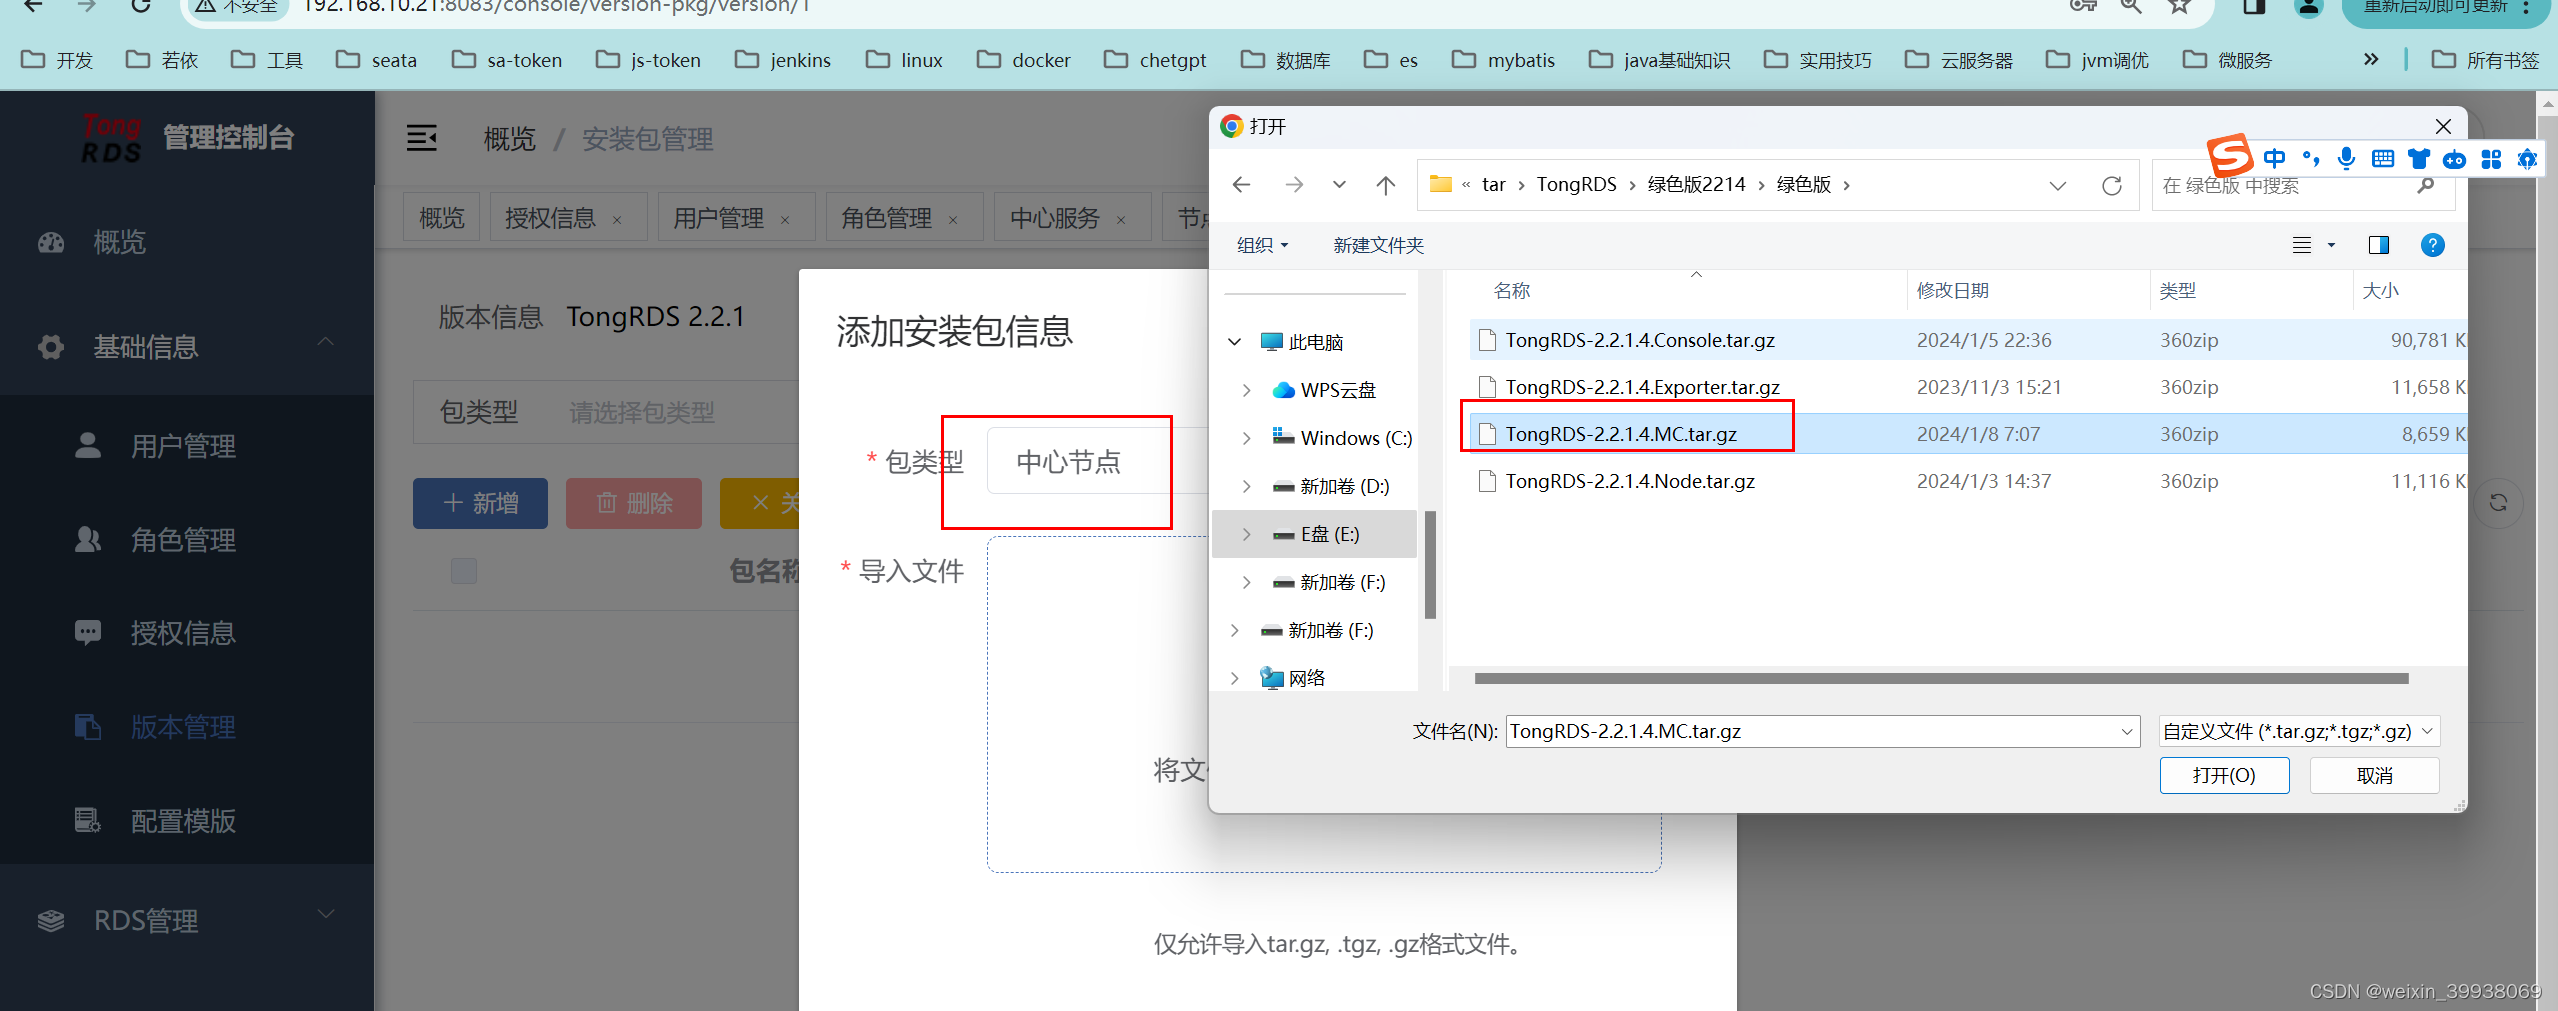
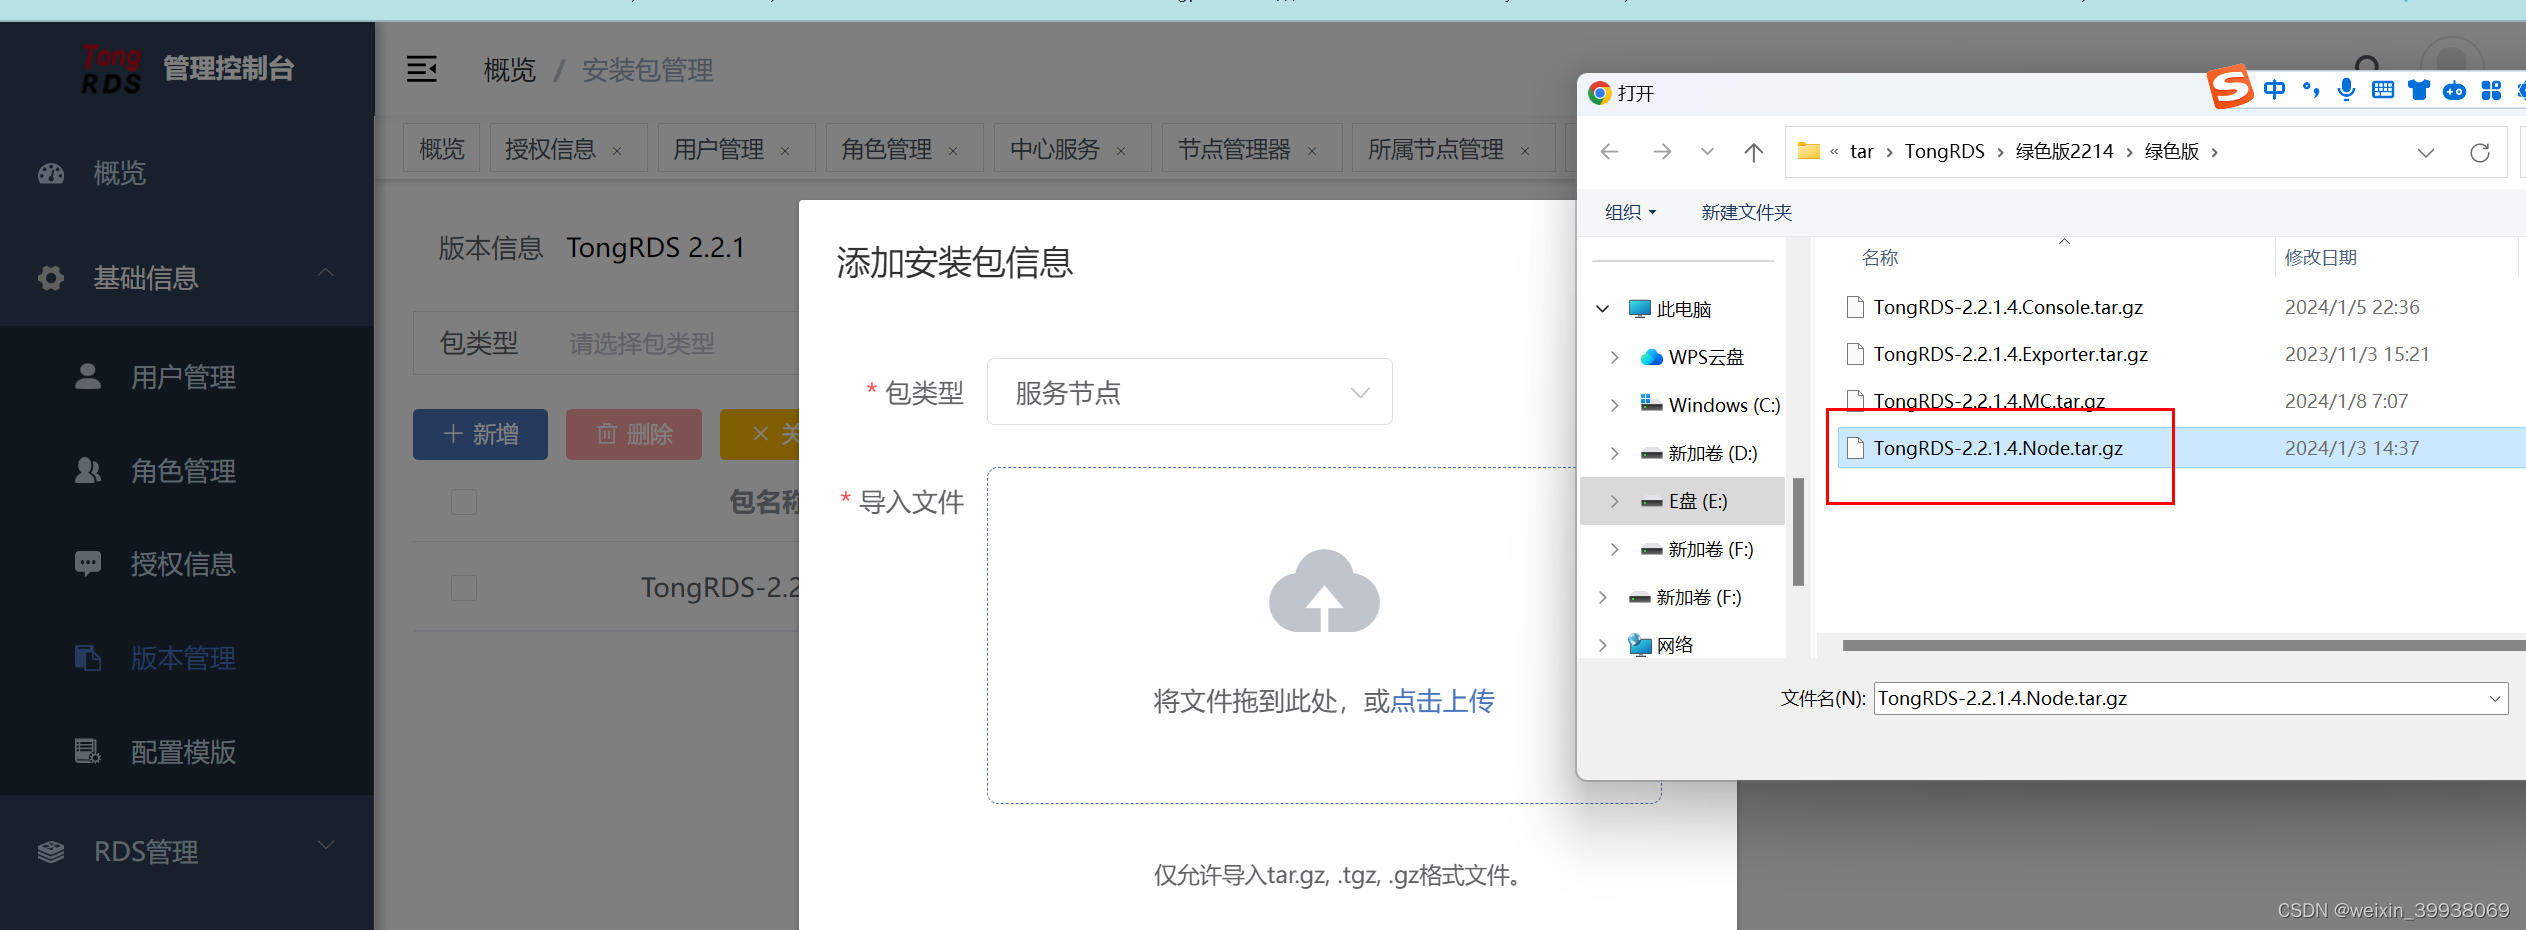
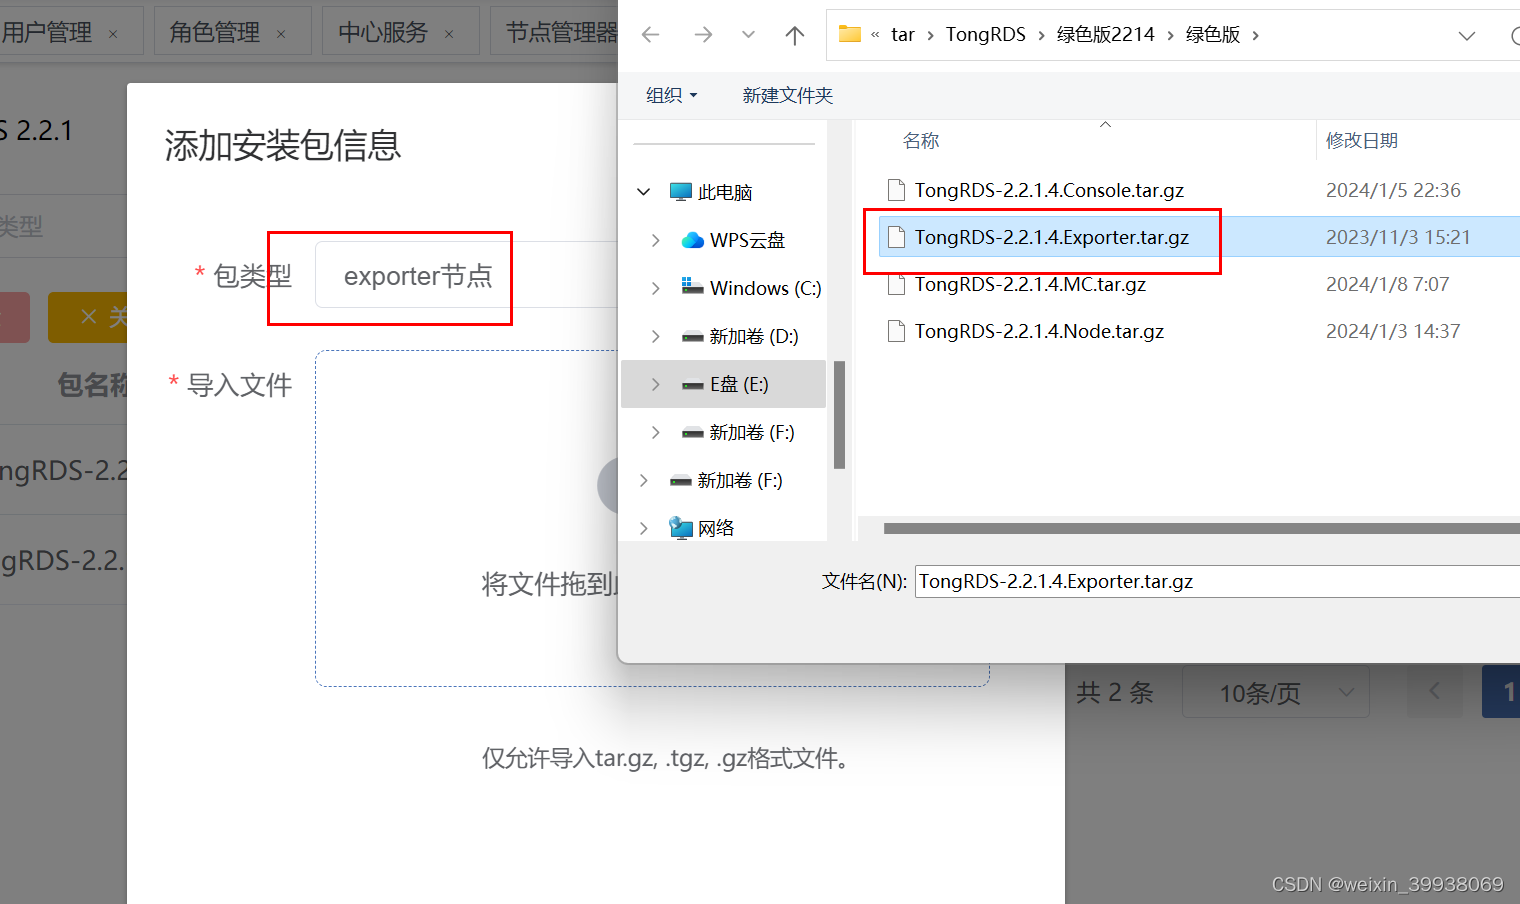
到版本配置里上传安装包(记得区分三个不同的安装包):
修改一下服务节点配置这个模版,配置上开启对应监控信息,不开启的话有一部分的grafana的监控数据看不到(这里是因为回头检查的时候,发现已经用了默认模版组新建了节点和集群,所以只好在默认模版组弄,建议可以备份一个模版组再修改):
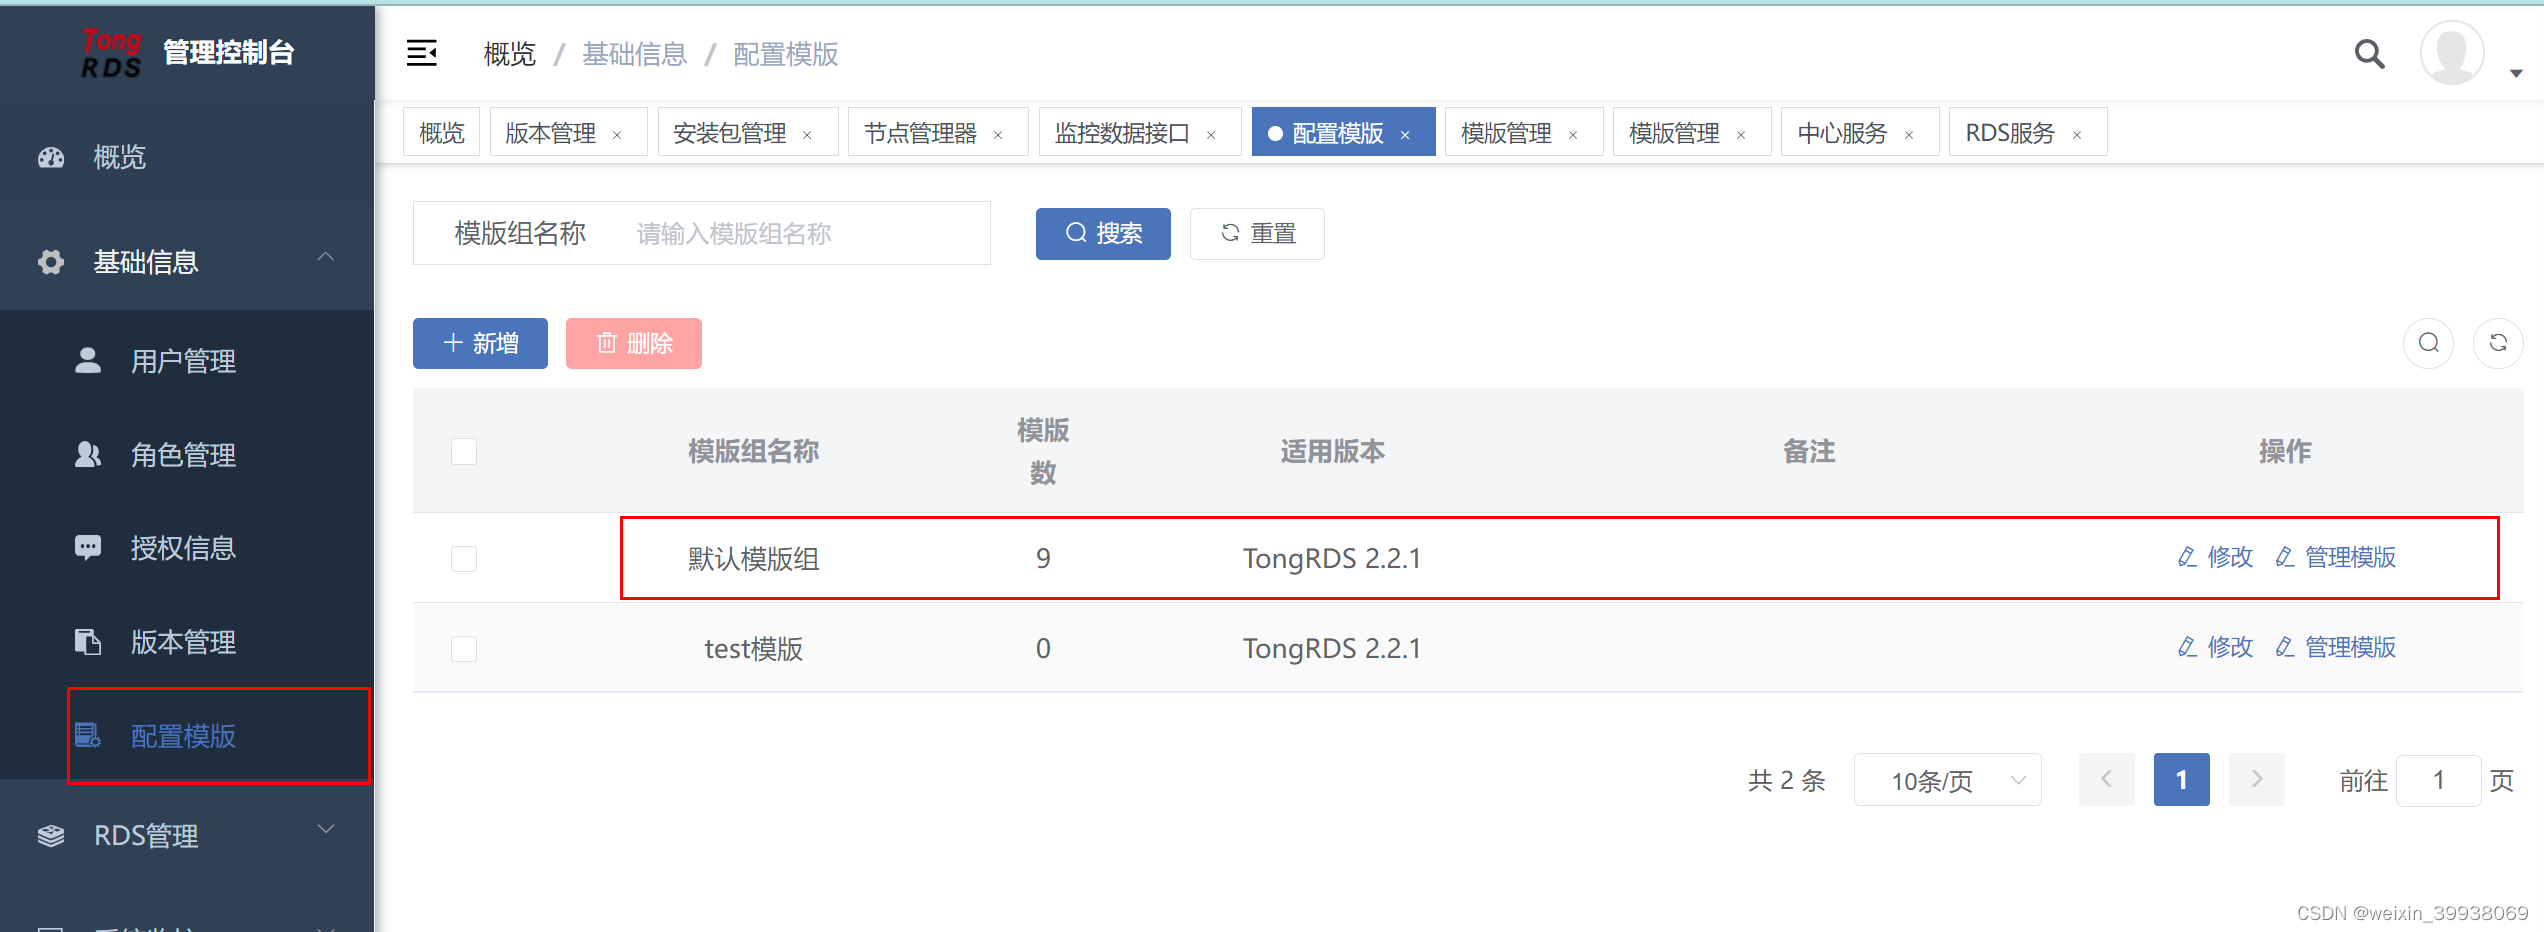
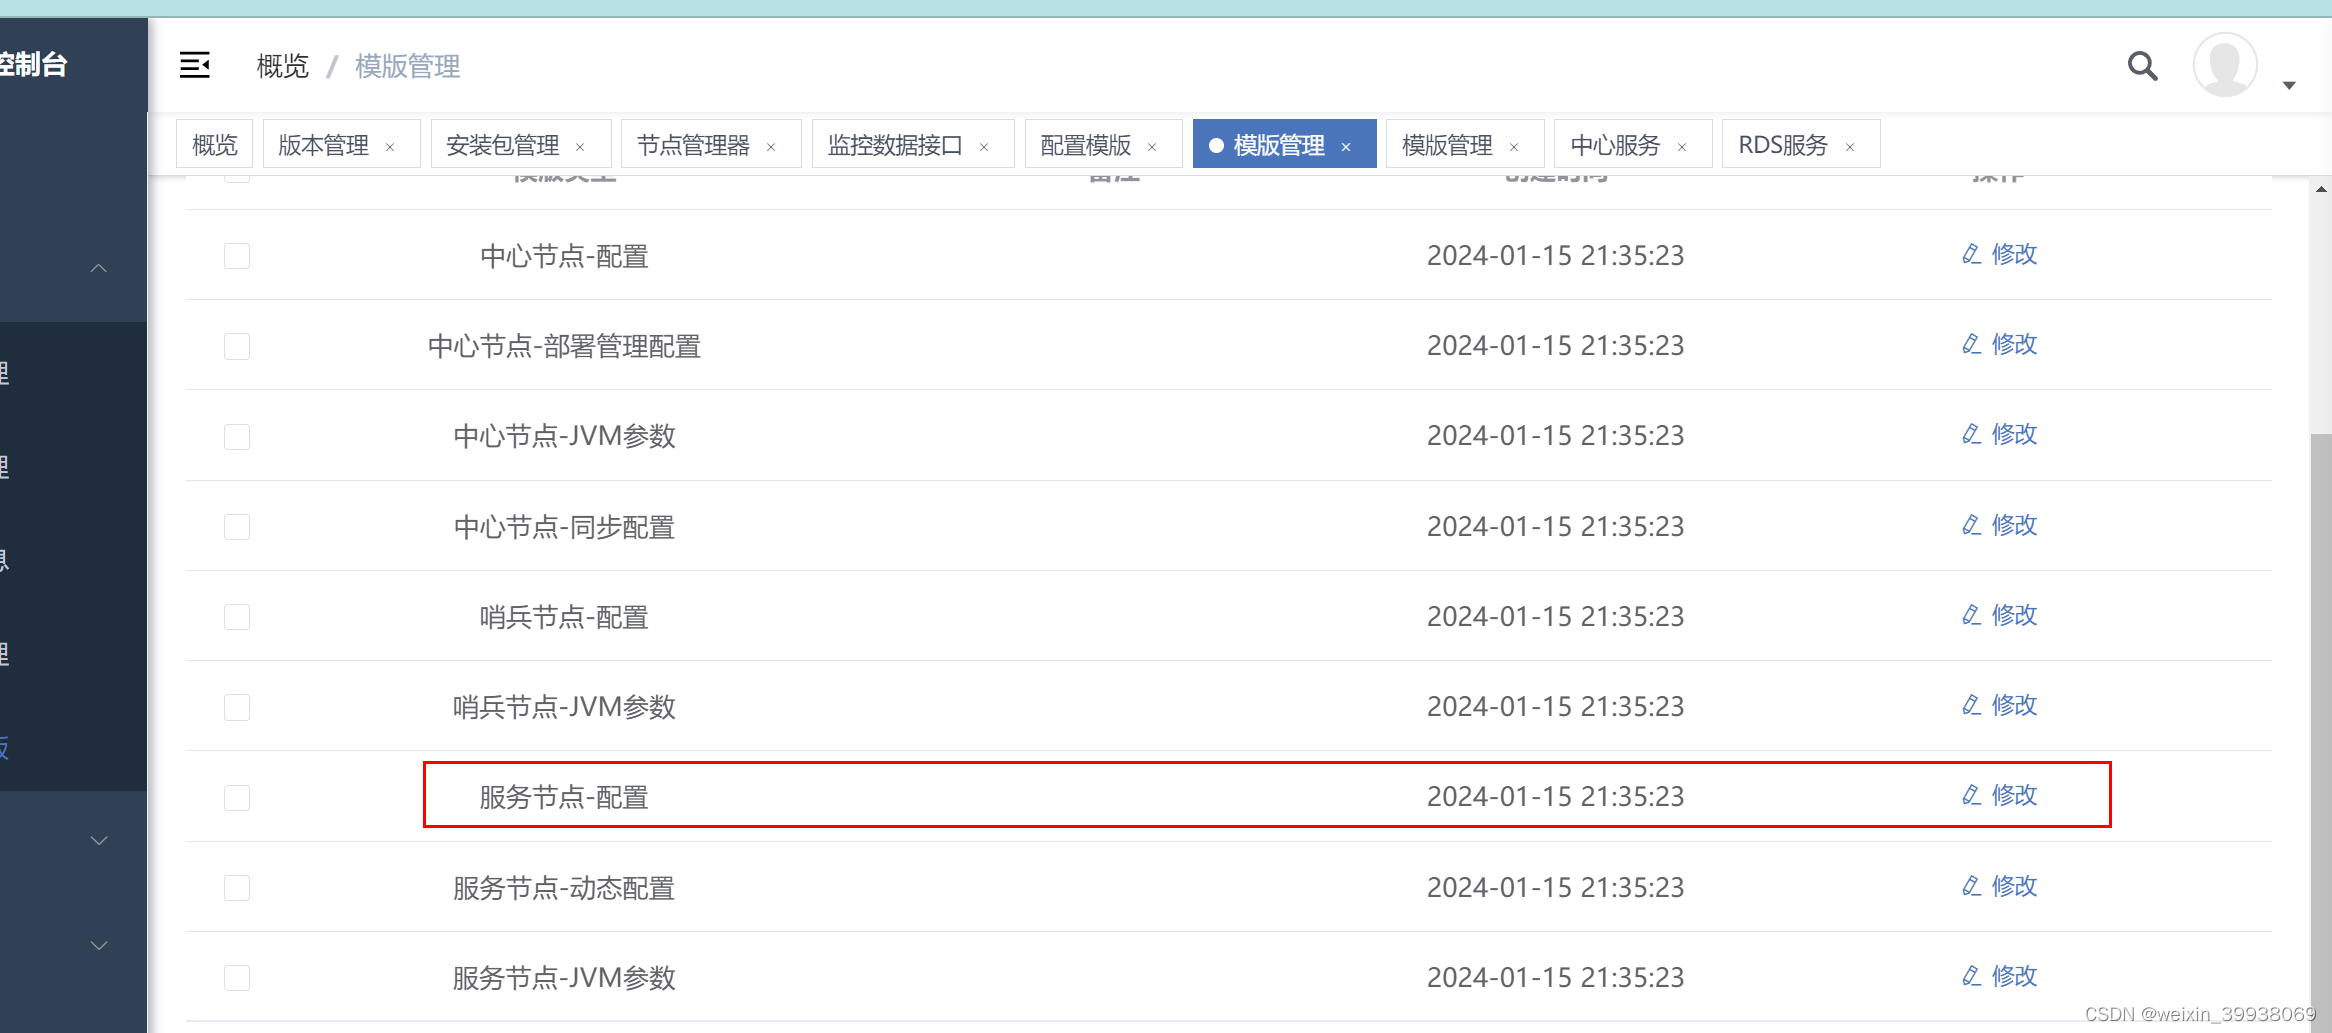
主要是找到common和table1这两个标签,进行配置和修改:
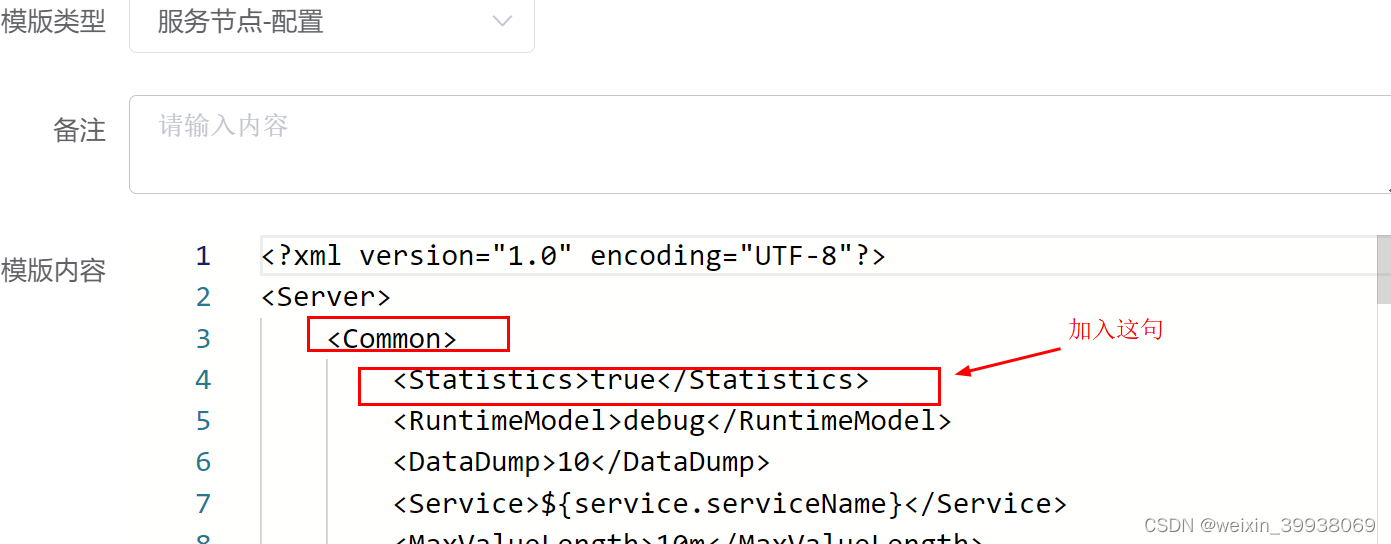
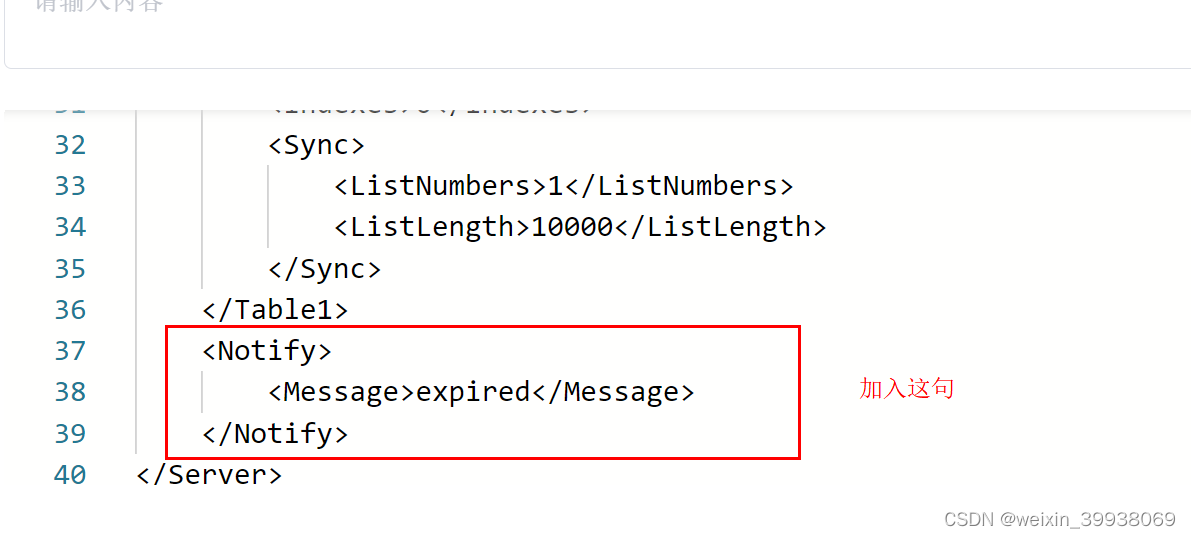
以下是我的本地配置信息,可以借鉴:
<?xml version="1.0" encoding="UTF-8"?> true debug 10 ${service.serviceName} 10m 256 150 ${node.instance} error 30 ${node.servicePort} 8 1000 ${service.secureMode} ${service.encryptPassword} ${node.redisPort} 1 1000000 bytes2, 100 variable, 0 0 1 10000 expired如果已经建立了集群和节点的,也没关系,找到对应的模板组和模板,修改后到节点和集群进行更新就好(前提是已经建立了集群和节点,没有的跳过这一步)
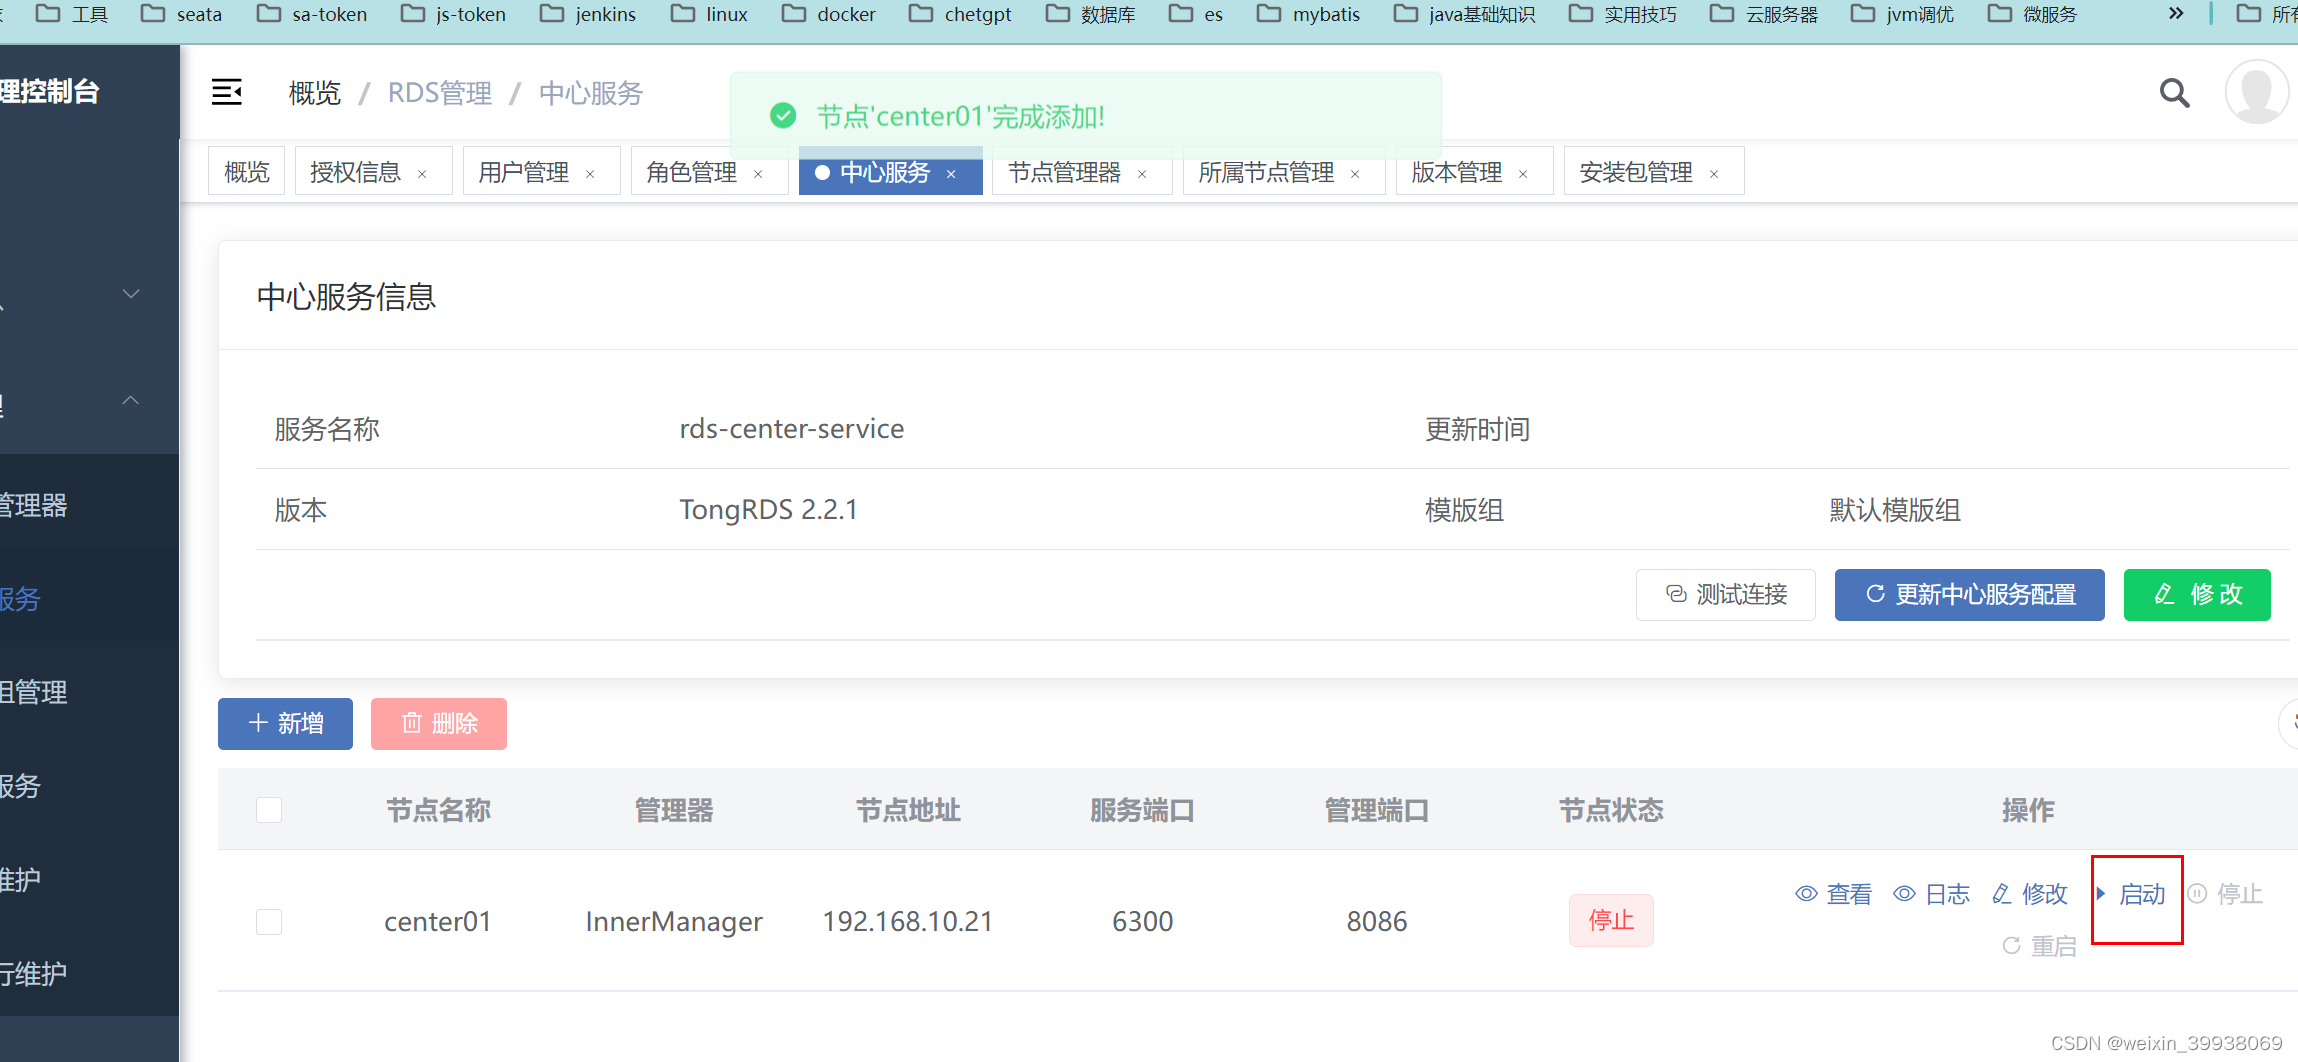
之后新建和配置中心节点,这个在后面监控会用到
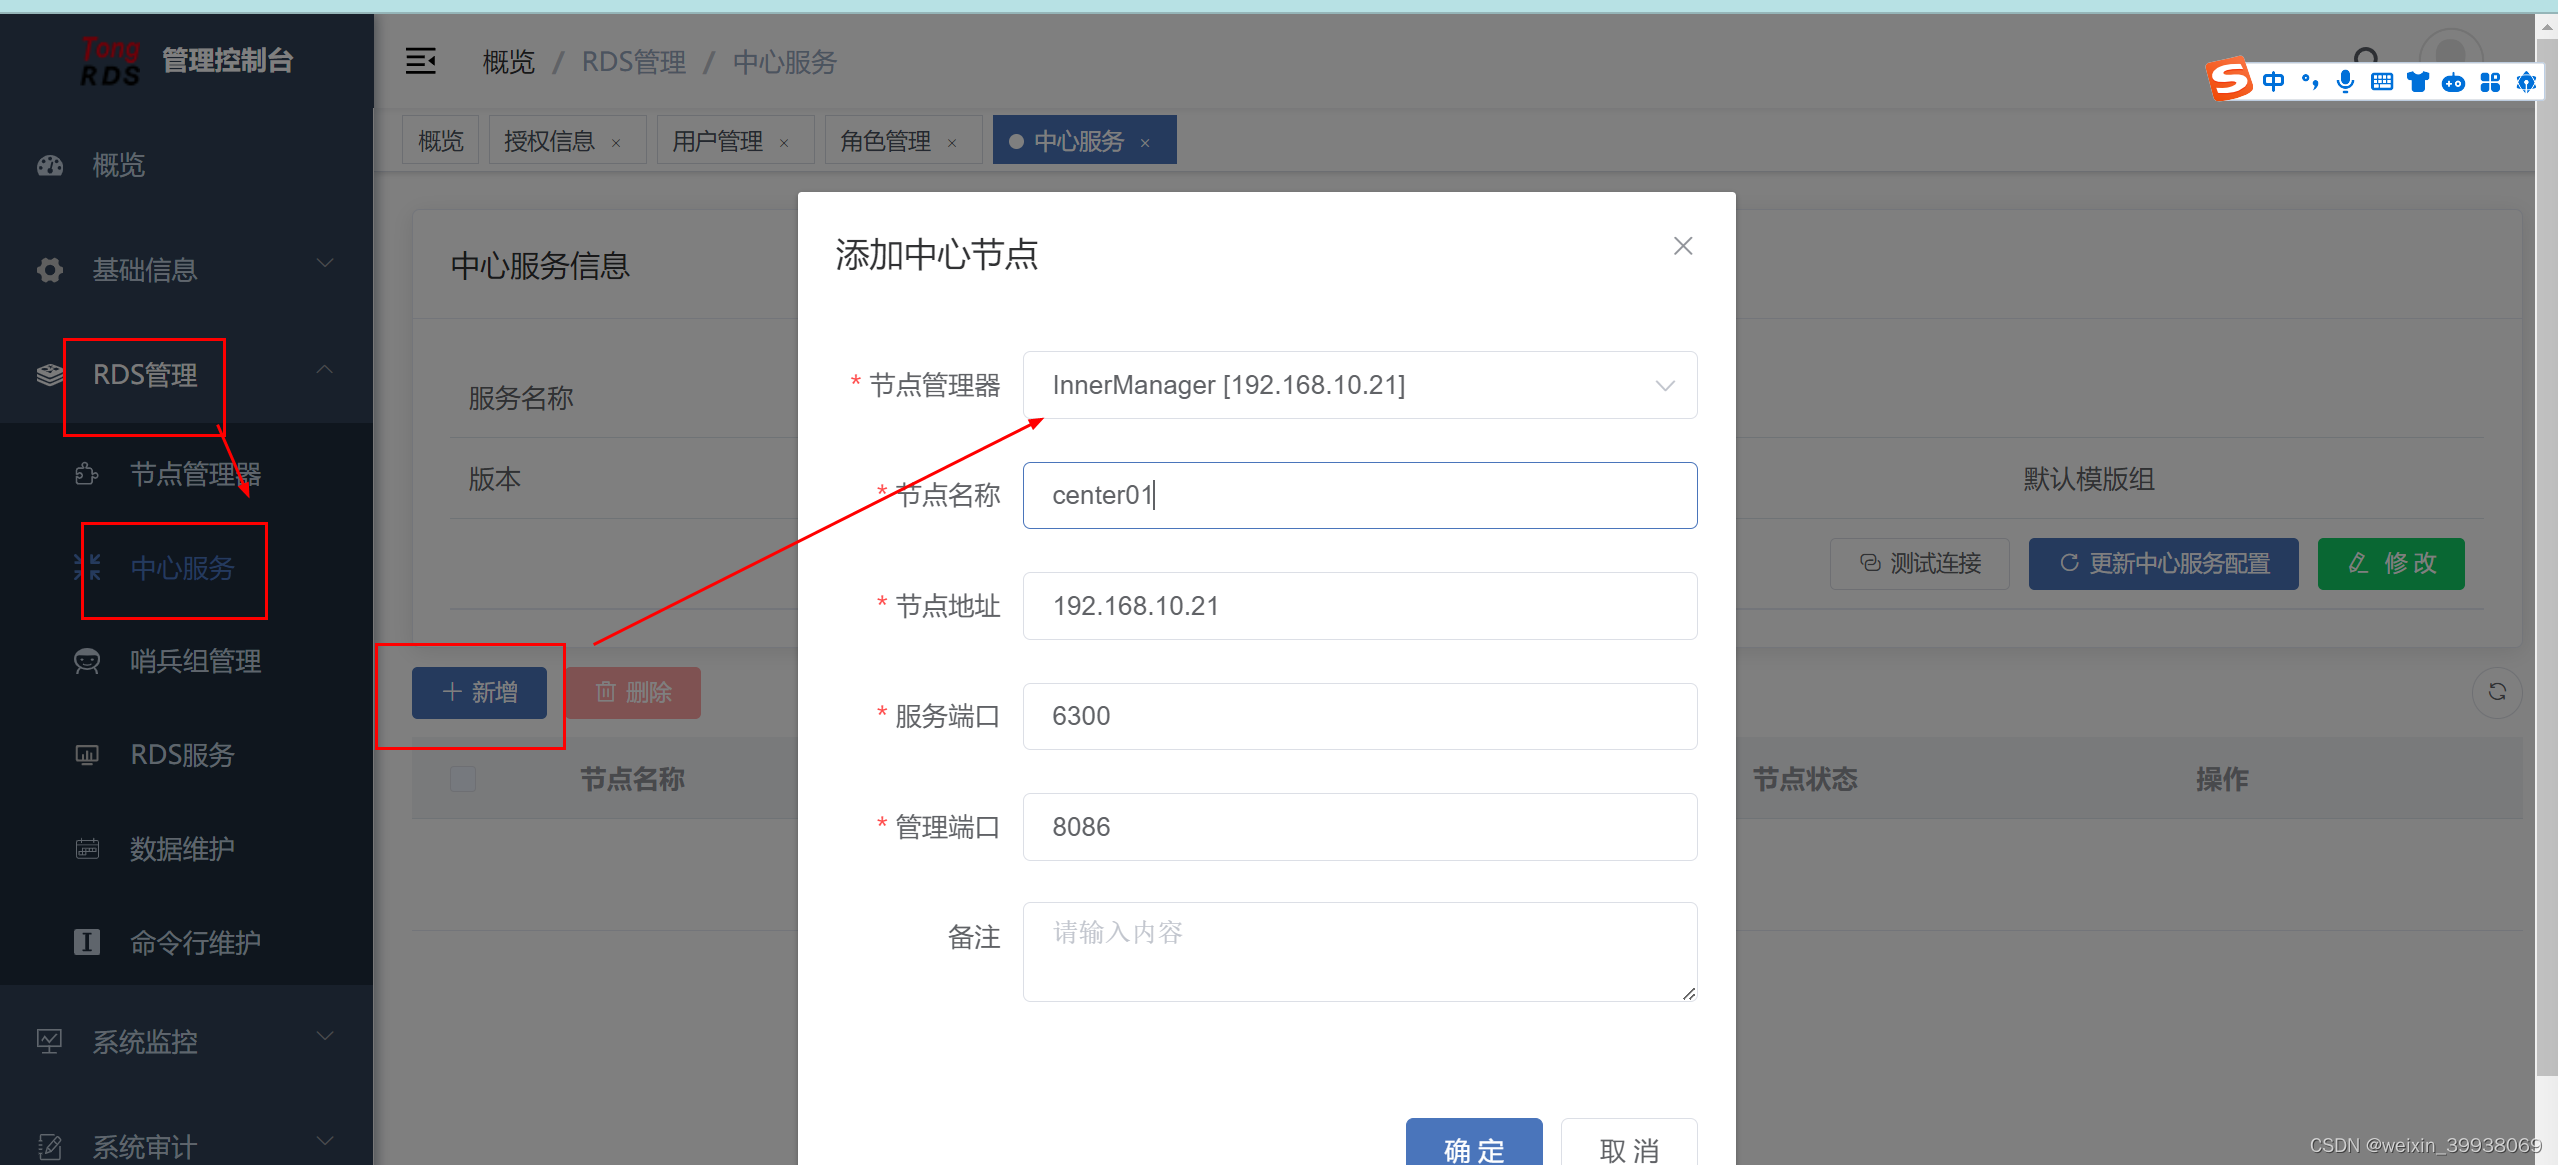
新增后启动中心节点
部署集群
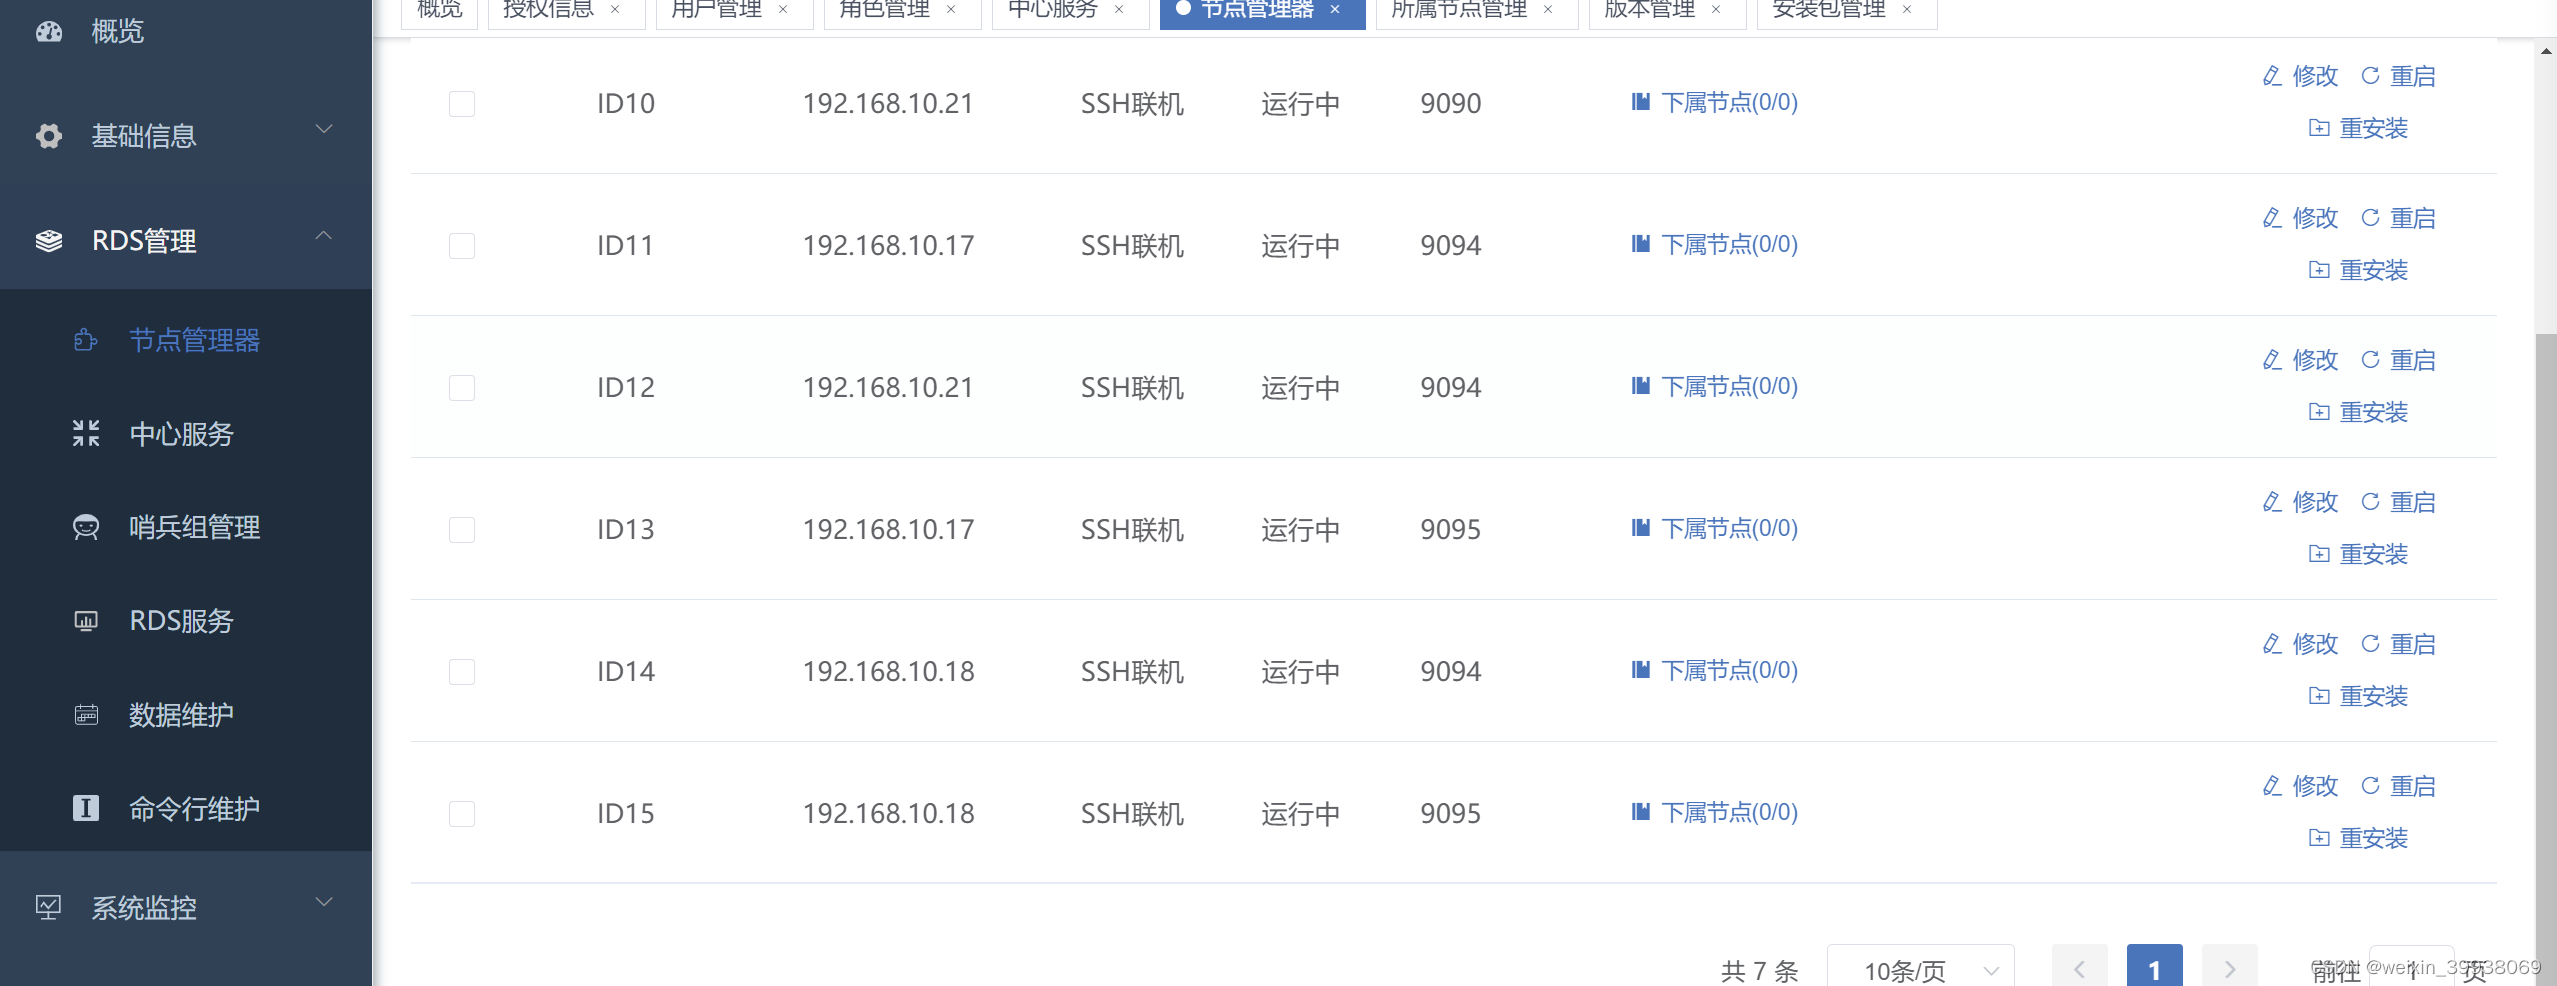
首先要先建立节点,这里以三个分片,每个分片一主一从来建立,一共建立6个节点,其中有一个节点跟中心节点的服务器ip是一致的。
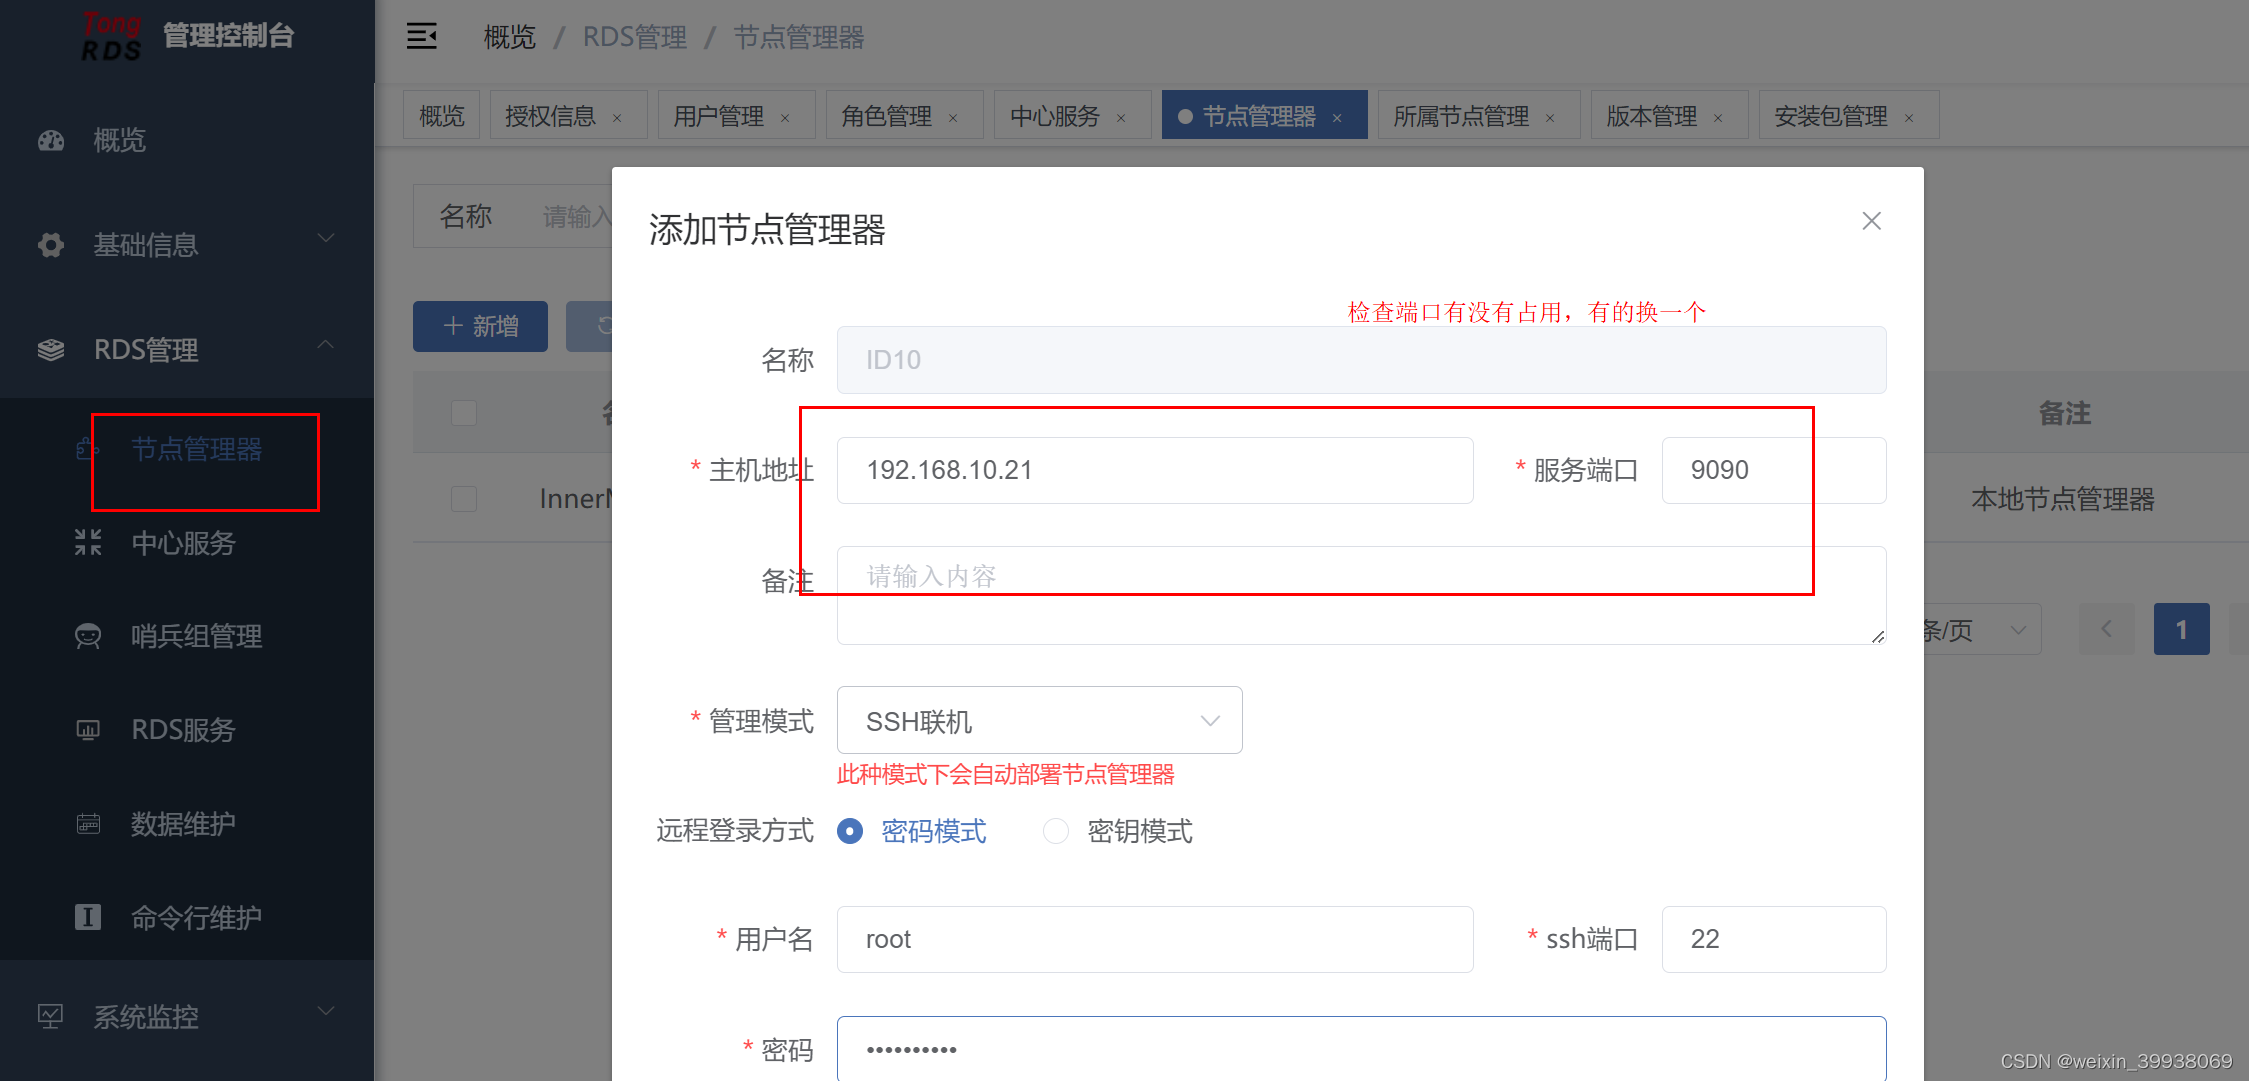
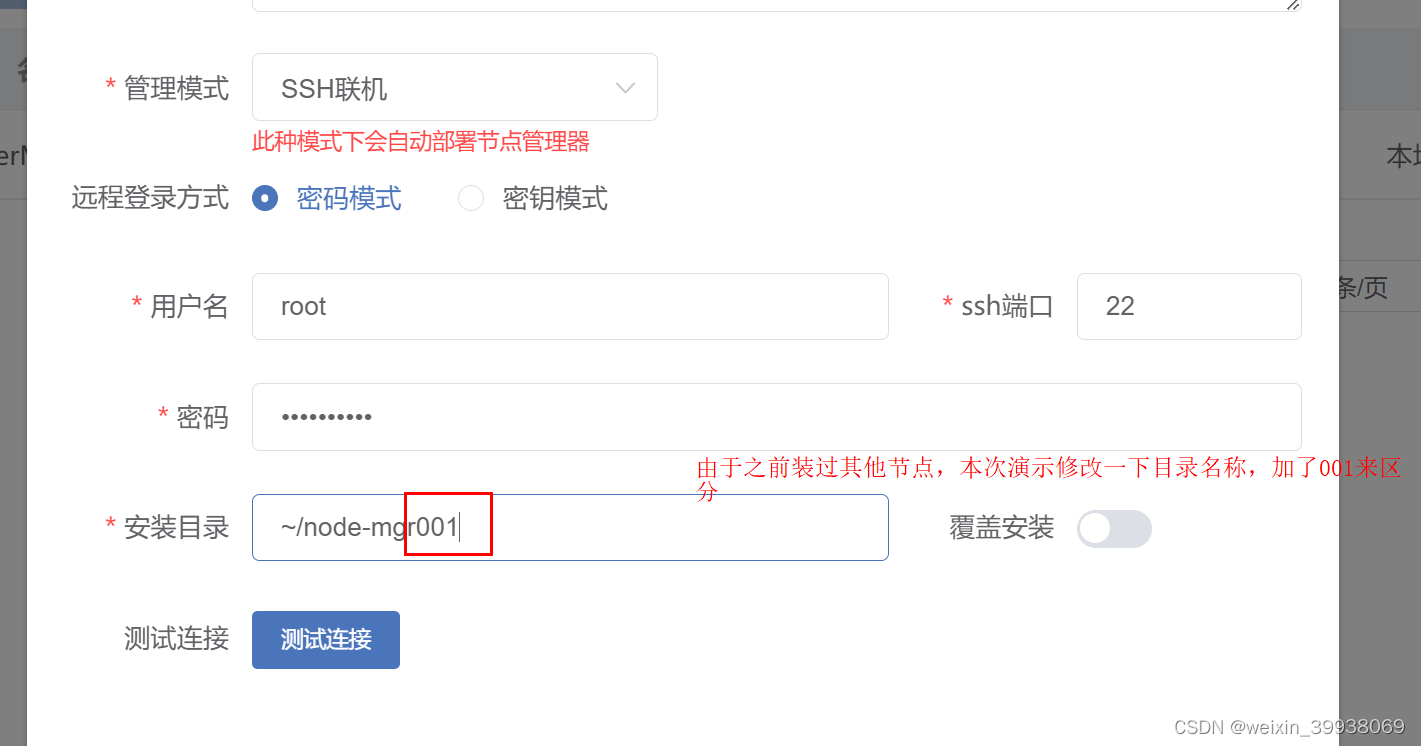
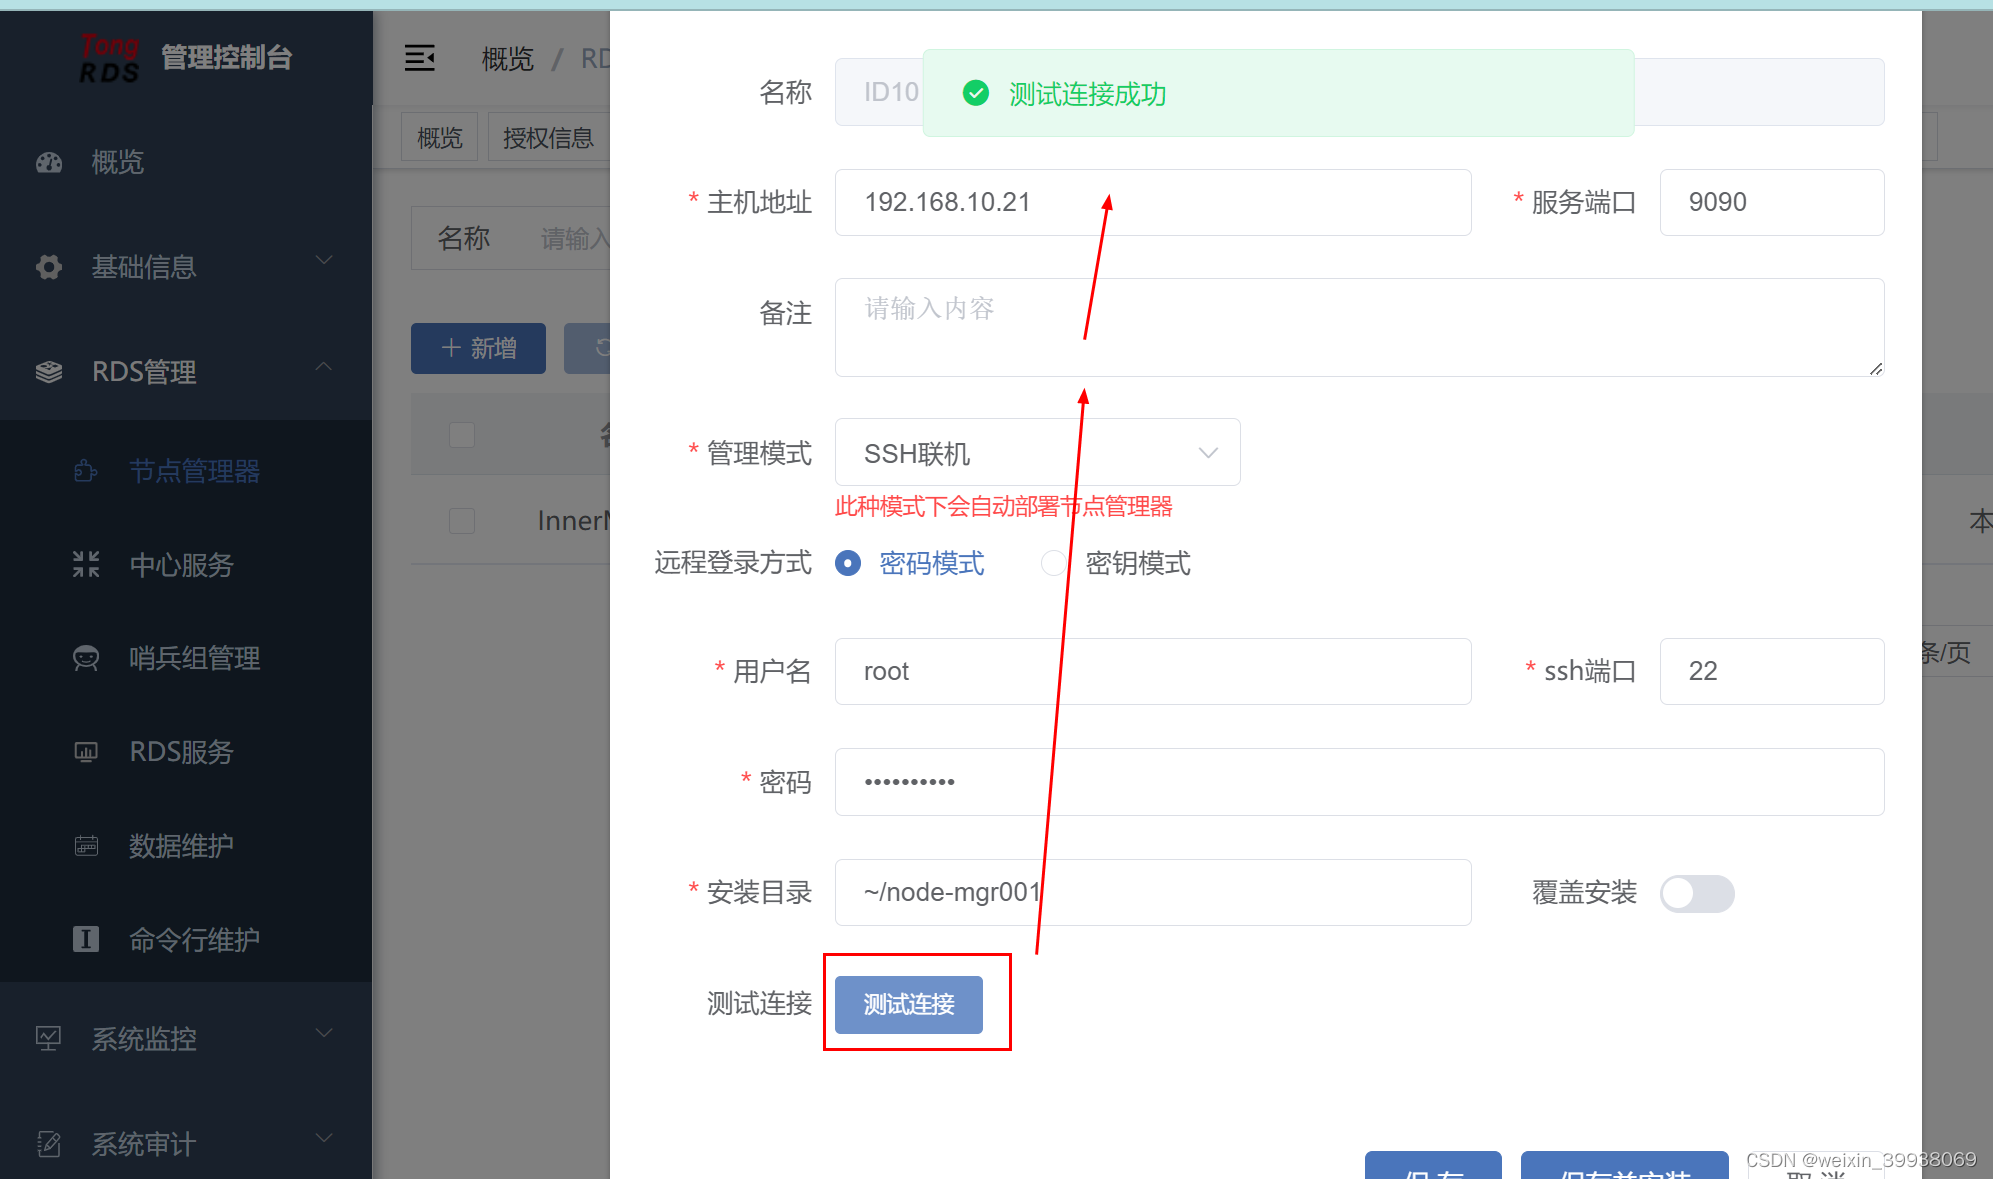
测试连接
保存并安装,如果出现以下报错,需要vi ~/.bashrc,配置上java相关配置,并删除root下对应的安装节点的目录(例如本次用的node-mgr001):
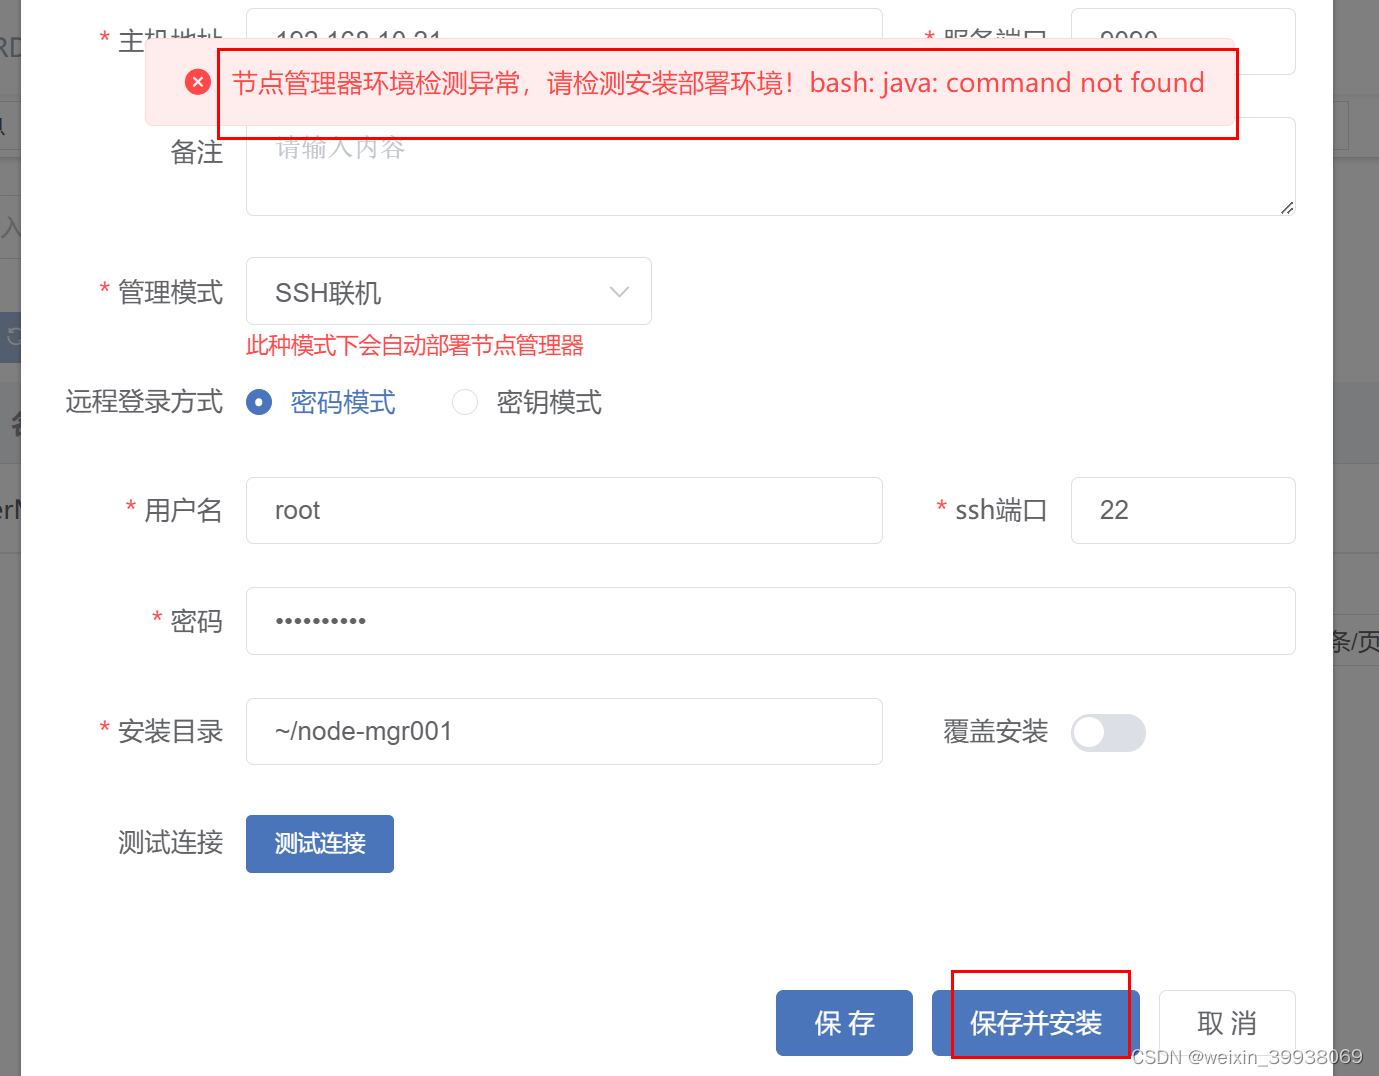
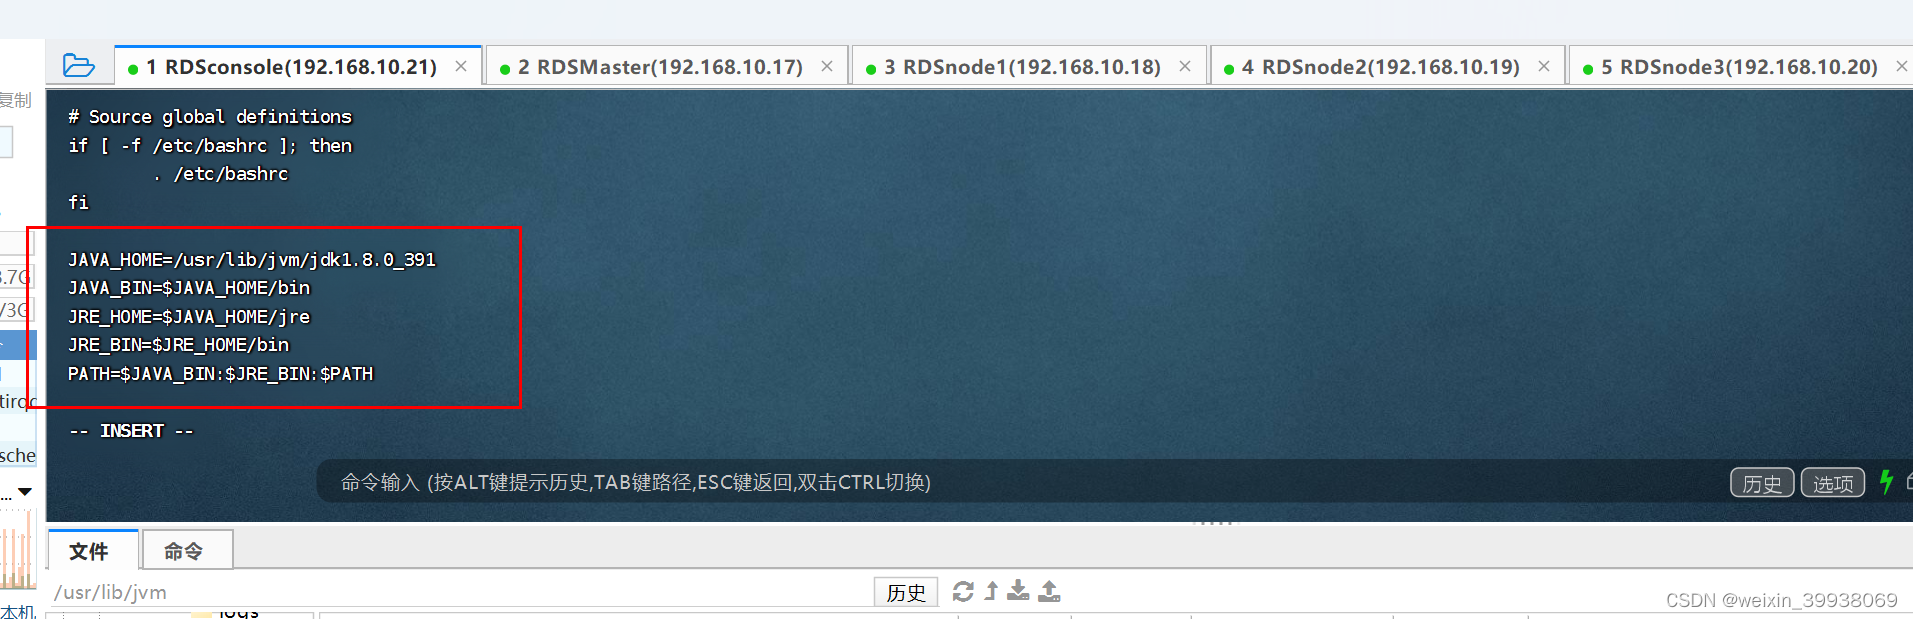
备注:~/.bashrc的java配置需要跟etc/profile的java配置一致。
之后source ~/.bashrc
万一改错了配置,会导致系统无法使用任何指令,这个时候可以输入:
export PATH=/bin:/usr/local/sbin:/usr/local/bin:/sbin:/bin:/usr/sbin:/usr/bin
然后把改错的配置删掉重新改。
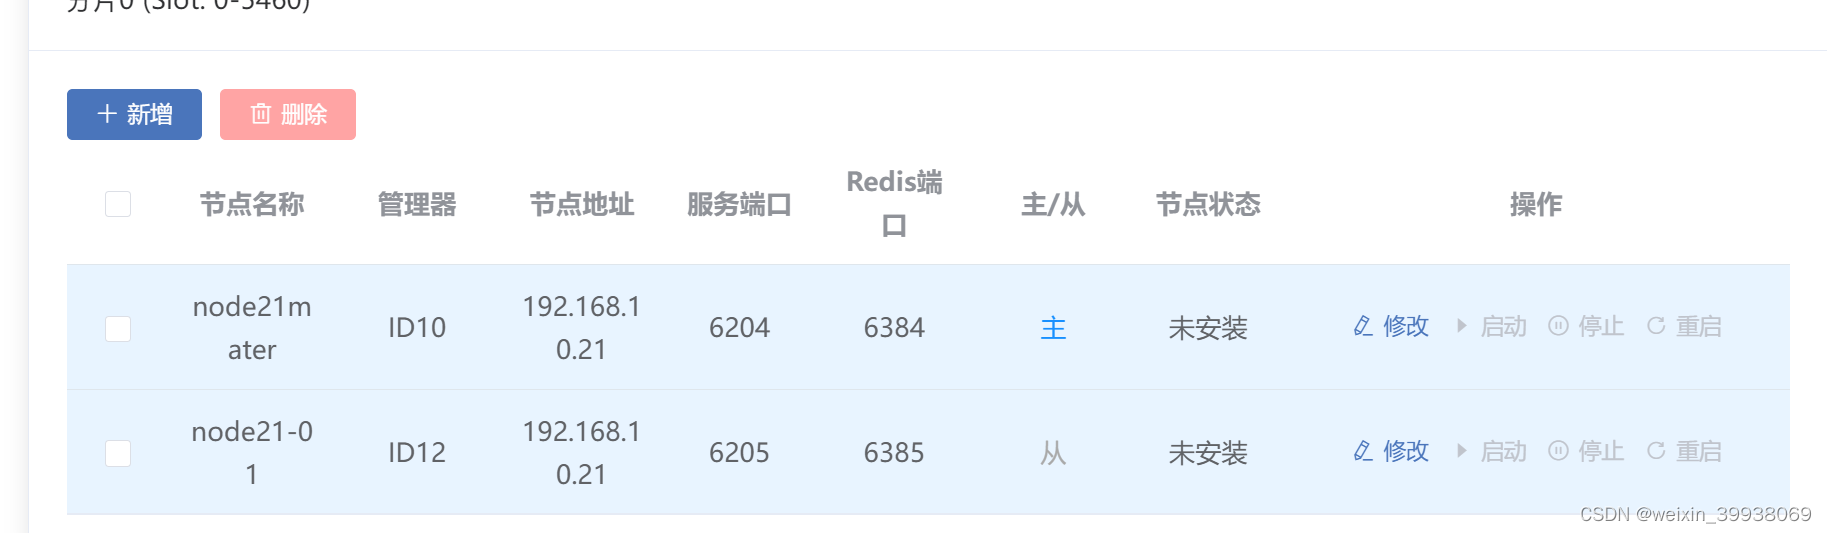
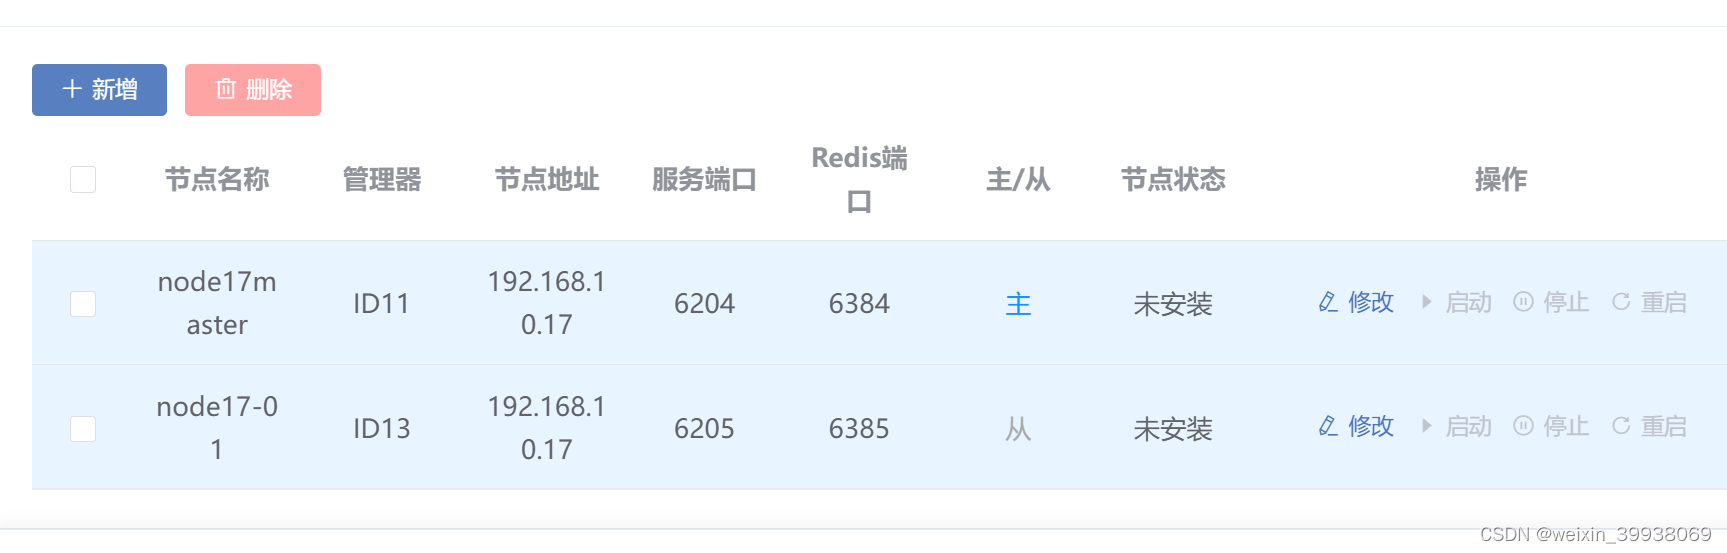
以下是本次使用的节点
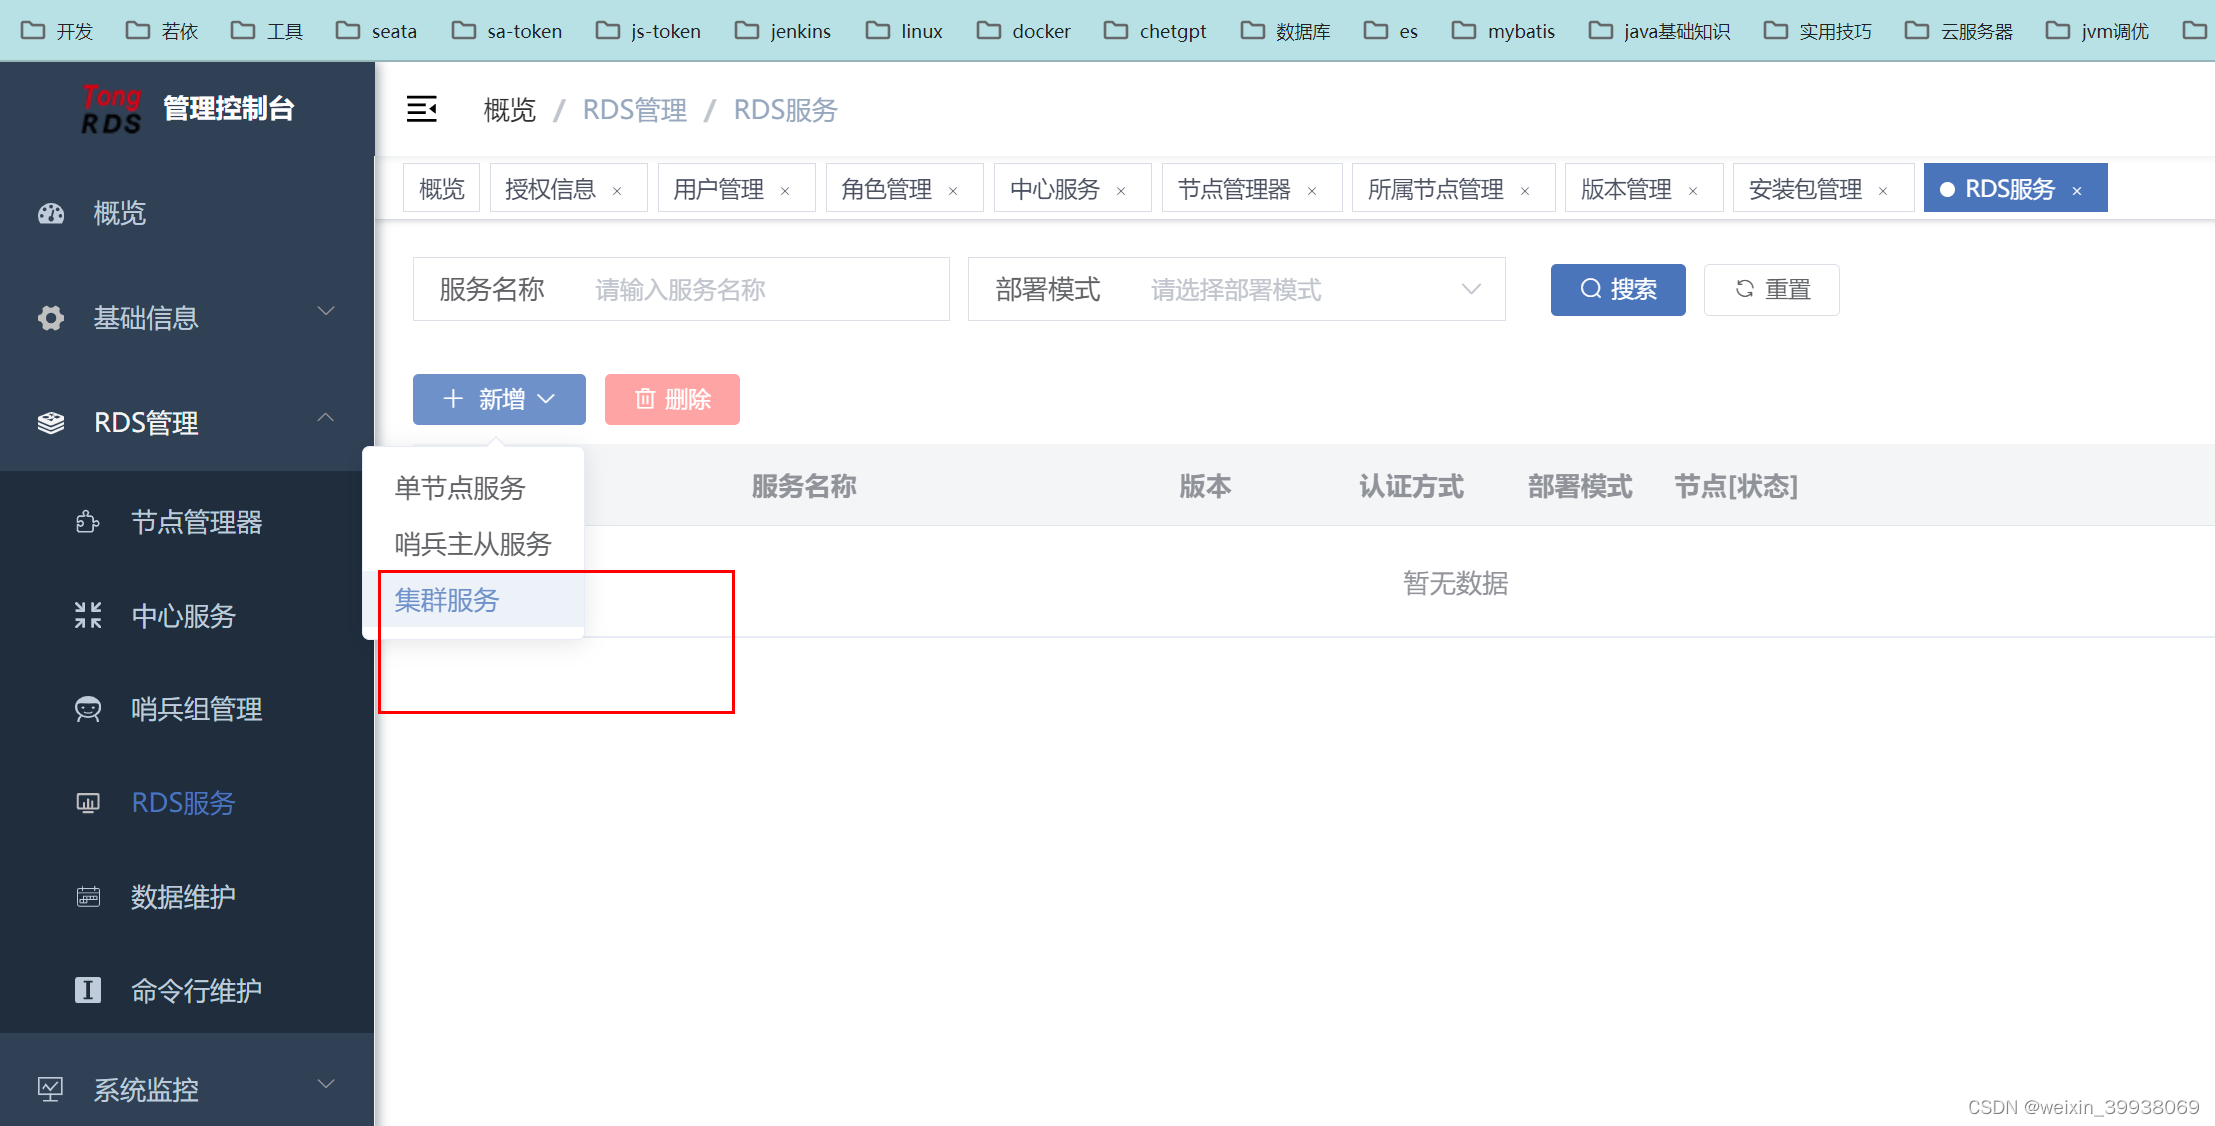
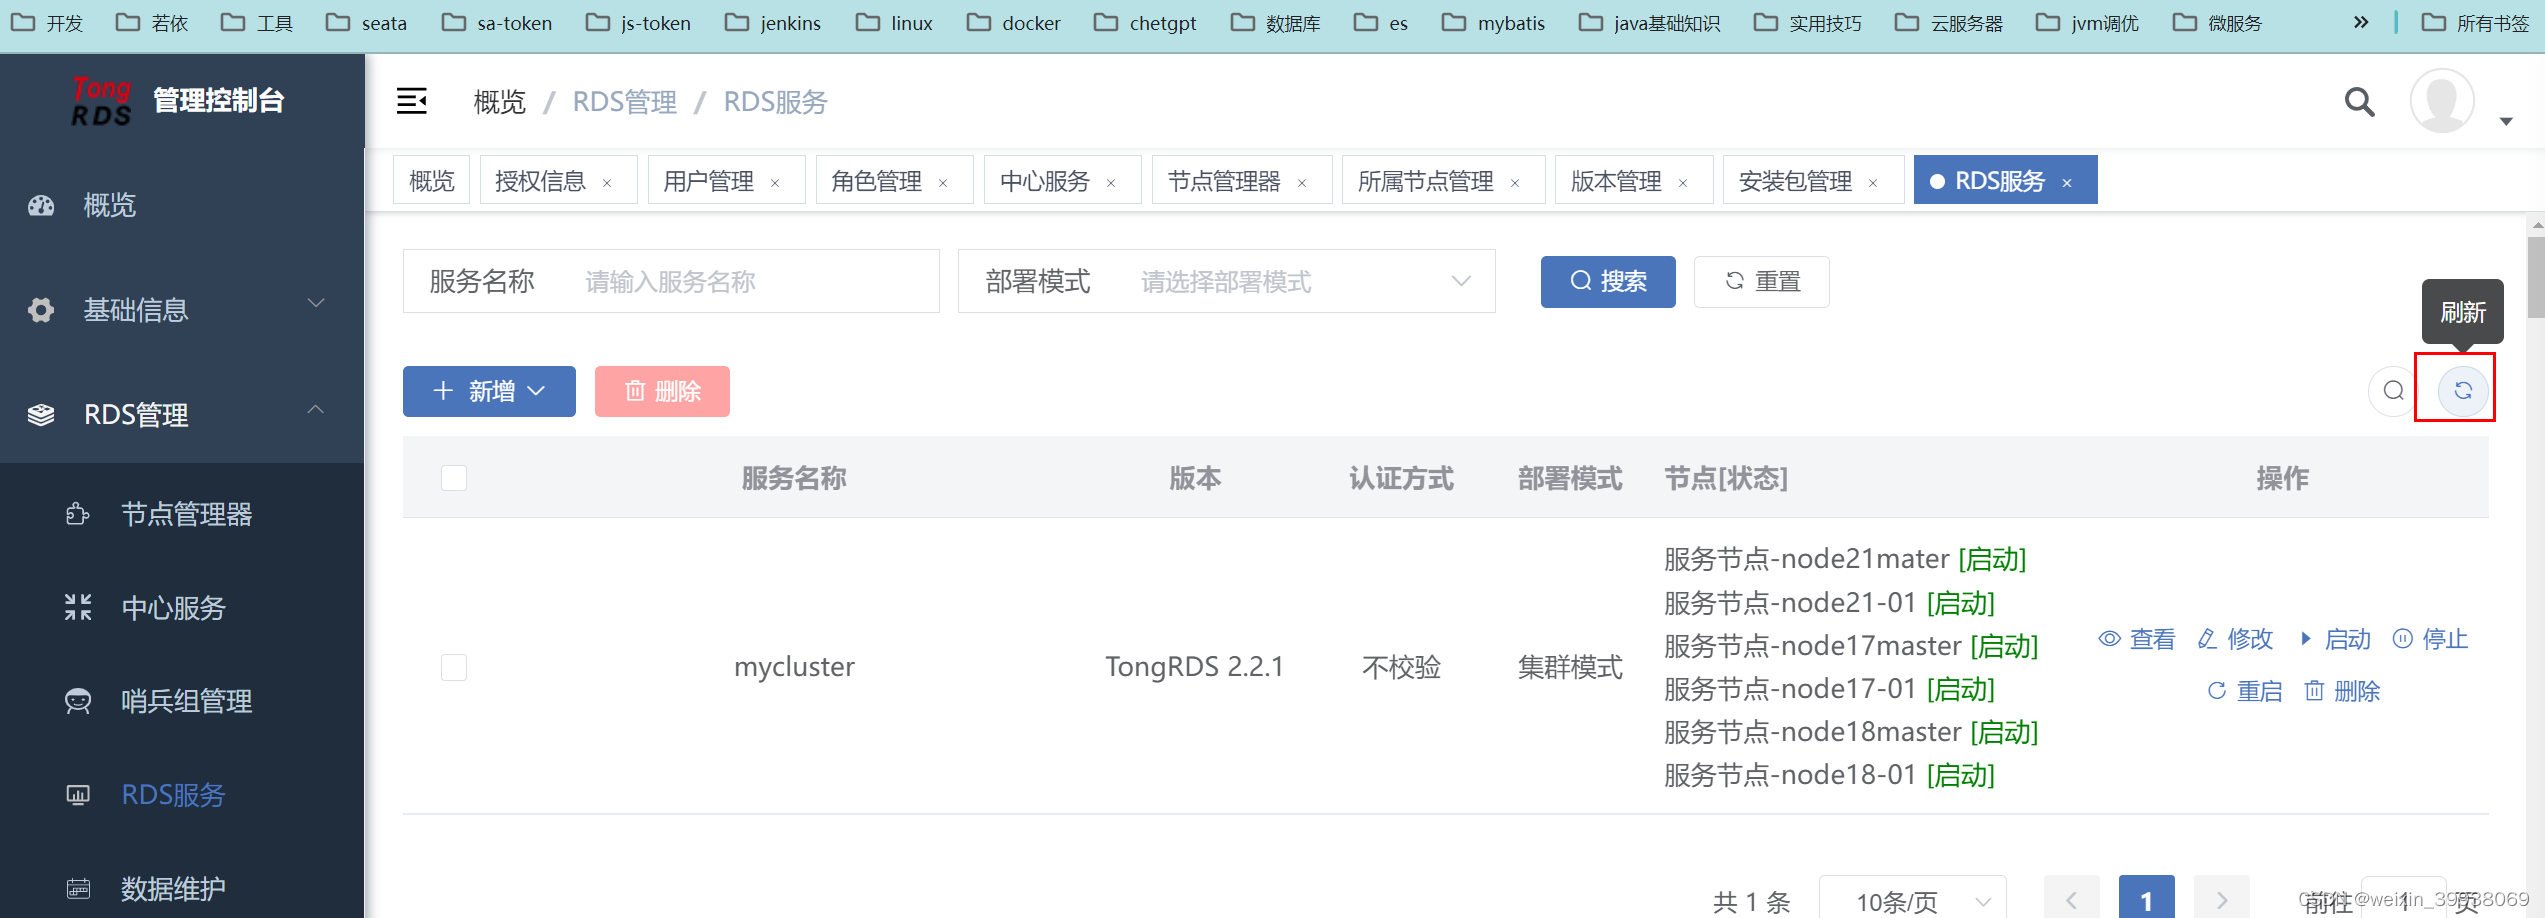
到rds服务里新建集群服务
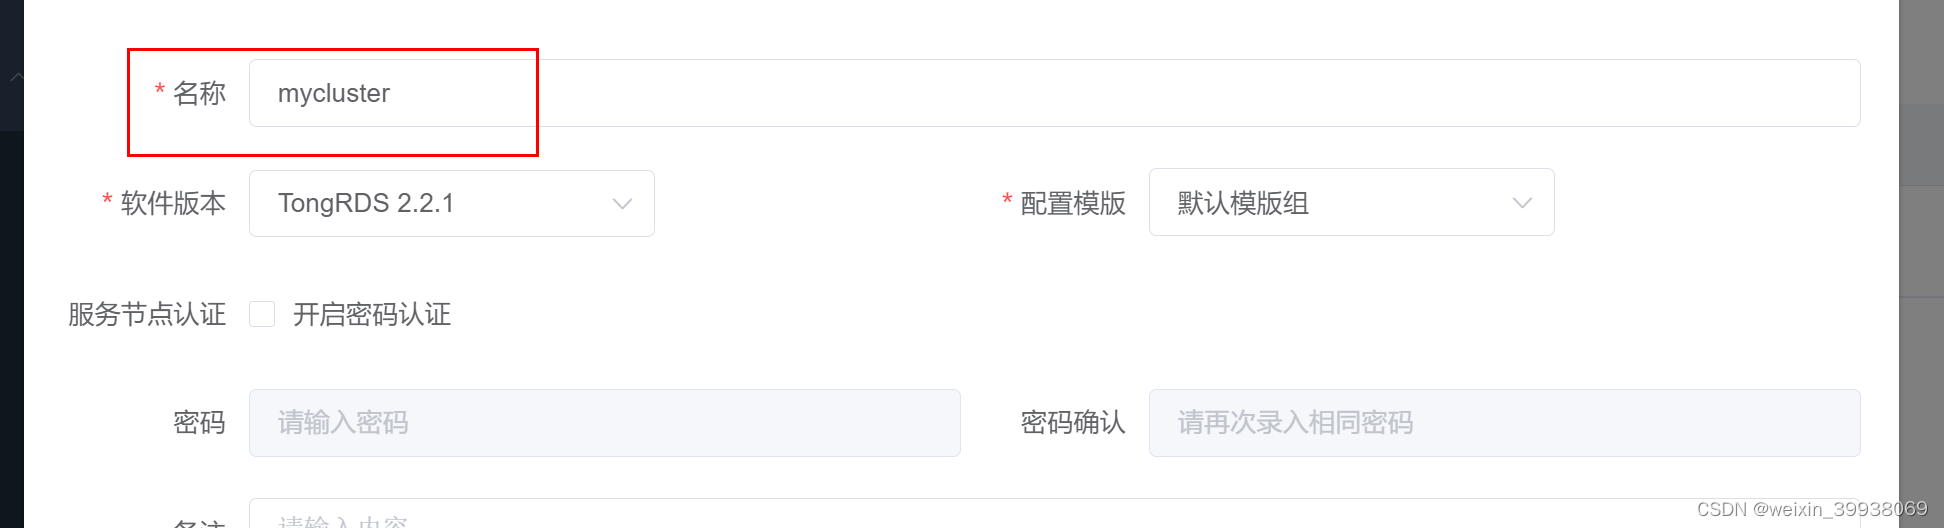
写好集群名
根据需要是否增加分片,这里增加了两个分片
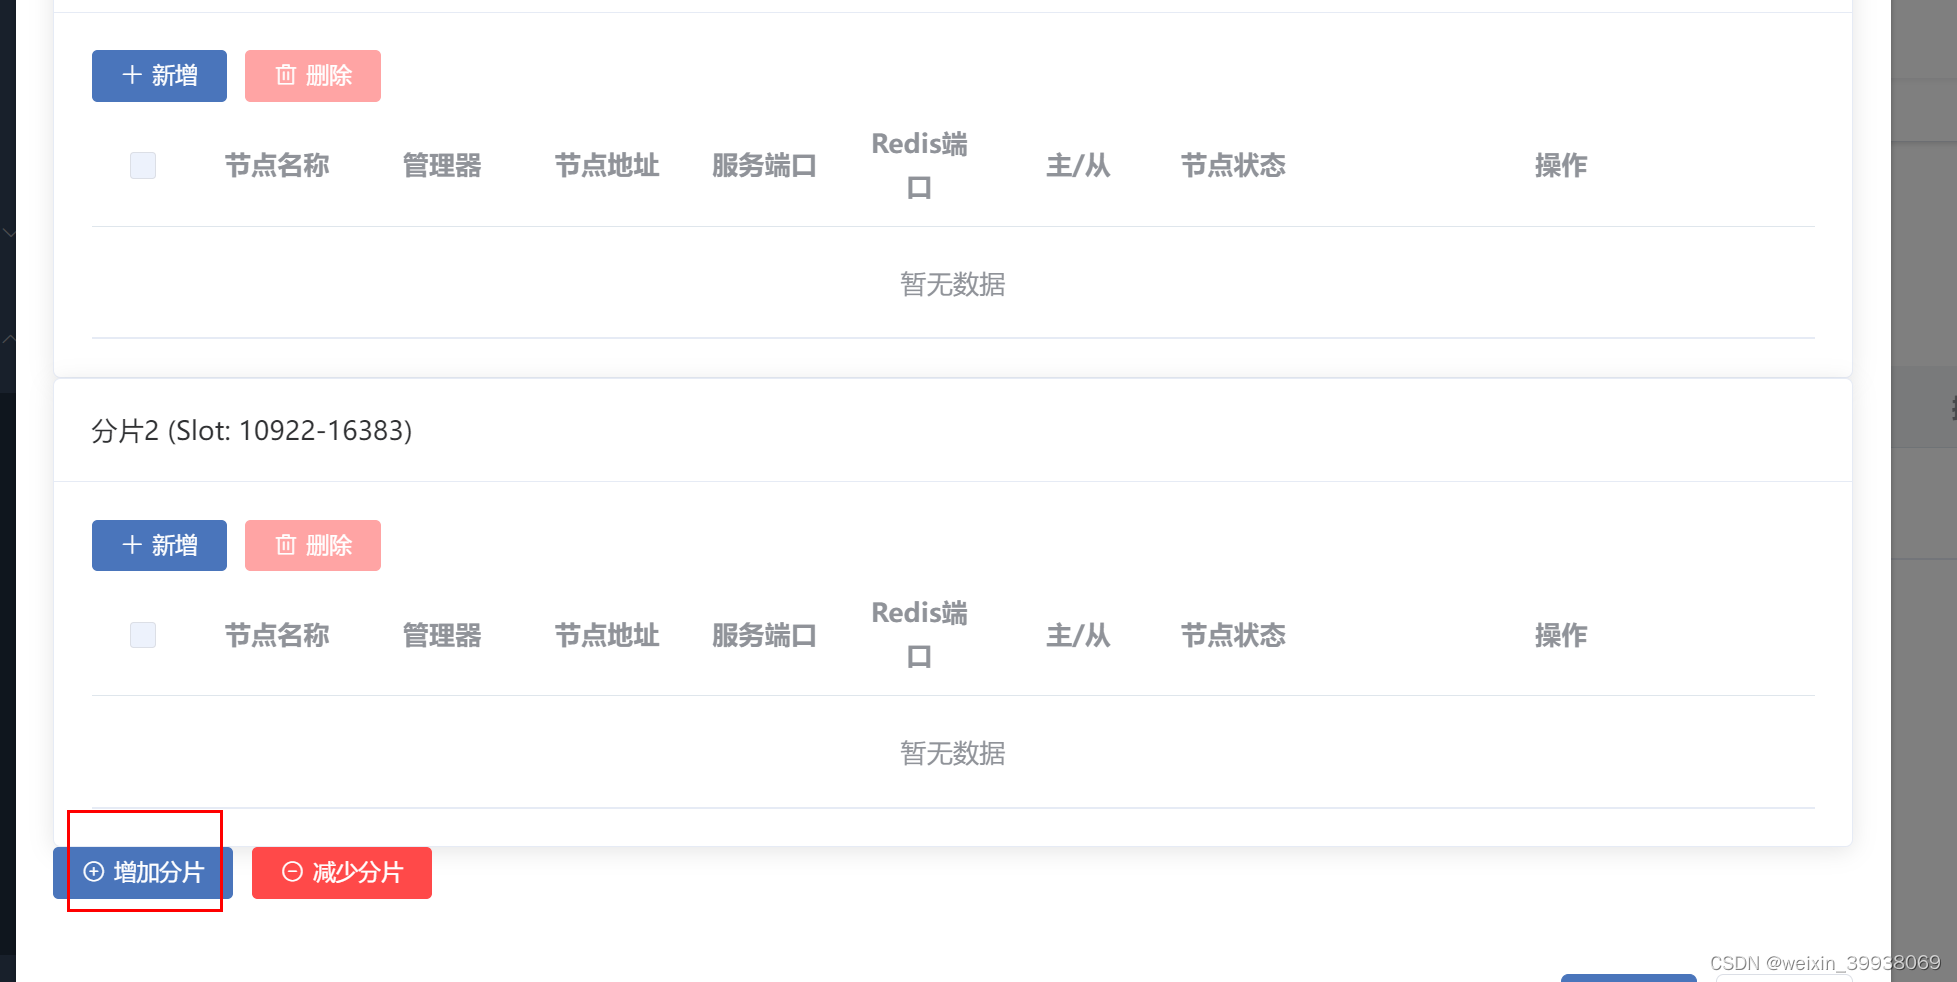
每个分片至少一主一从,最好都是同一个服务器ip下的节点

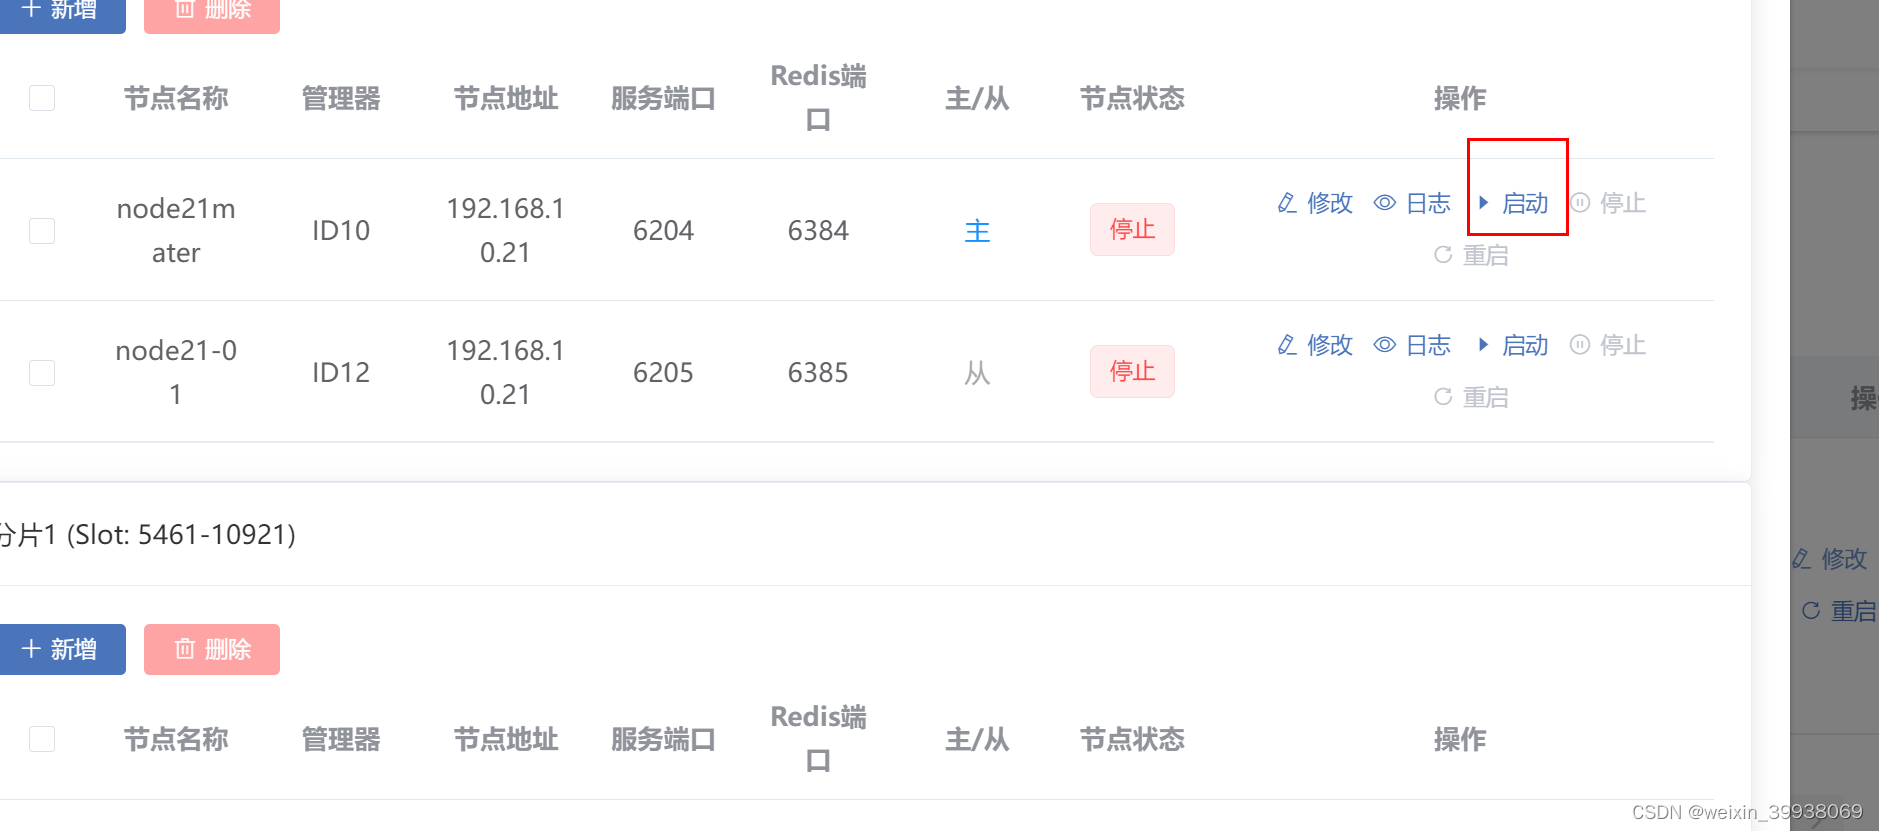
注意名称,服务端口,redis端口不能重复,以下是本次的配置

点击确定,保存:

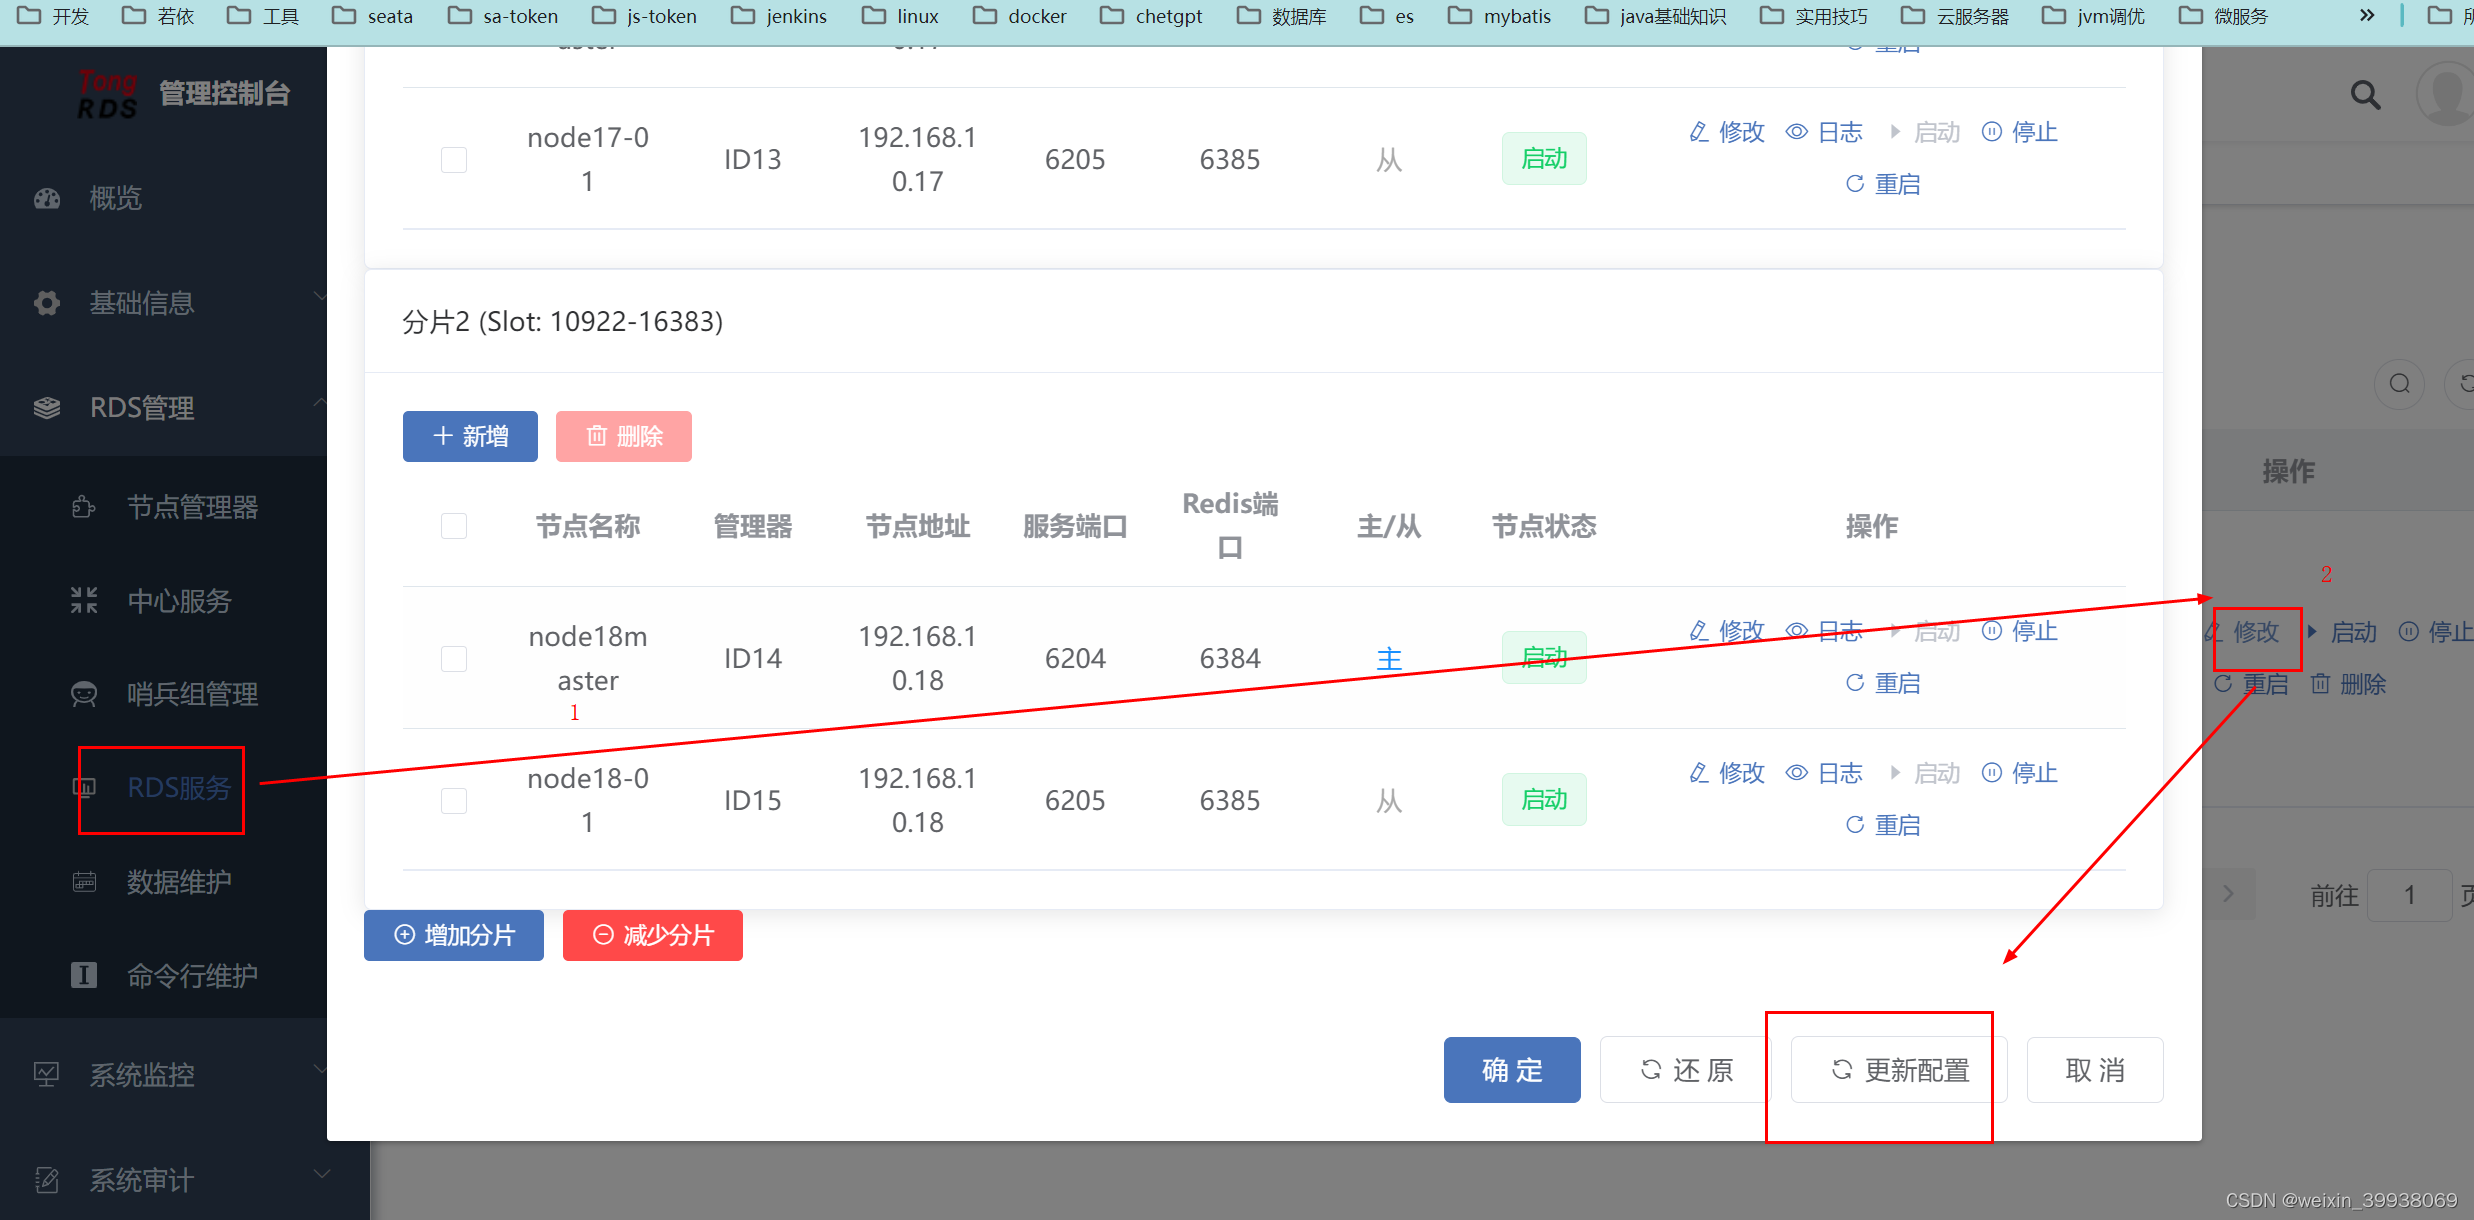
保存后先点修改
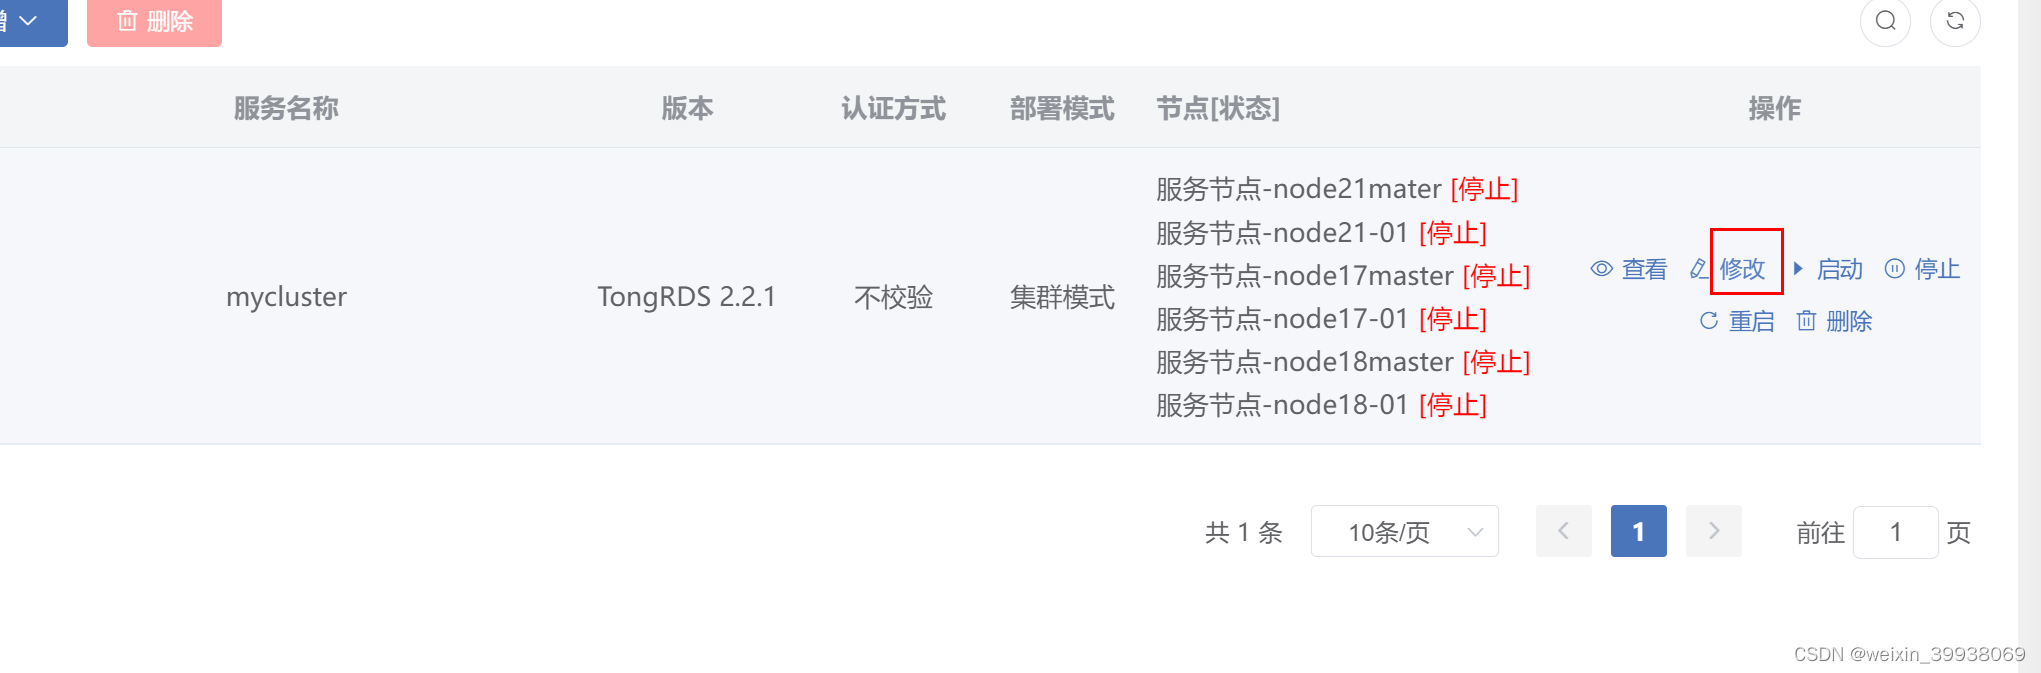
逐个启动,如果启动不成功,旁边会有个日志按钮,可以去看日志排除问题:
确认都启动成功后,按确定,然后再启动集群:
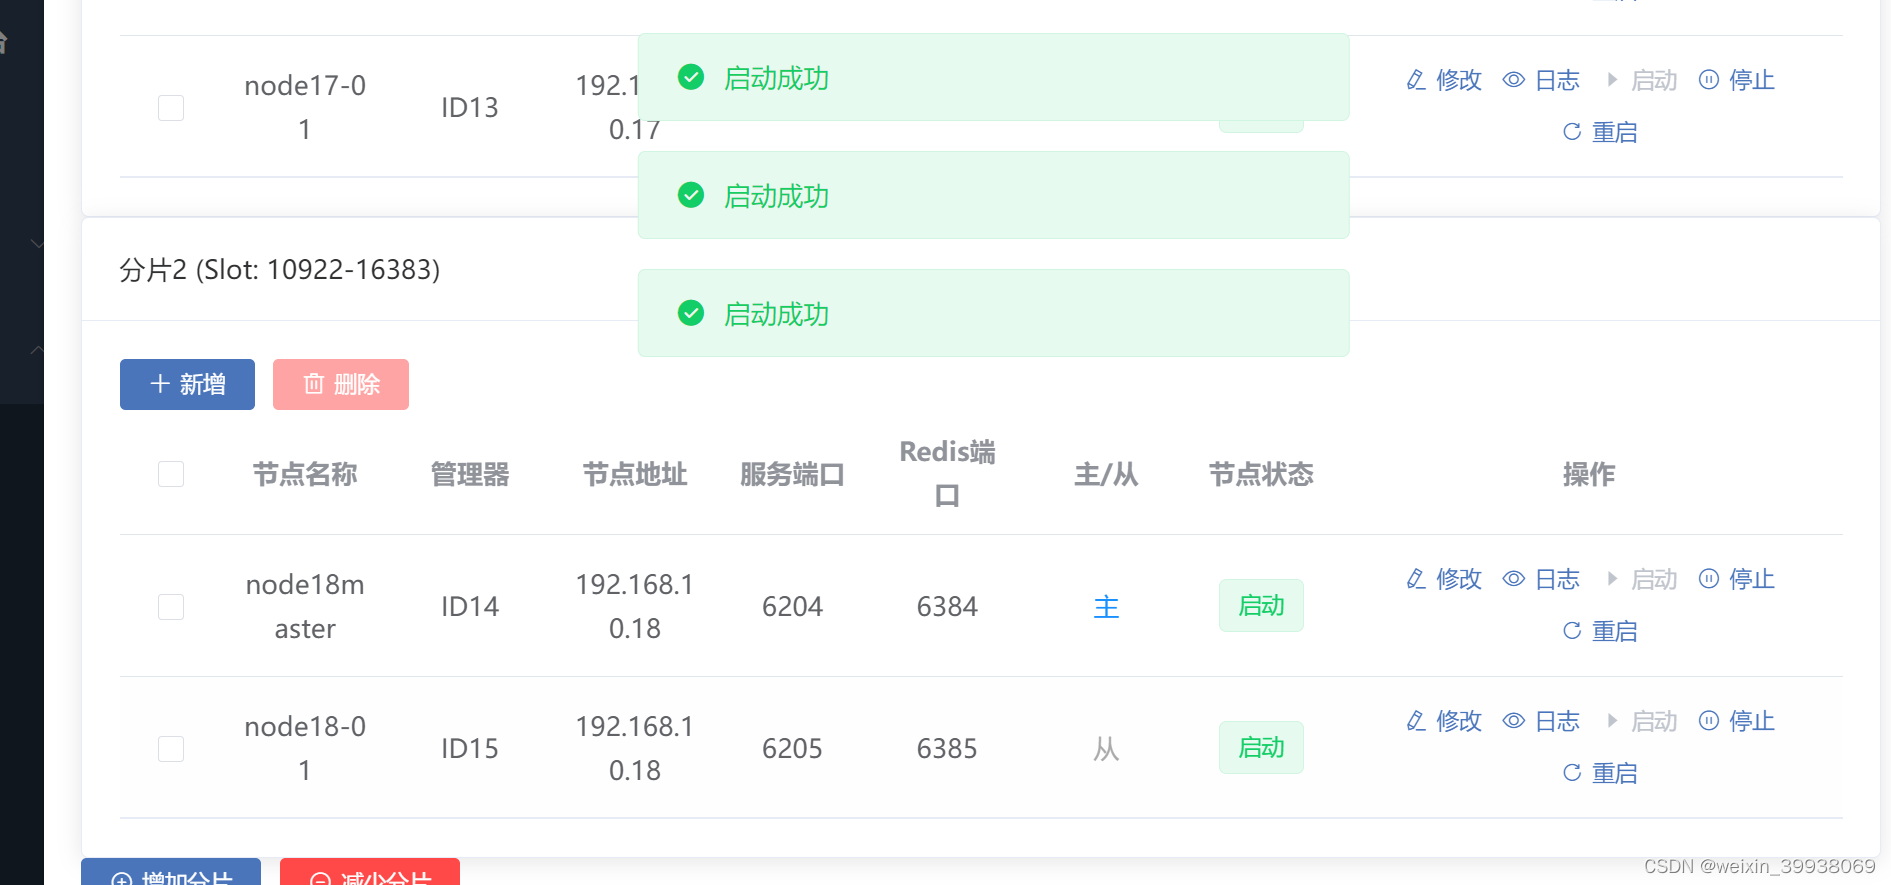
启动后果一会刷新一下状态,看看集群是否正常:
安装 Prometheus Exporter
之前已经上传了三个安装包,,上传后是需要到监控数据接口指定版本的。

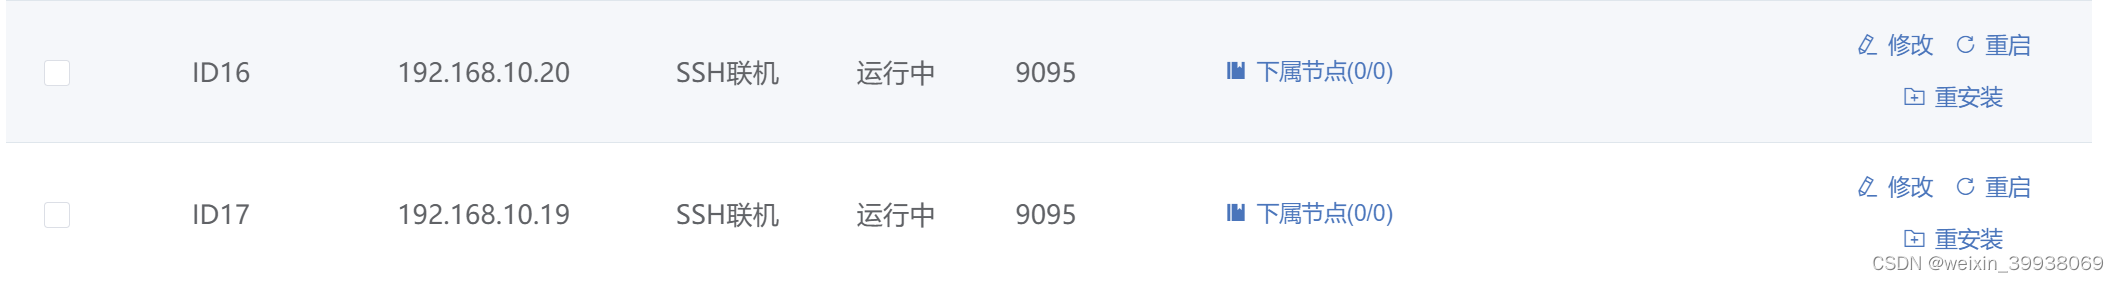
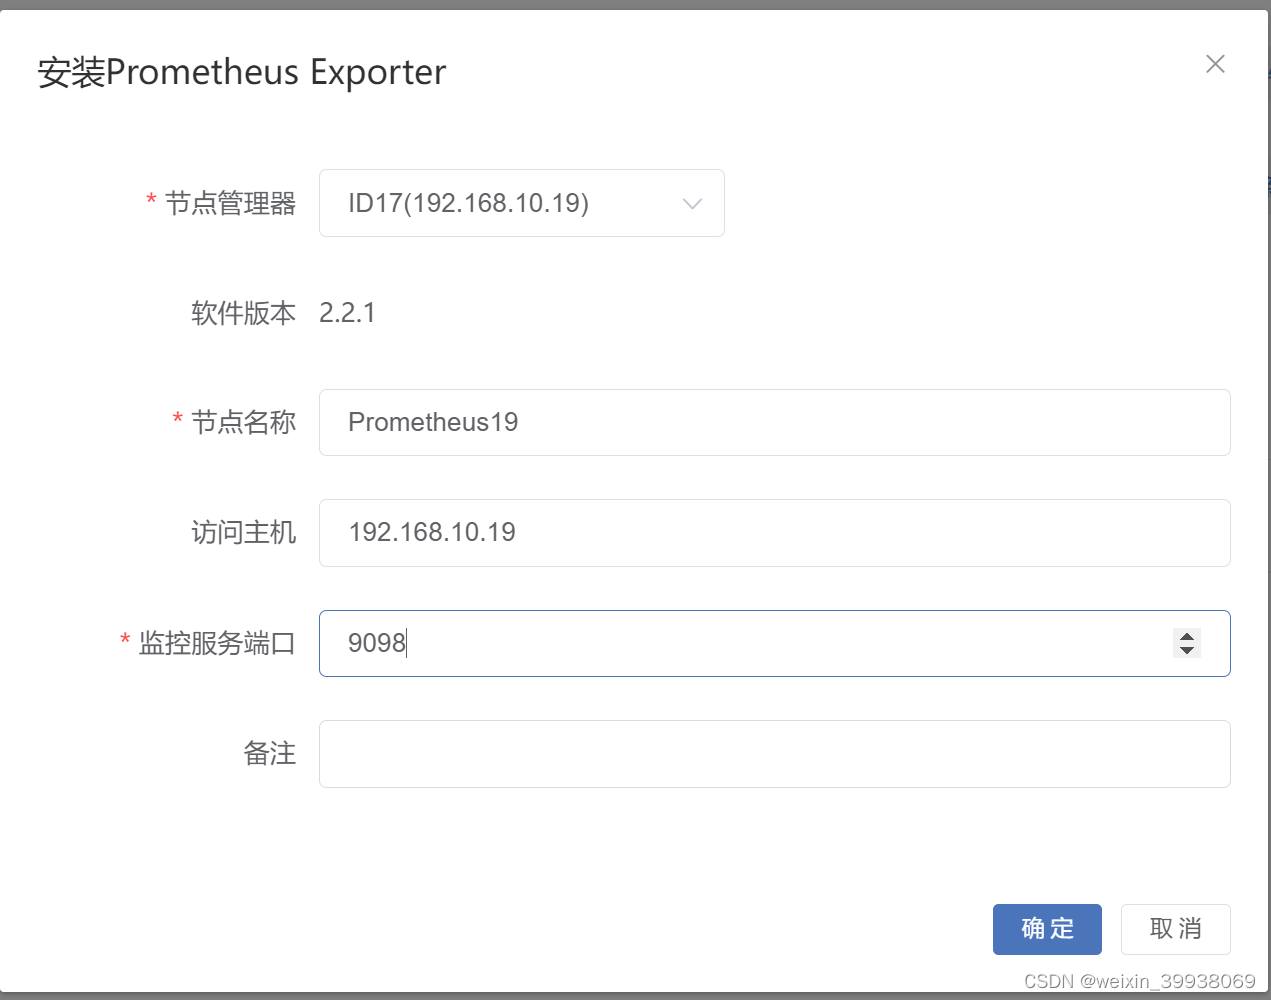
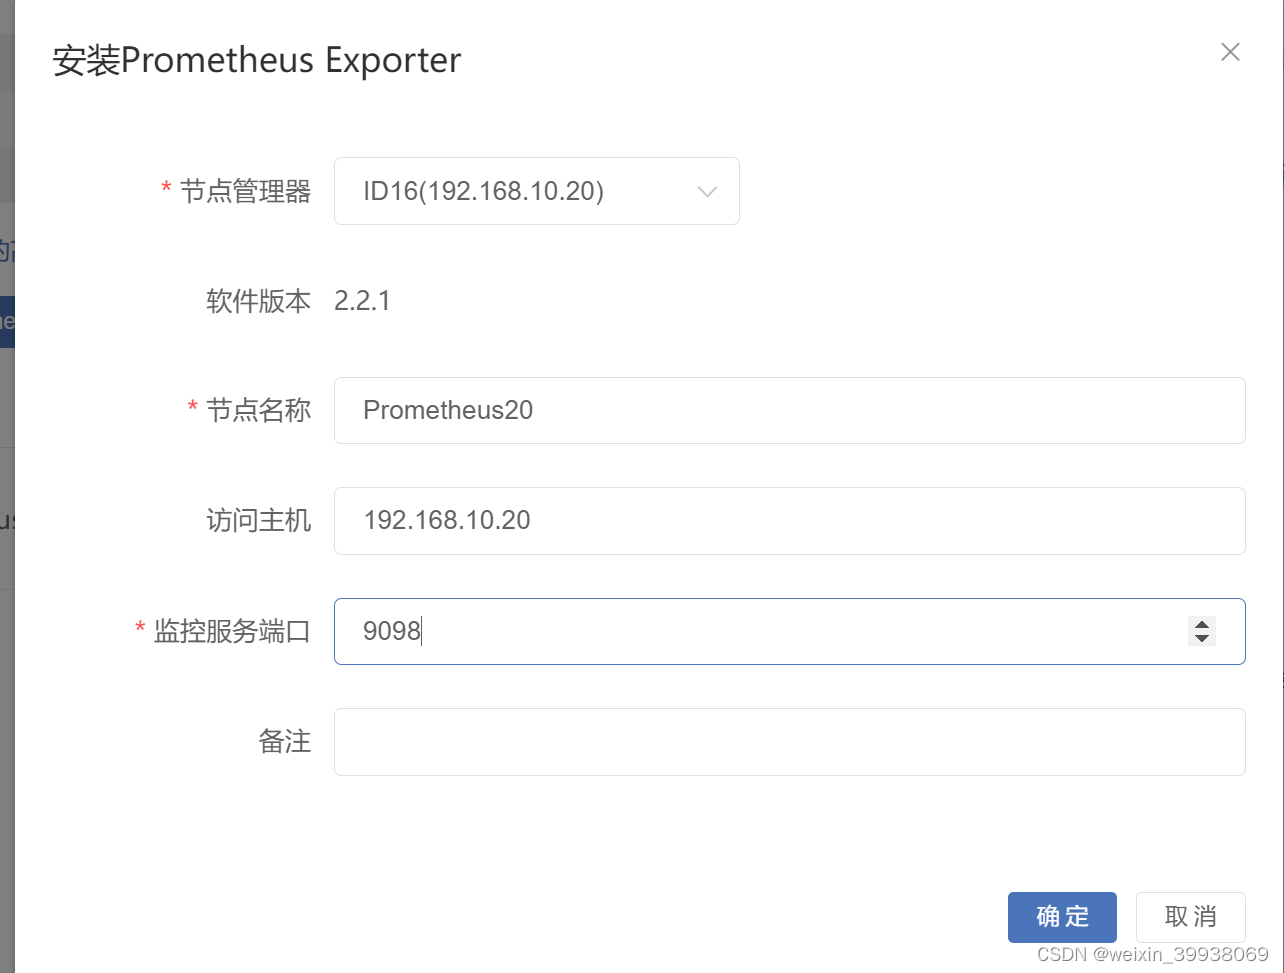
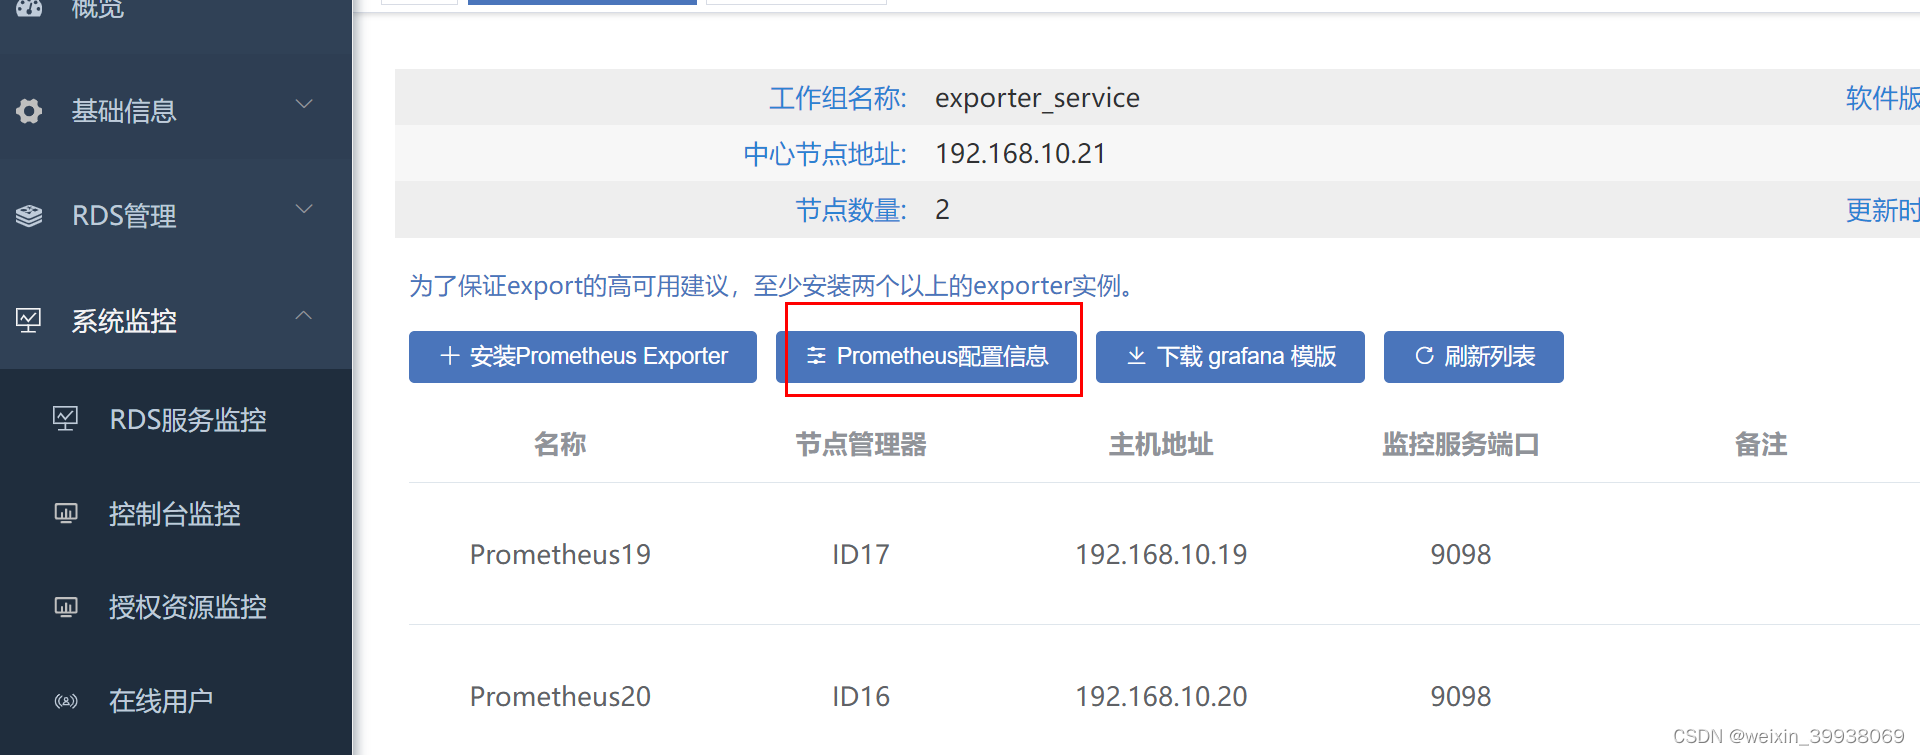
在节点管理器,新建两个节点,用于安装和配置普罗米修斯:
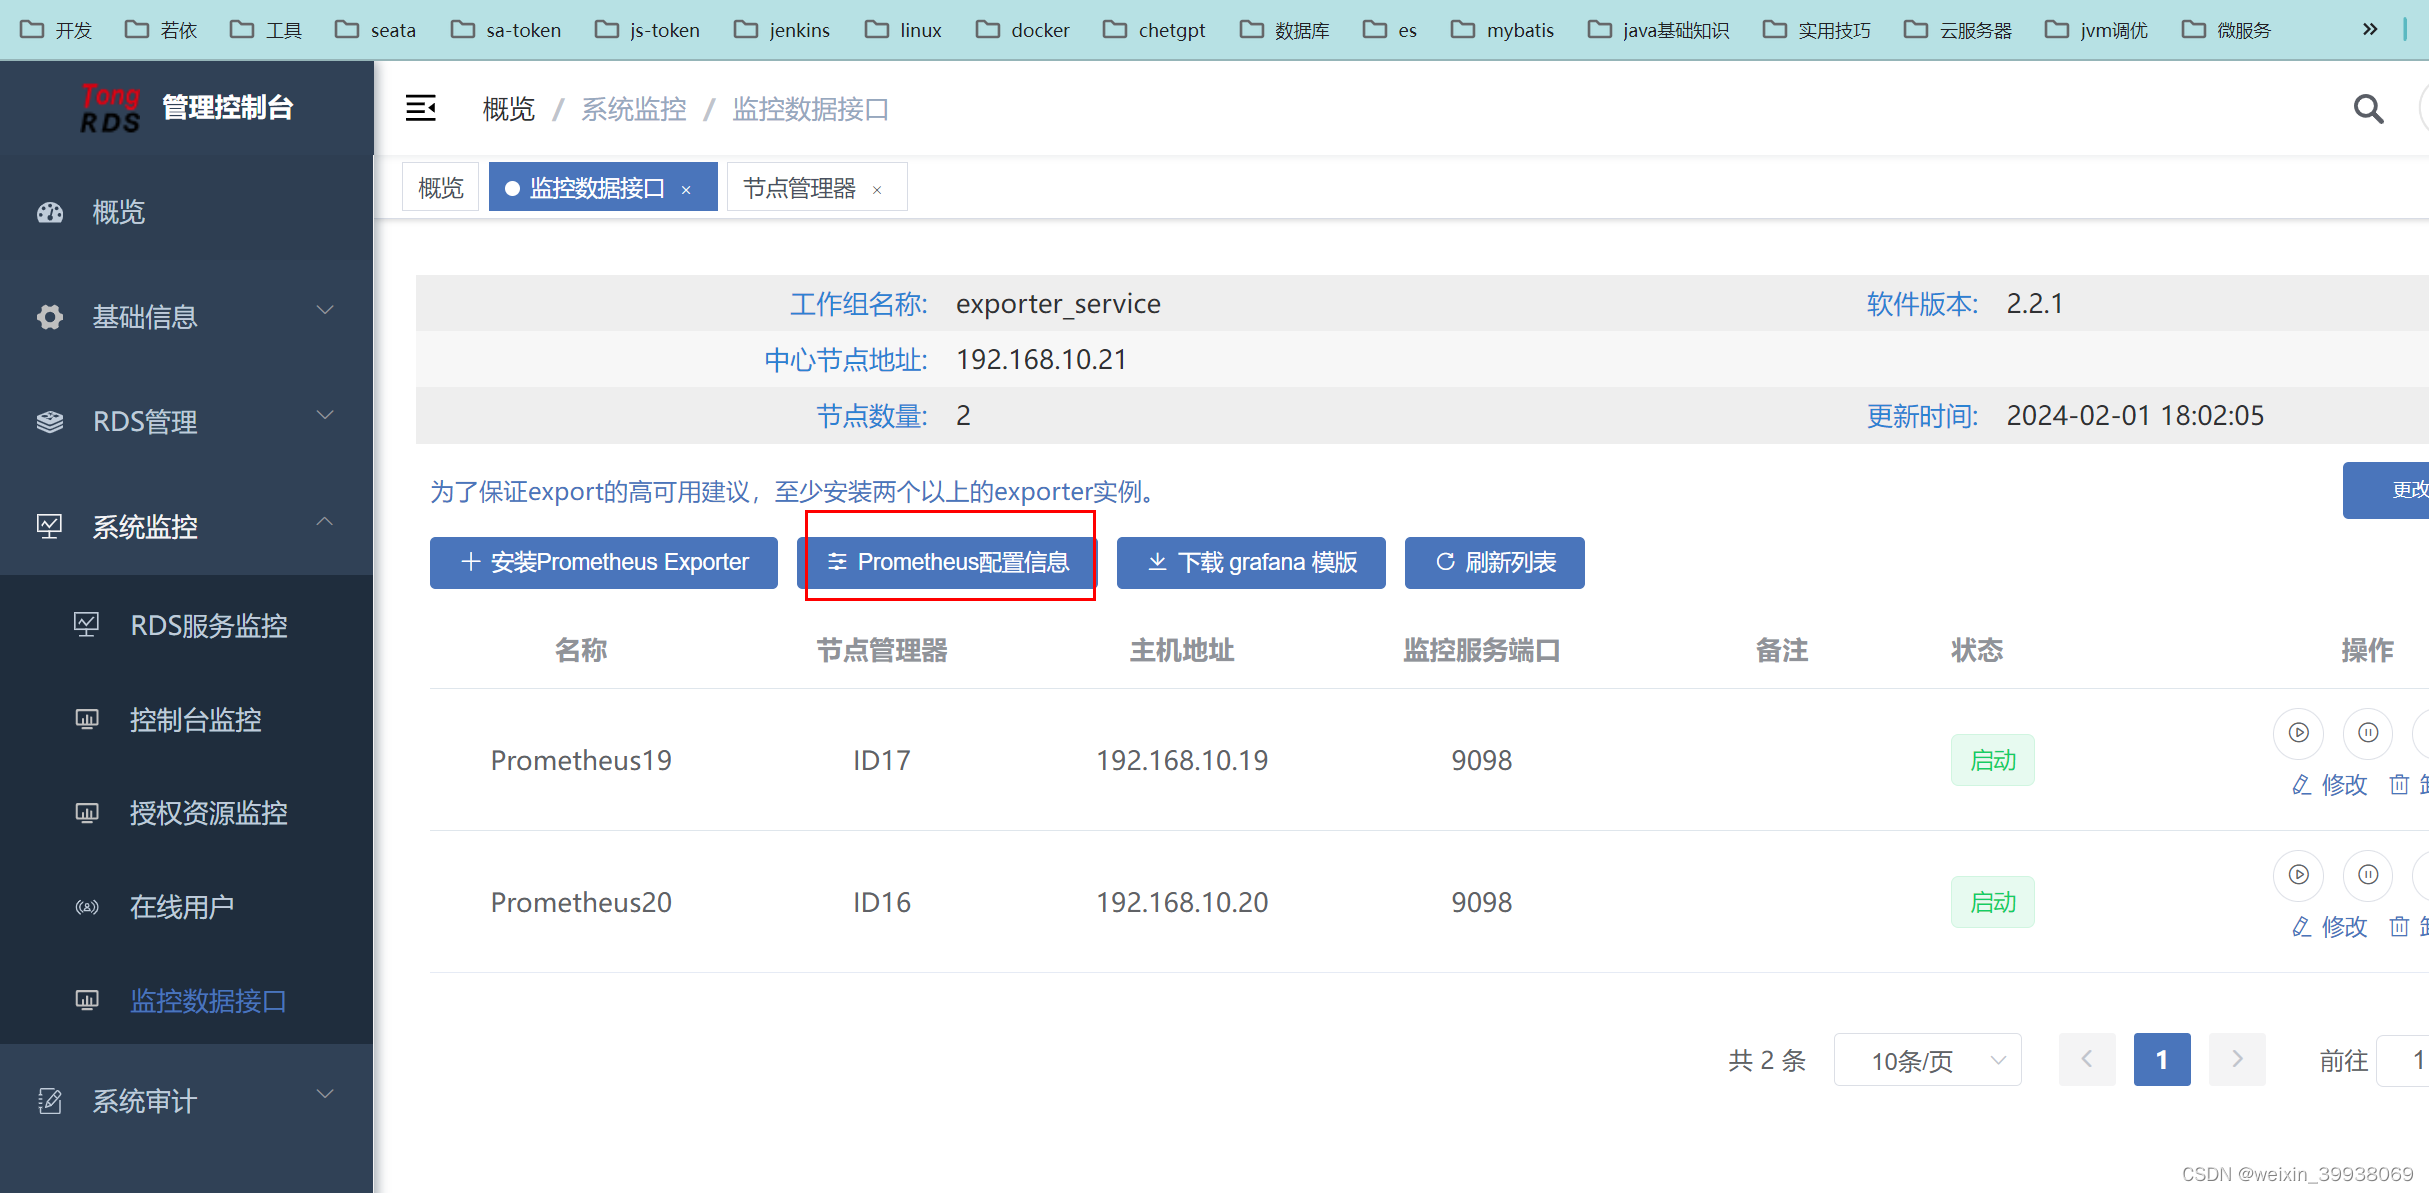
然后到监控数据接口,安装Prometheus Exporter
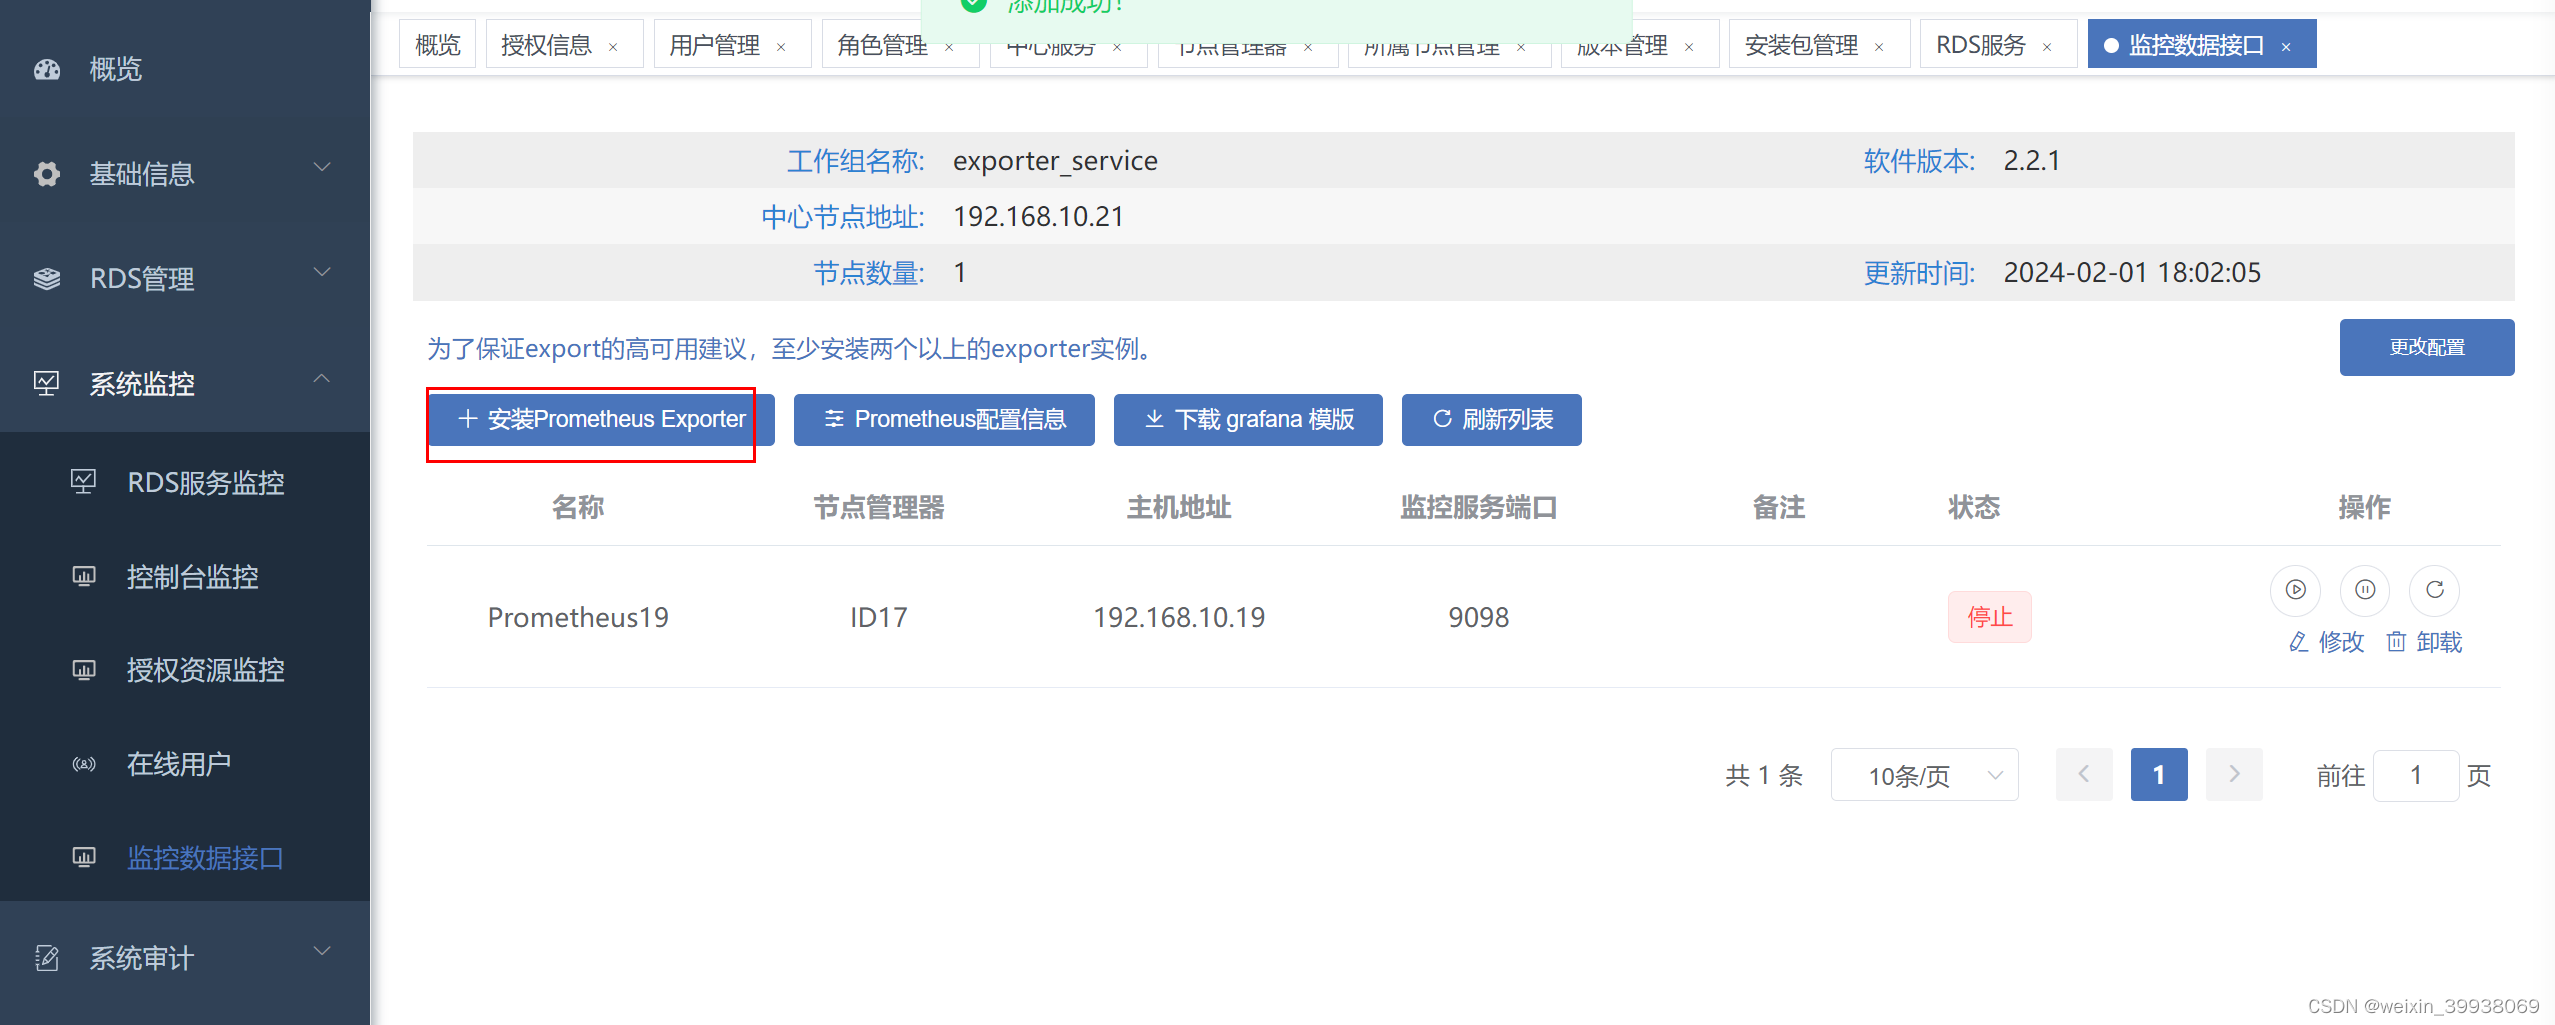
安装后点击启动或者重启按钮
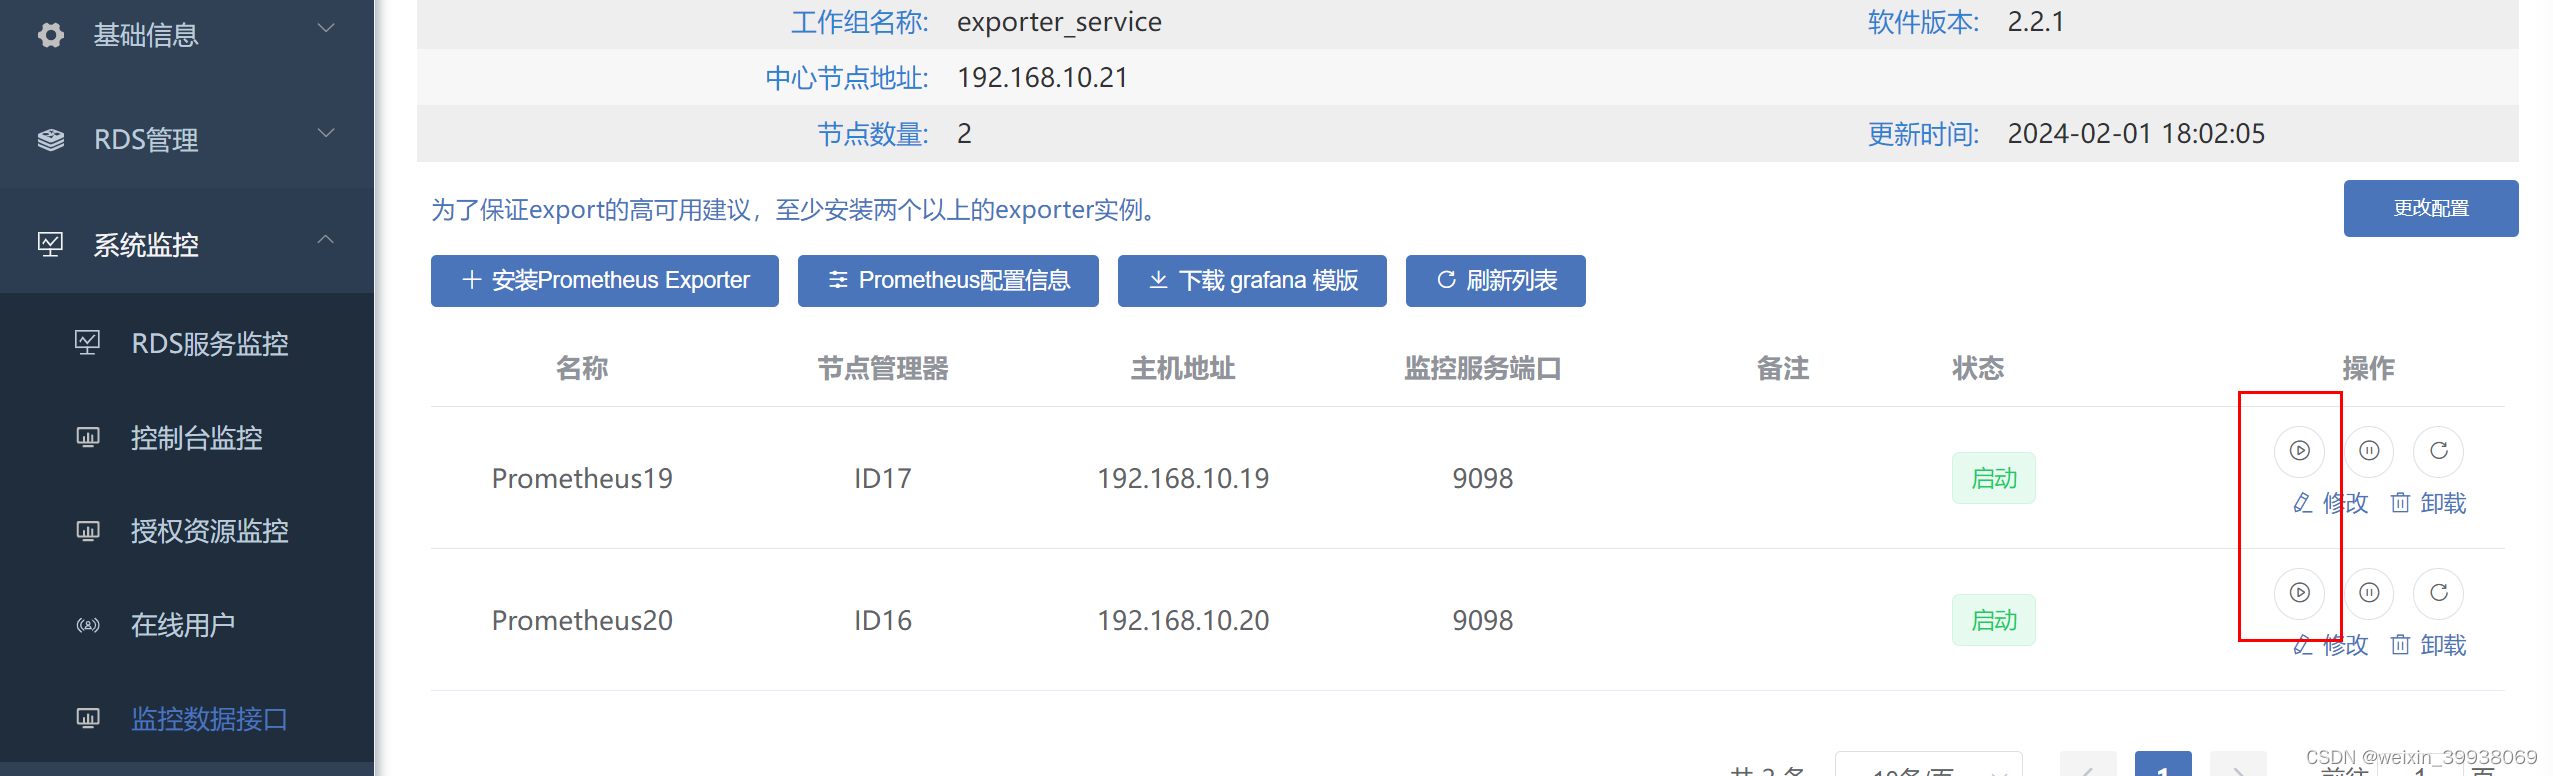
如果没有的话,可以先到节点管理器,重启对应节点
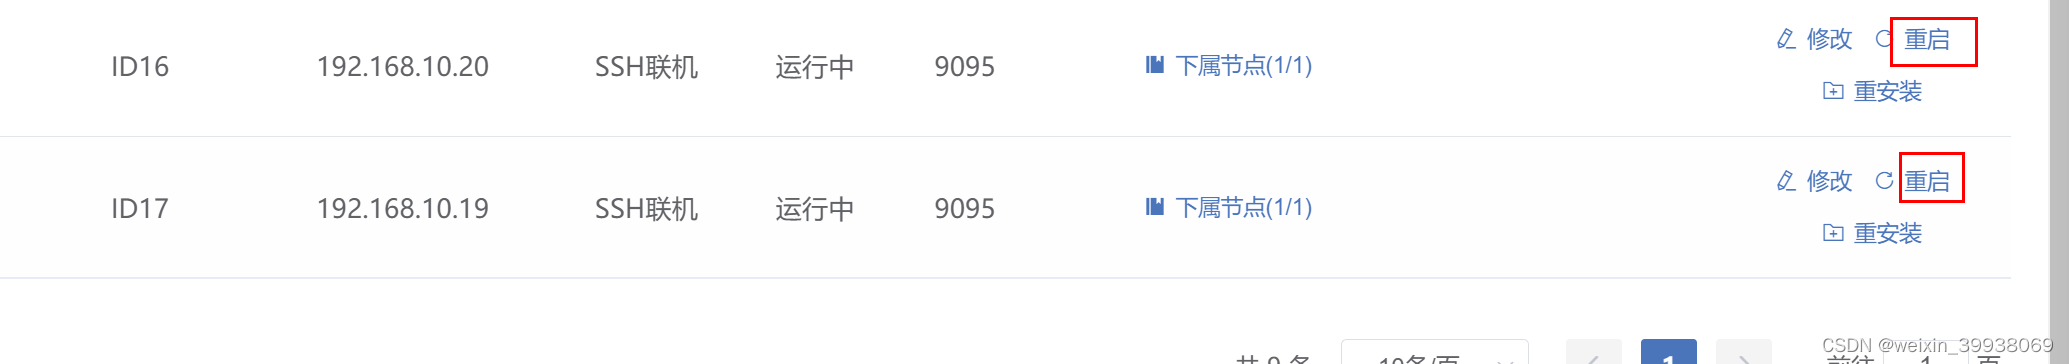
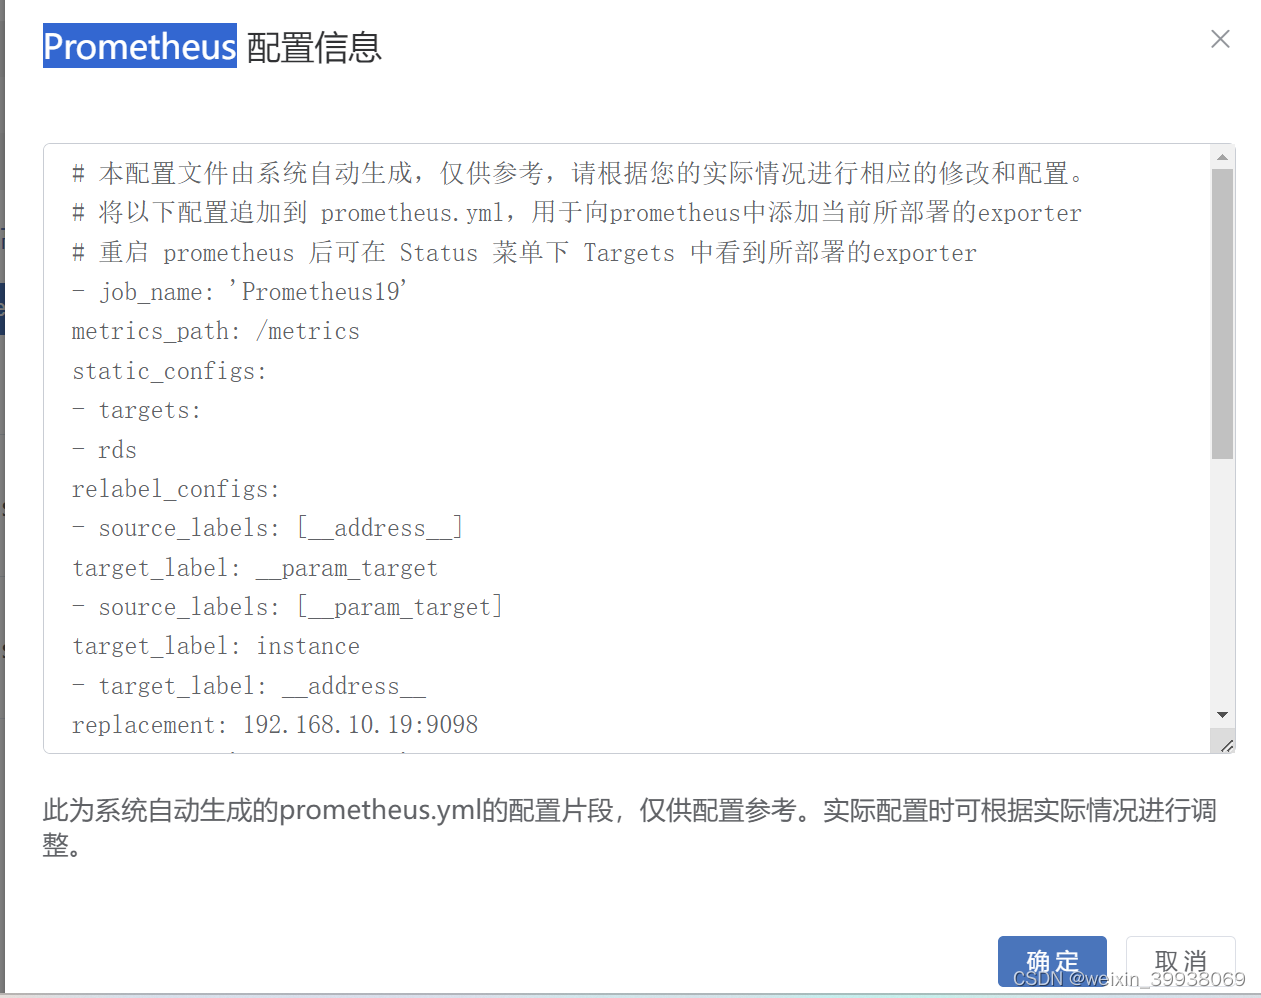
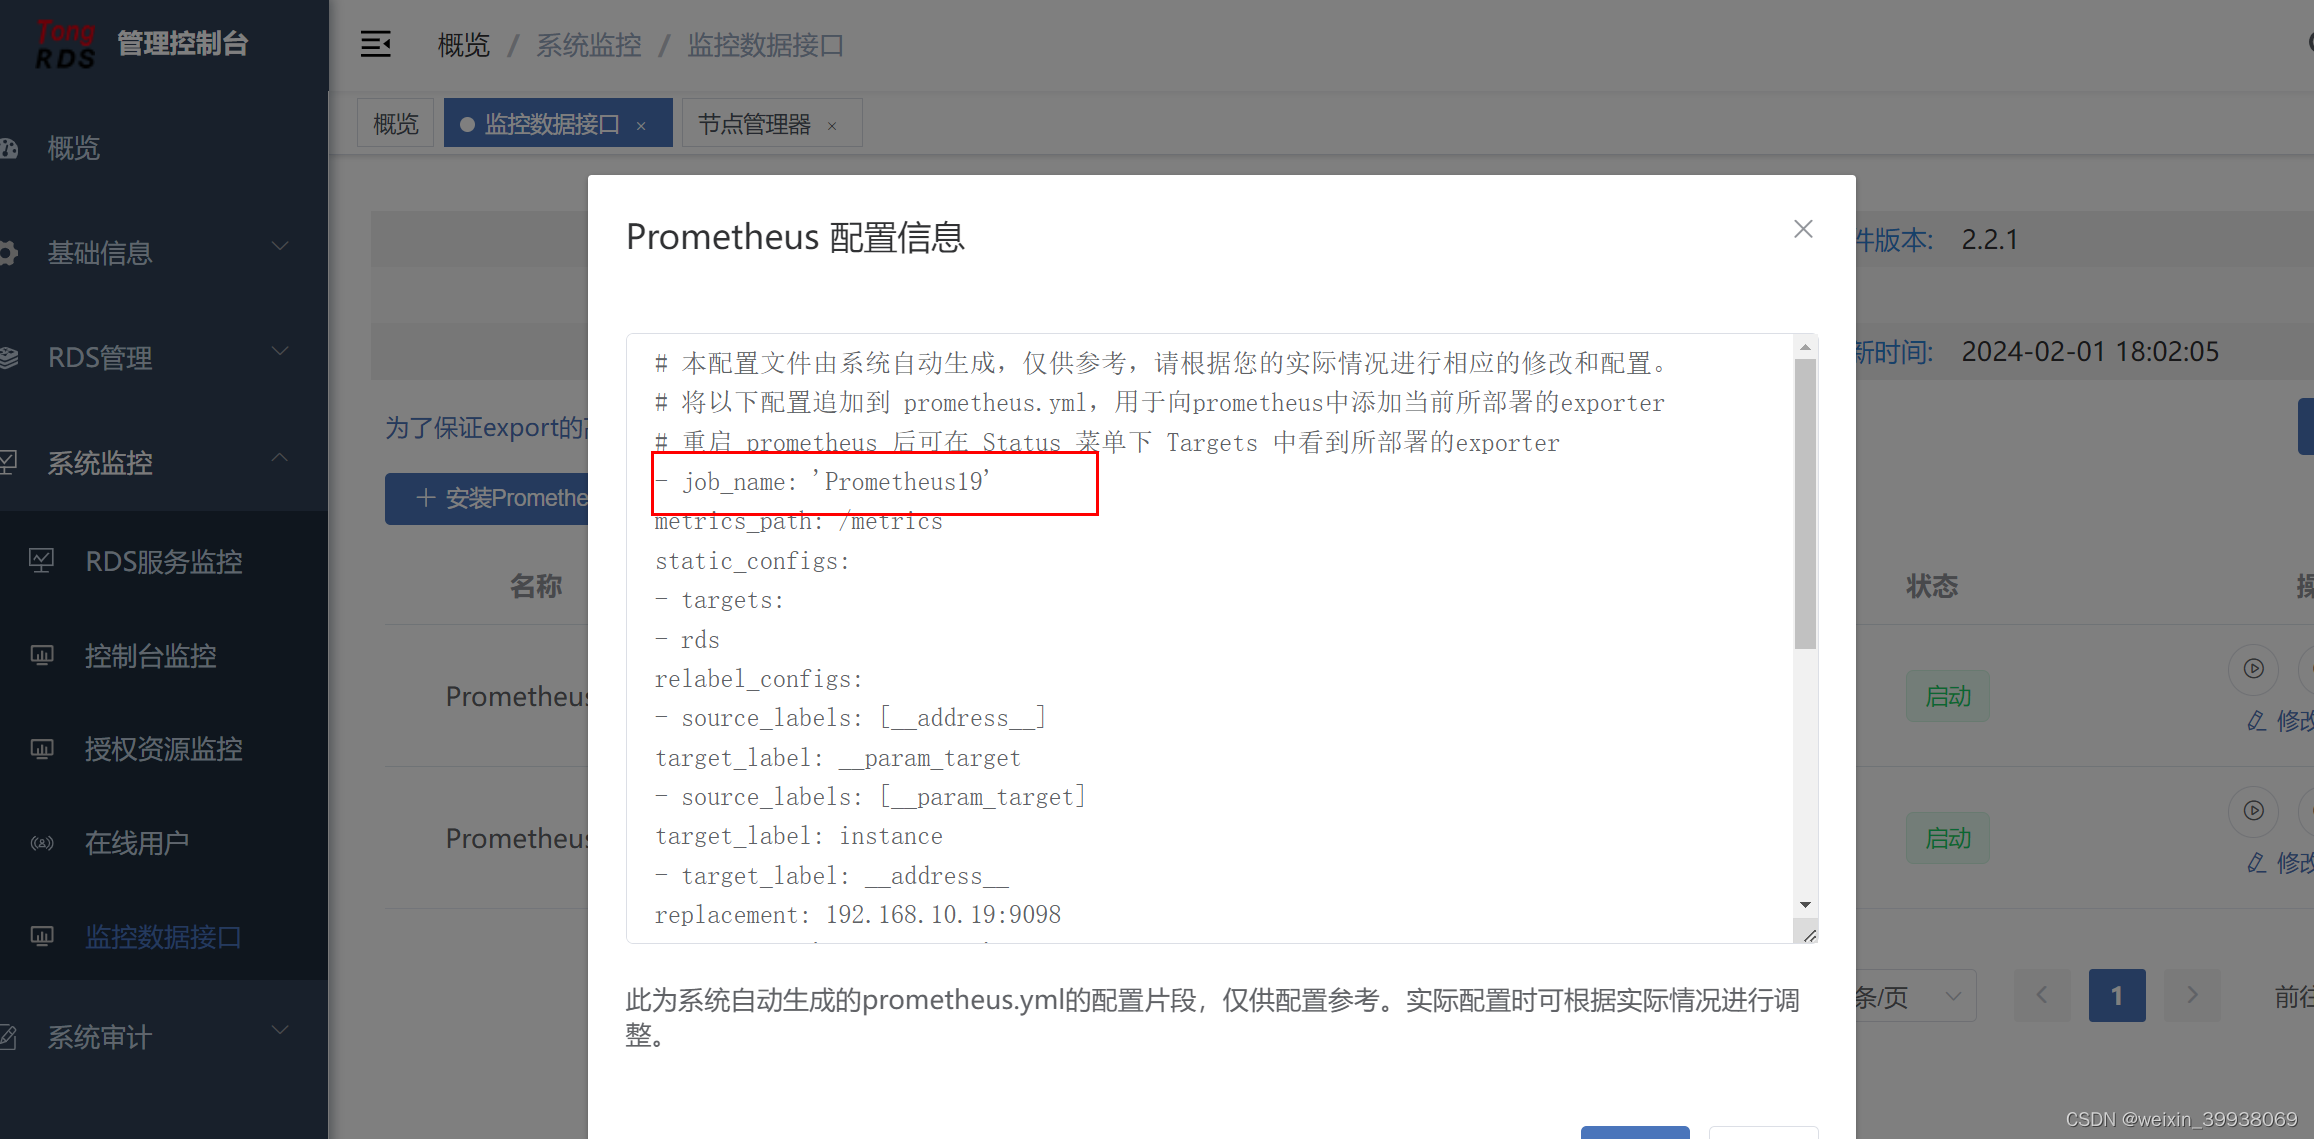
之后点击一下Prometheus配置信息,看看是否自动生成了配置:
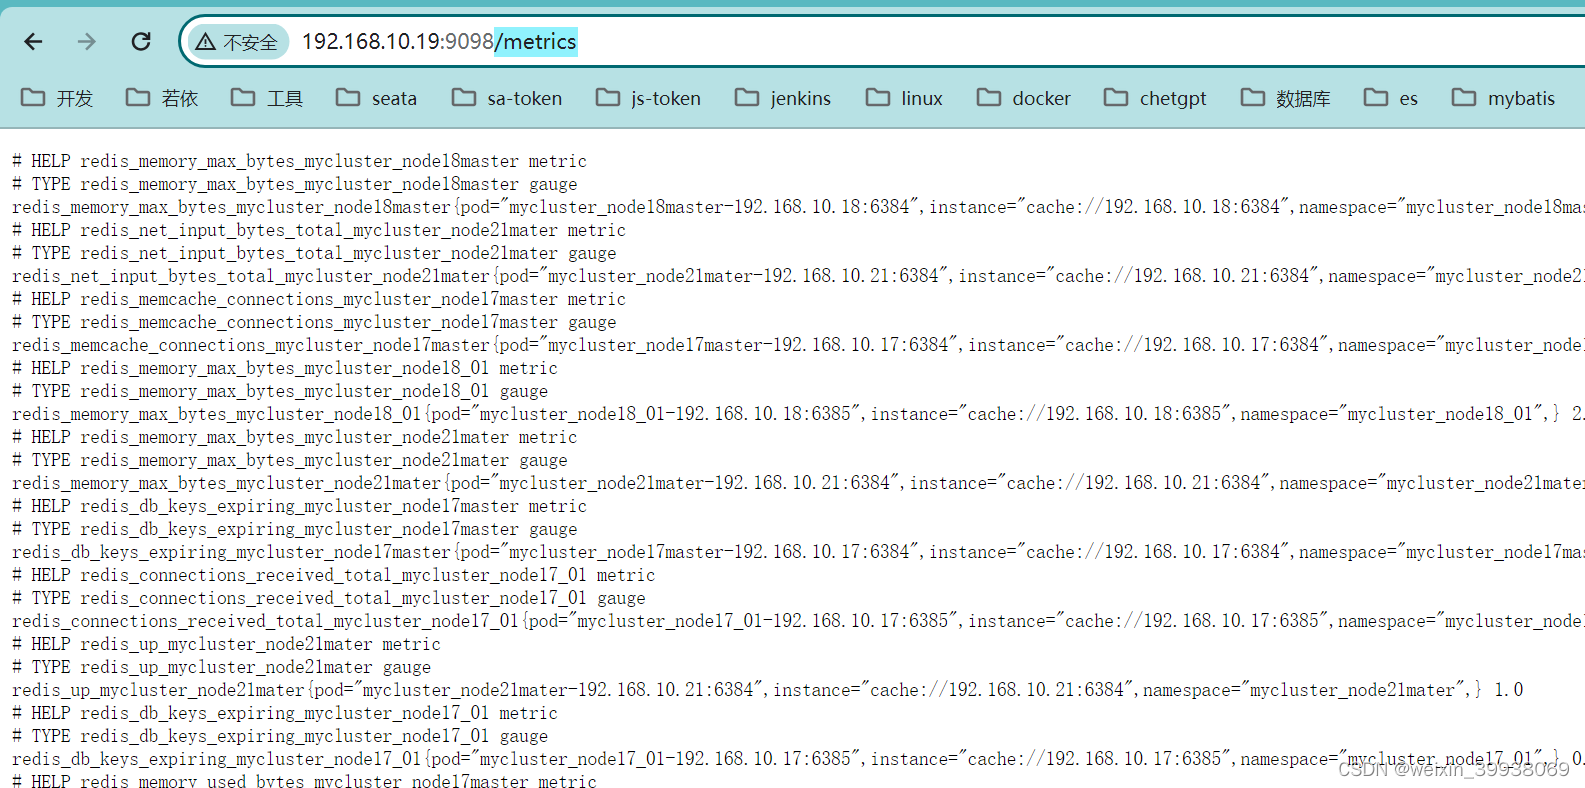
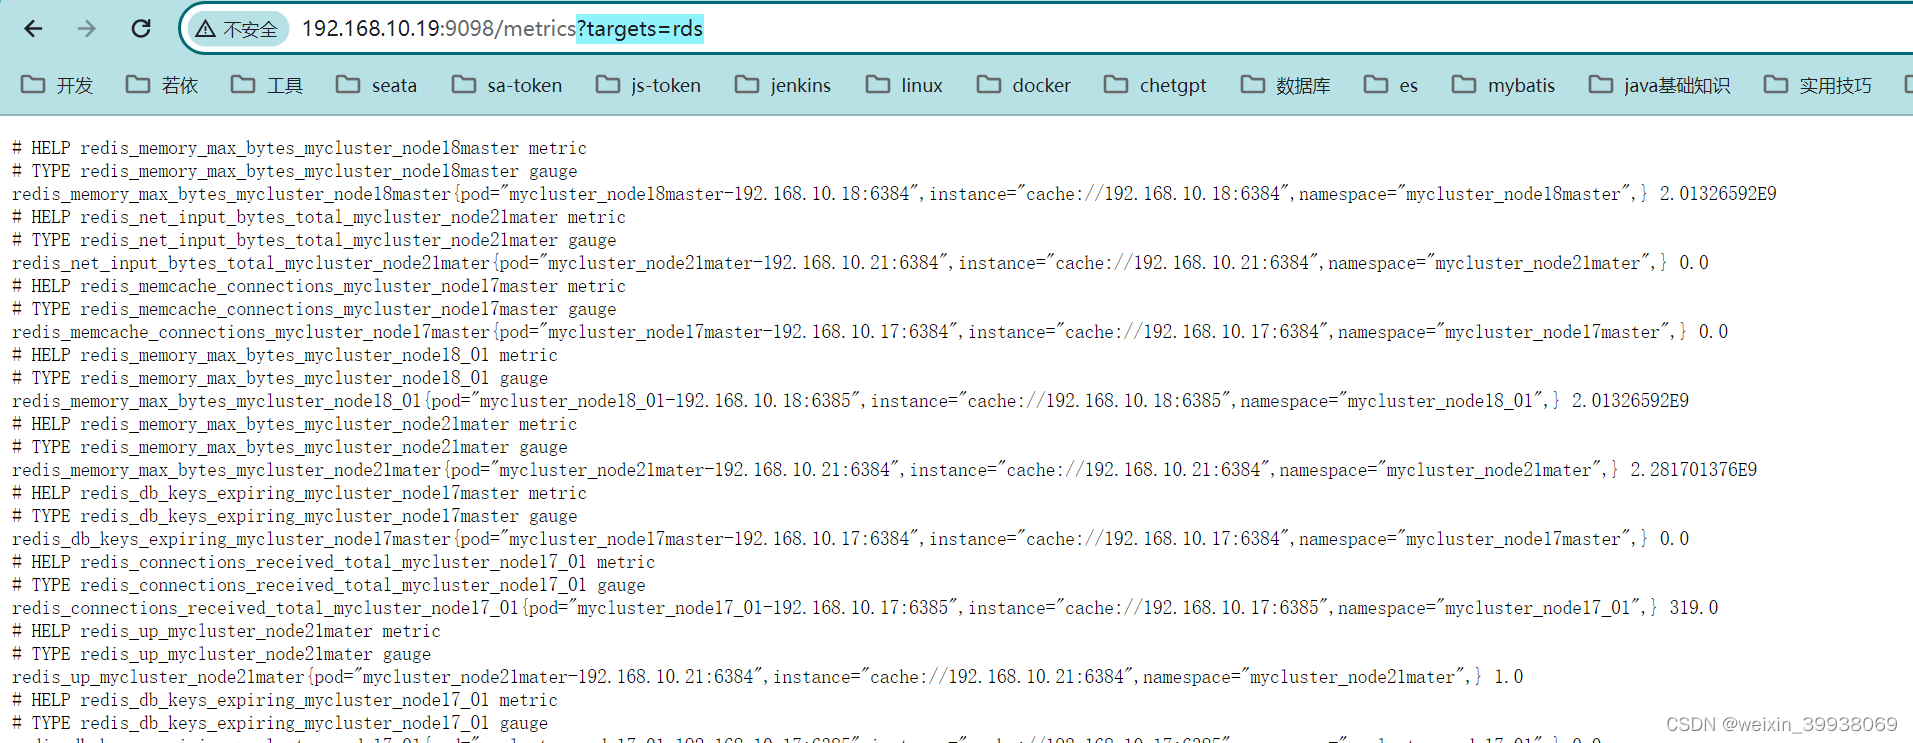
访问对应节点:设置的端口/metrics
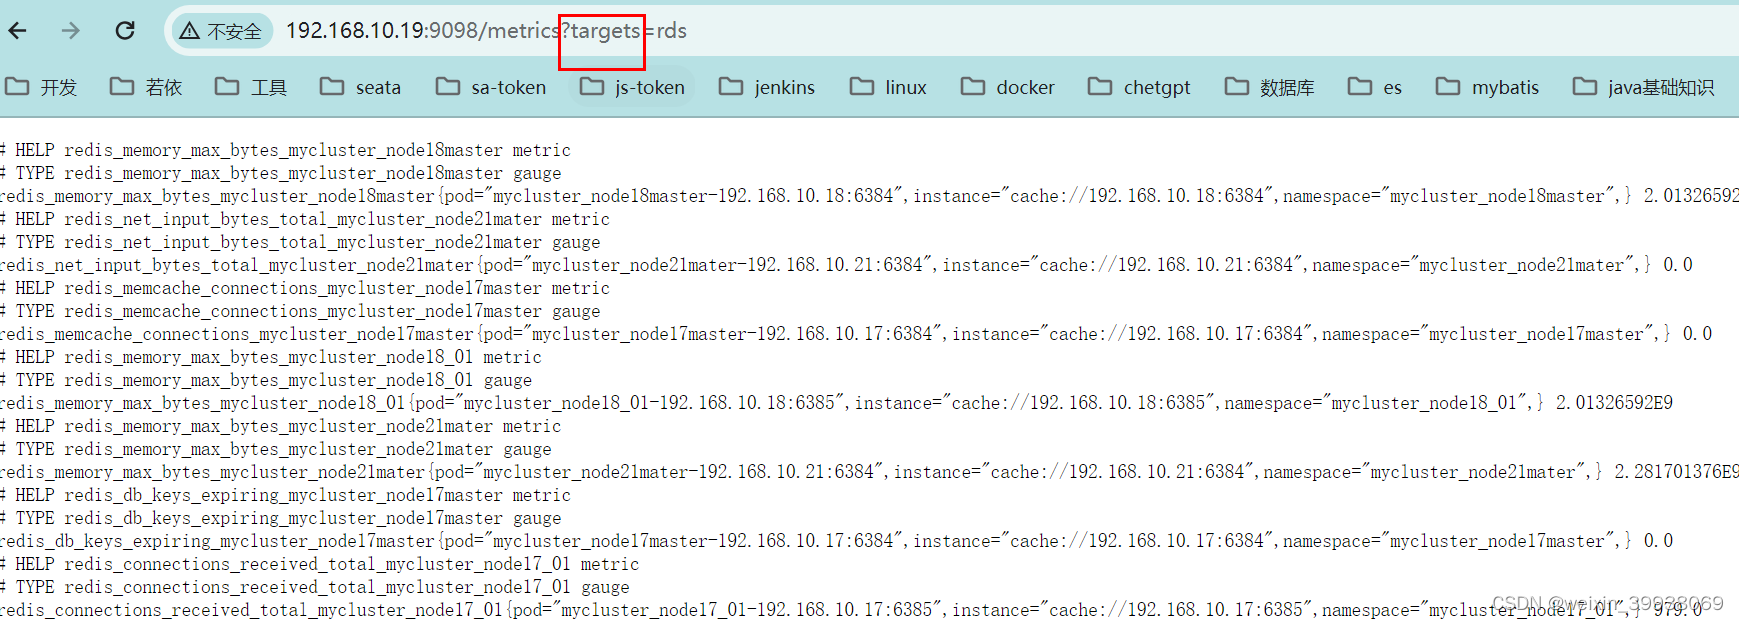
访问对应节点:设置的端口/metrics?targets=rds
安装 Prometheus
本次安装借鉴csdn帖子
https://blog.csdn.net/weixin_45551608/article/details/119667386
所有服务器关闭防火墙和SElinux
systemctl stop firewalld
setenforce 0
20,21,52服务器修改一下host文件,配置如下:
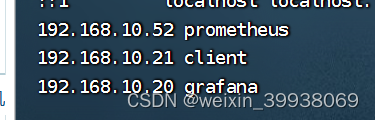
21是我后面改动的(因为安装包的问题重装了一次prometheus console),client的话其实建议可以用prometheus console建的节点的服务器ip,例如下图的19,20是我自己选的grafana的安装服务器ip(grafana是可视化工具)
所有服务器安装ntpdate
yum install ntpdate -y
同步时间
ntpdate cn.ntp.org.cn
date
下载安装包
下载地址:https://prometheus.io/download/
我用的是这个
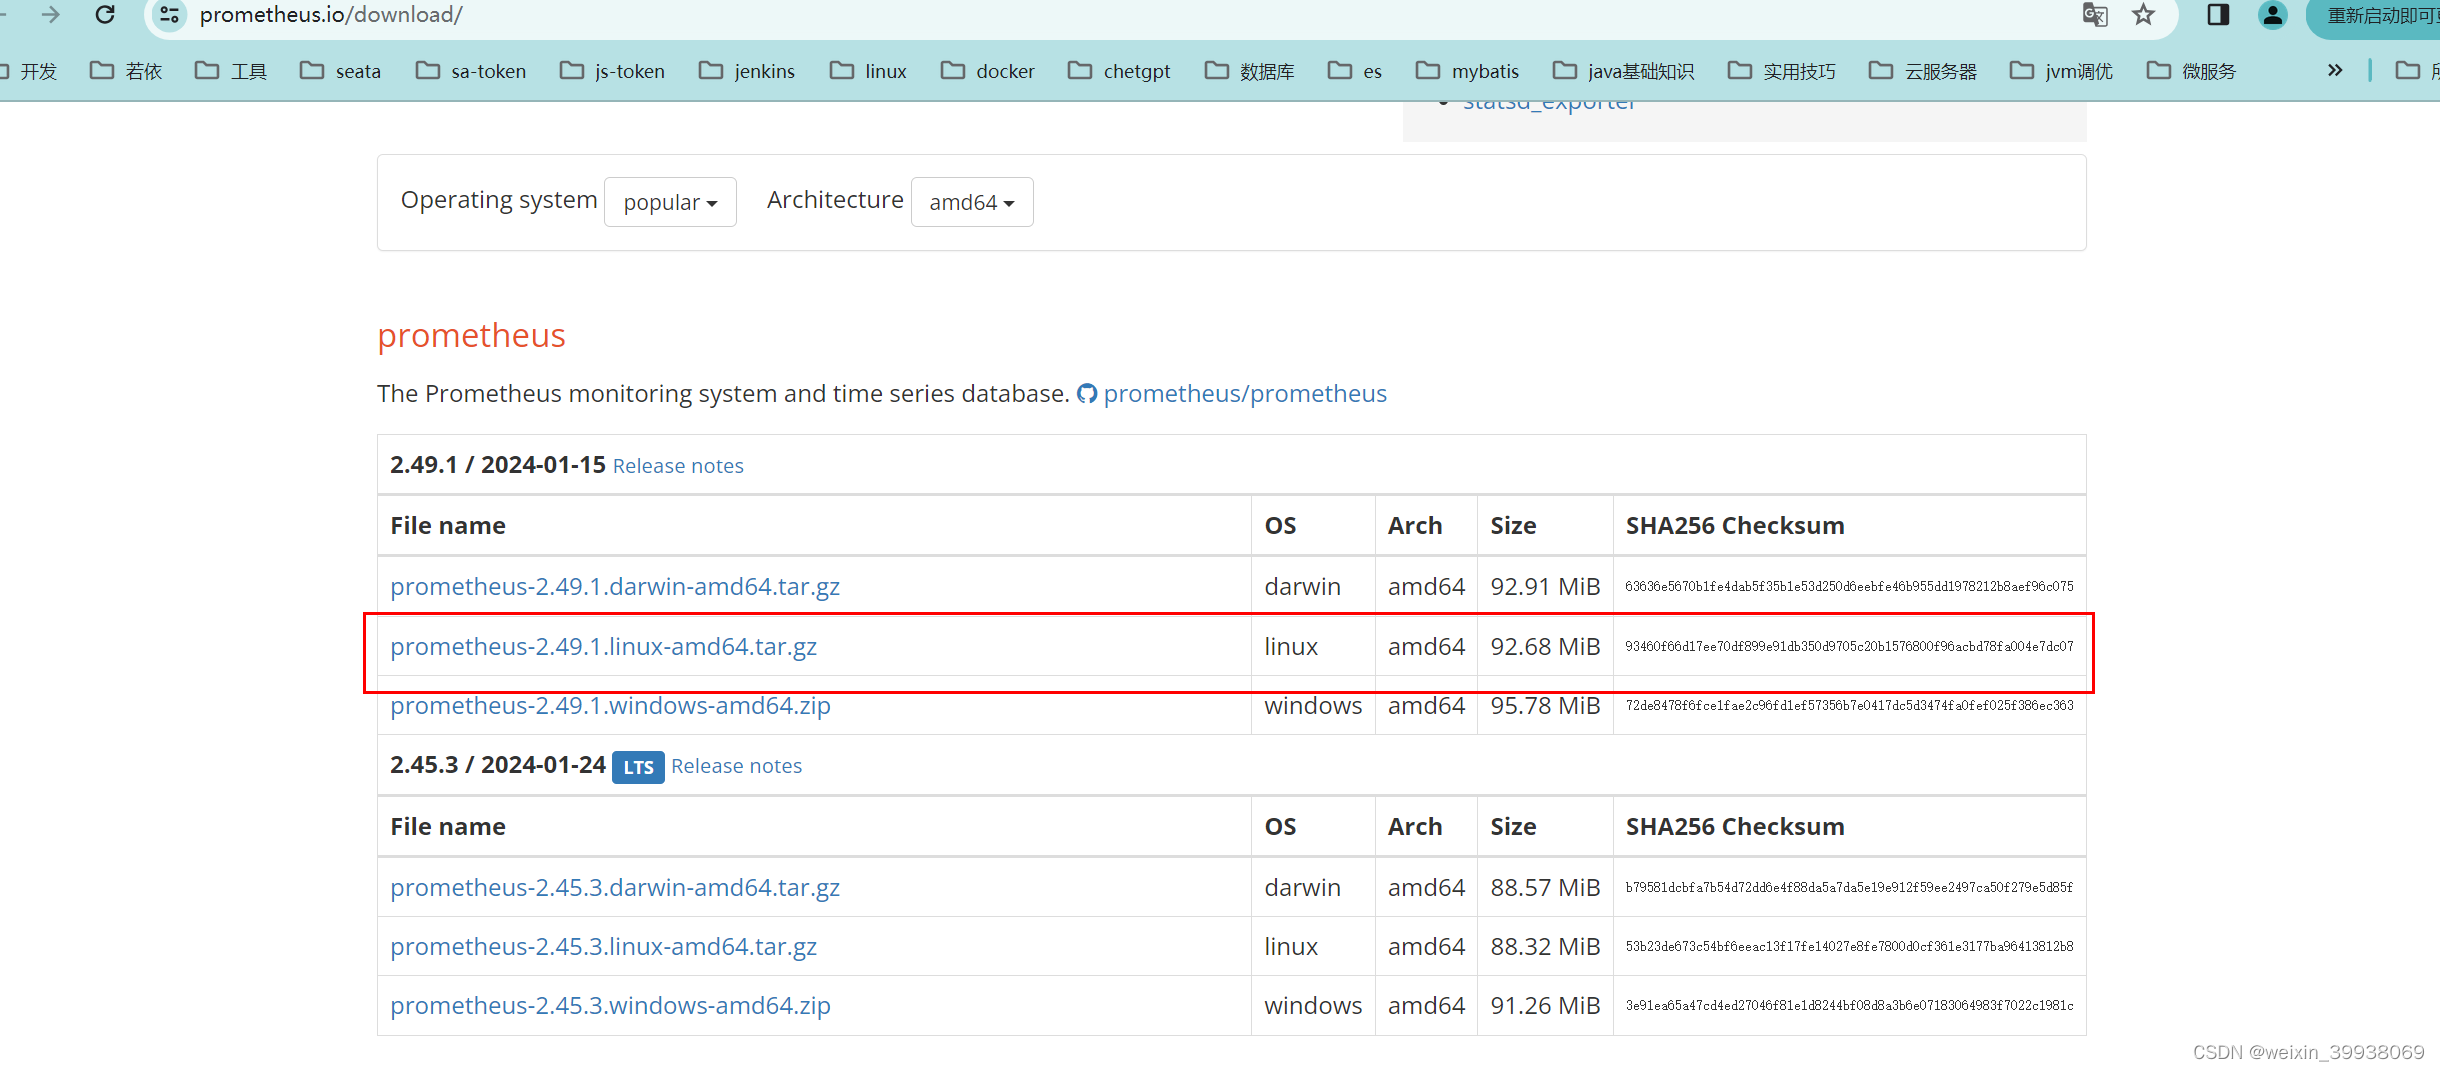
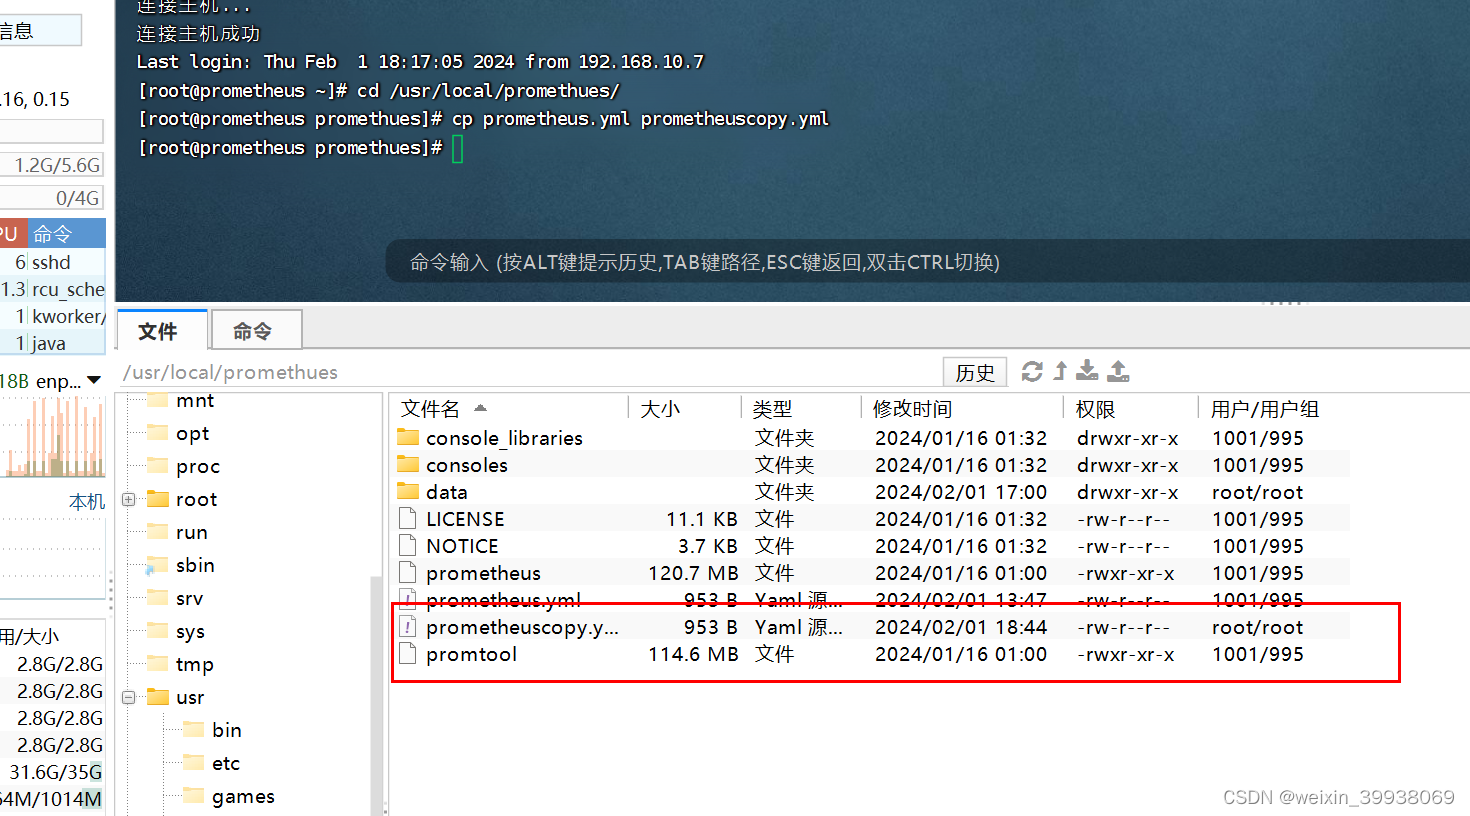
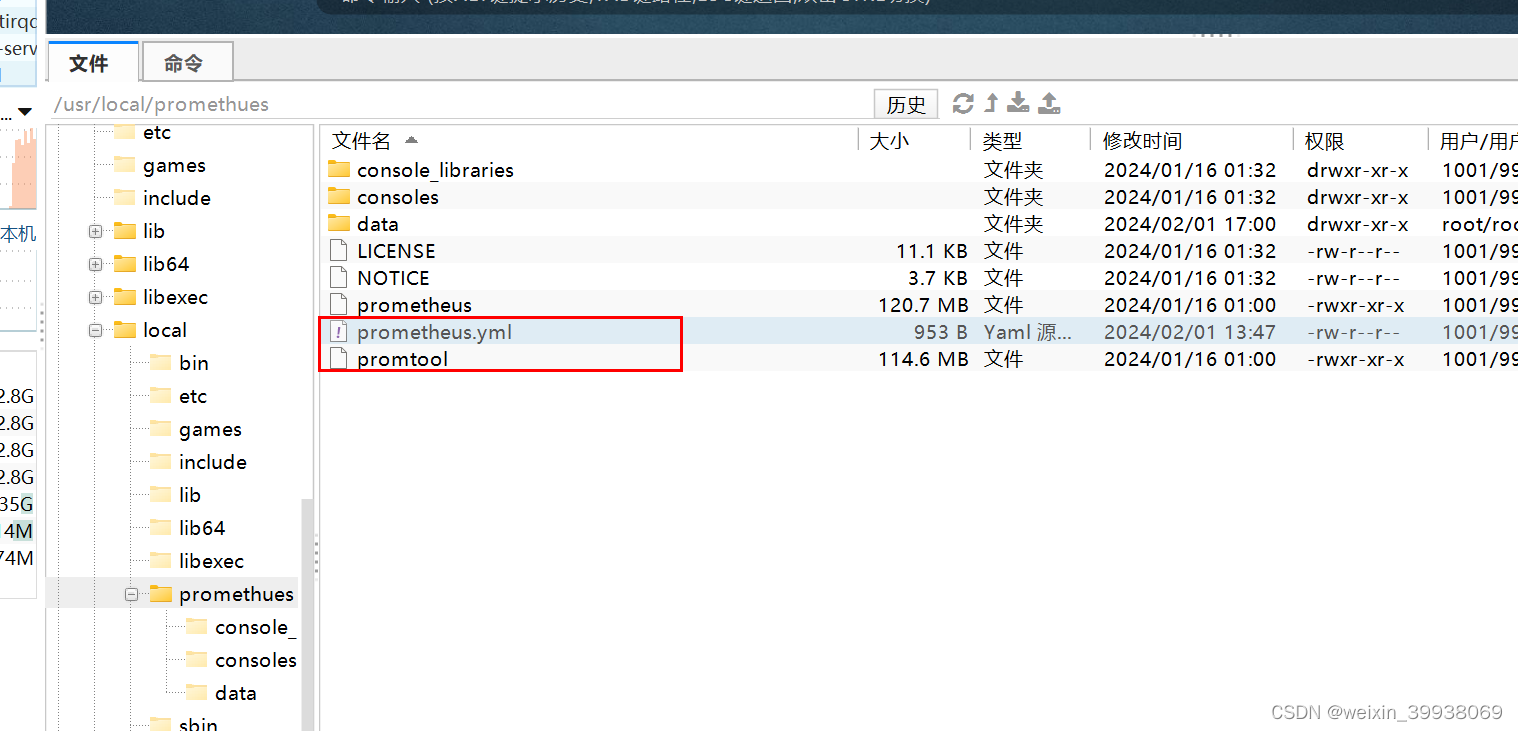
下载完解压,然后移动到/usr/local/promethues(一定要移动过去,不然下一步执行启动会出错)
mv prometheus-2.29.1.linux-amd64 /usr/local/promethues
到控制台复制一下配置信息
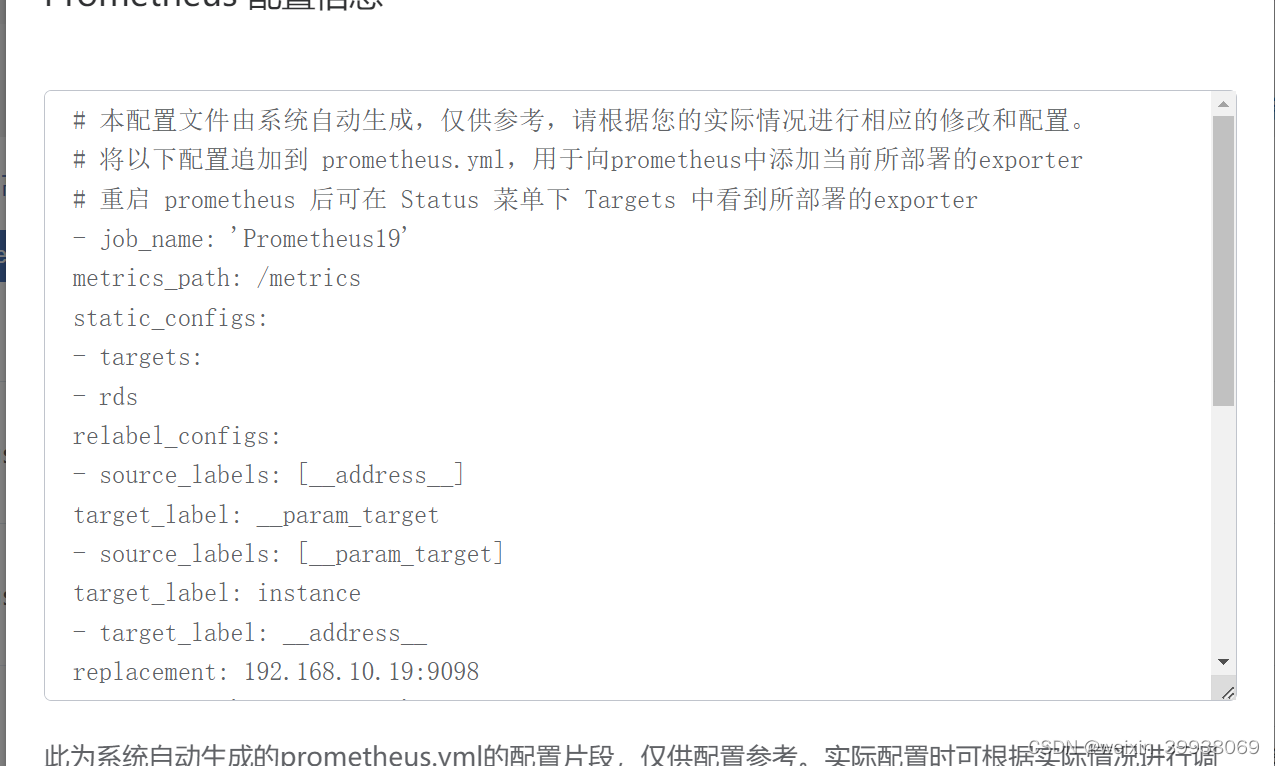
备份并vi一下promethues.yml,把配置粘贴进去,注意缩进(可以借鉴我这一份,改一改ip和对应的jobname即可)
global:
  scrape_interval: 15s        # Set the scrape interval to every 15 seconds. Default is every 1 minute.
  evaluation_interval: 15s    # Evaluate rules every 15 seconds. The default is every 1 minute.
  # scrape_timeout is set to the global default (10s).

alerting:
  alertmanagers:
    - static_configs:
        - targets:
          # - alertmanager:9093

rule_files:
  # - "first_rules.yml"
  # - "second_rules.yml"

scrape_configs:
  - job_name: "prometheus"
    # metrics_path defaults to '/metrics'
    # scheme defaults to 'http'.
    static_configs:
      - targets: ["localhost:9090"]

  - job_name: 'Prometheus19'
    metrics_path: /metrics
    static_configs:
      - targets:
        - rds
    relabel_configs:
      - source_labels: [__address__]
        target_label: __param_target
      - source_labels: [__param_target]
        target_label: instance
      - target_label: __address__
        replacement: 192.168.10.19:9098

  - job_name: 'Prometheus20'
    metrics_path: /metrics
    static_configs:
      - targets:
        - rds
    relabel_configs:
      - source_labels: [__address__]
        target_label: __param_target
      - source_labels: [__param_target]
        target_label: instance
      - target_label: __address__
        replacement: 192.168.10.20:9098
万一后面要改,或者改错了配置文件,可执行pkill prometheus 之后再改。
启动普罗米修斯和检查进程(分行执行)
cd /usr/local/promethues/

./prometheus --config.file="/usr/local/promethues/prometheus.yml" &

ps ef |grep promethues
访问服务器ip:9090,点击status,target,就可以看到我们配置的信息:
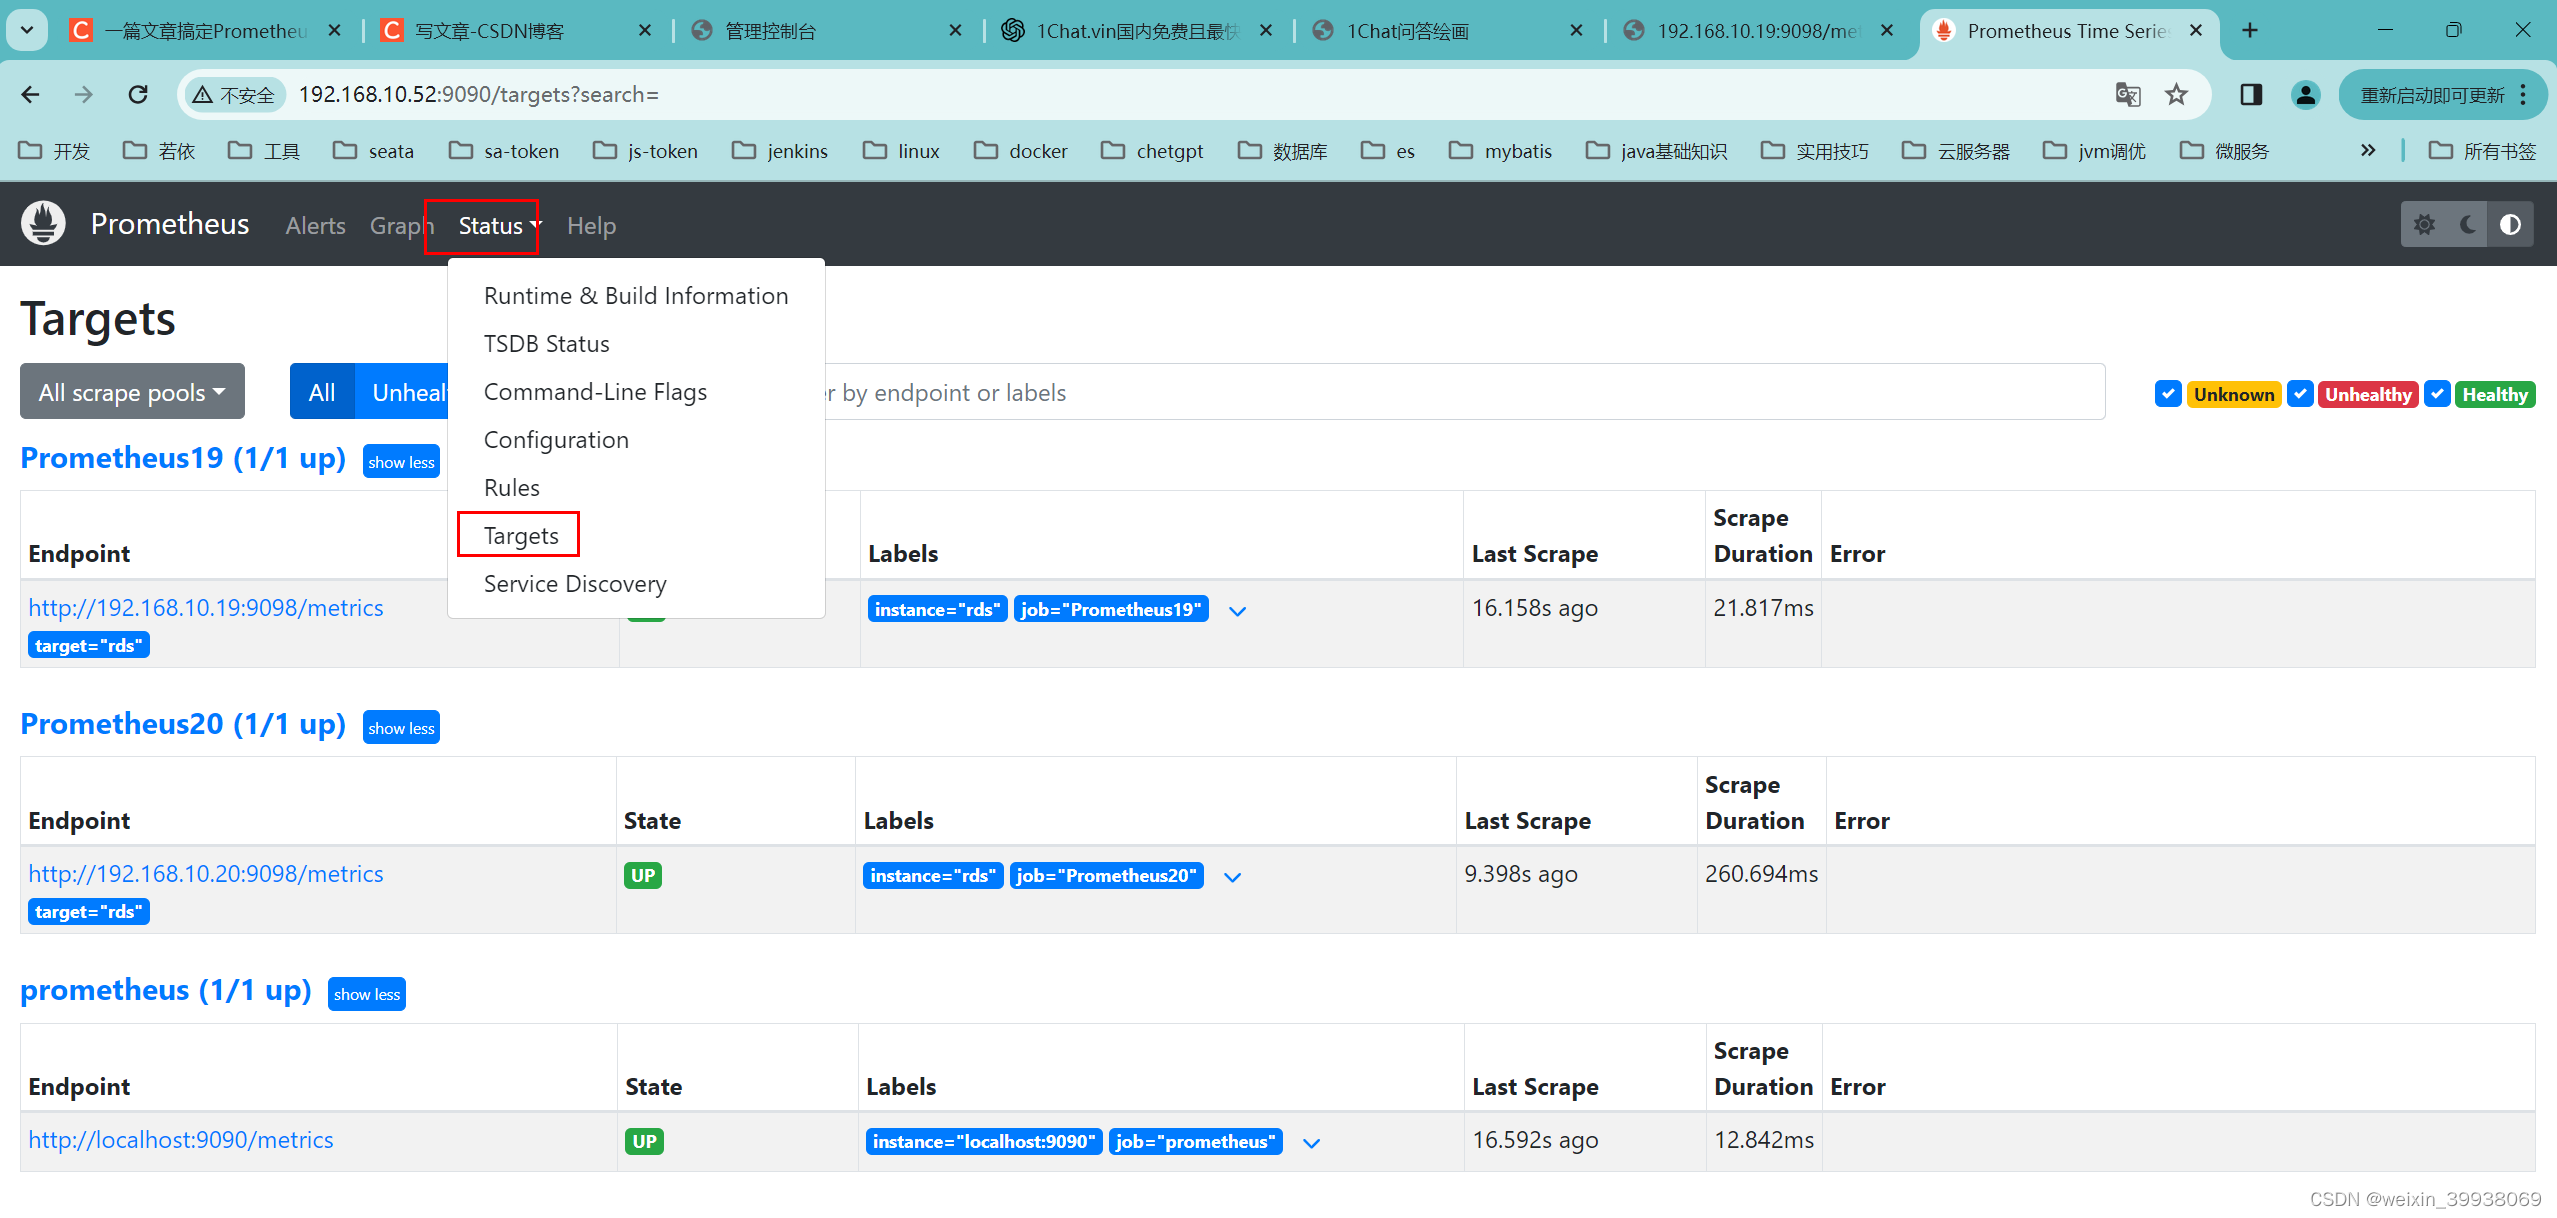
注意:直接点击访问,检查一下url的target,如果显示为空白,加一个s在target后面
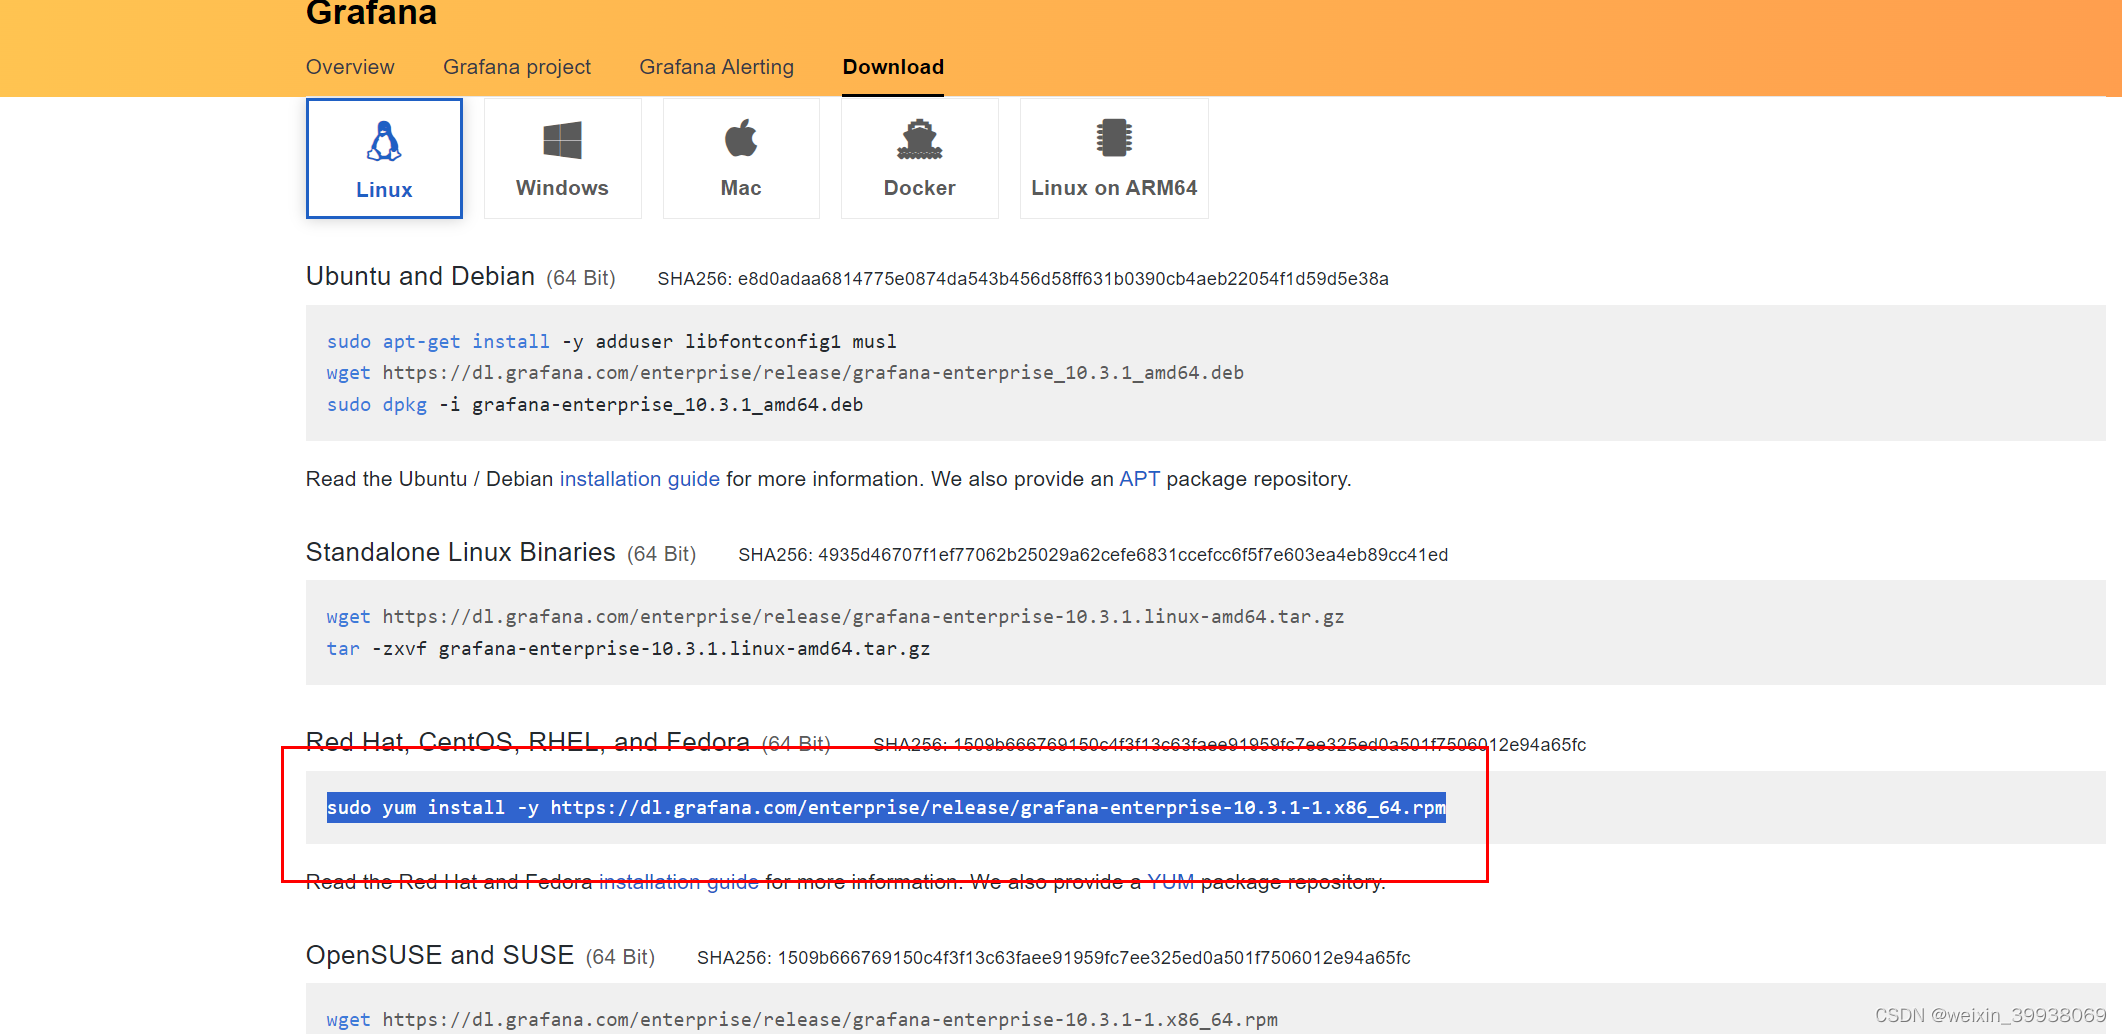
安装和配置Grafana
下载地址:https://grafana.com/grafana/download
上图的话,安装后用 systemctl start grafana-server 启动,会方便一些
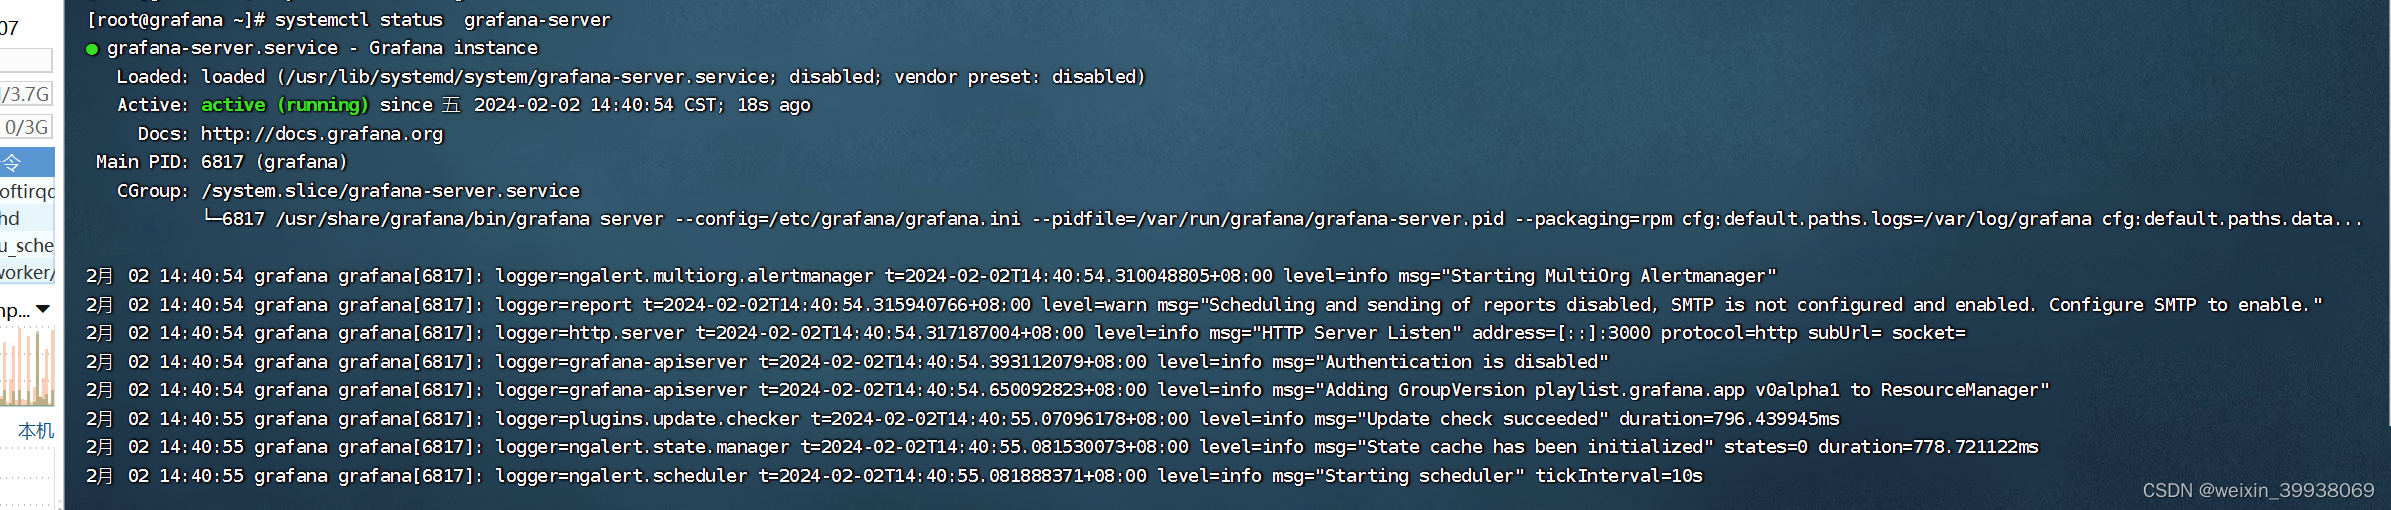
或者用这个也行,这个的话后面启动要用脚本启动
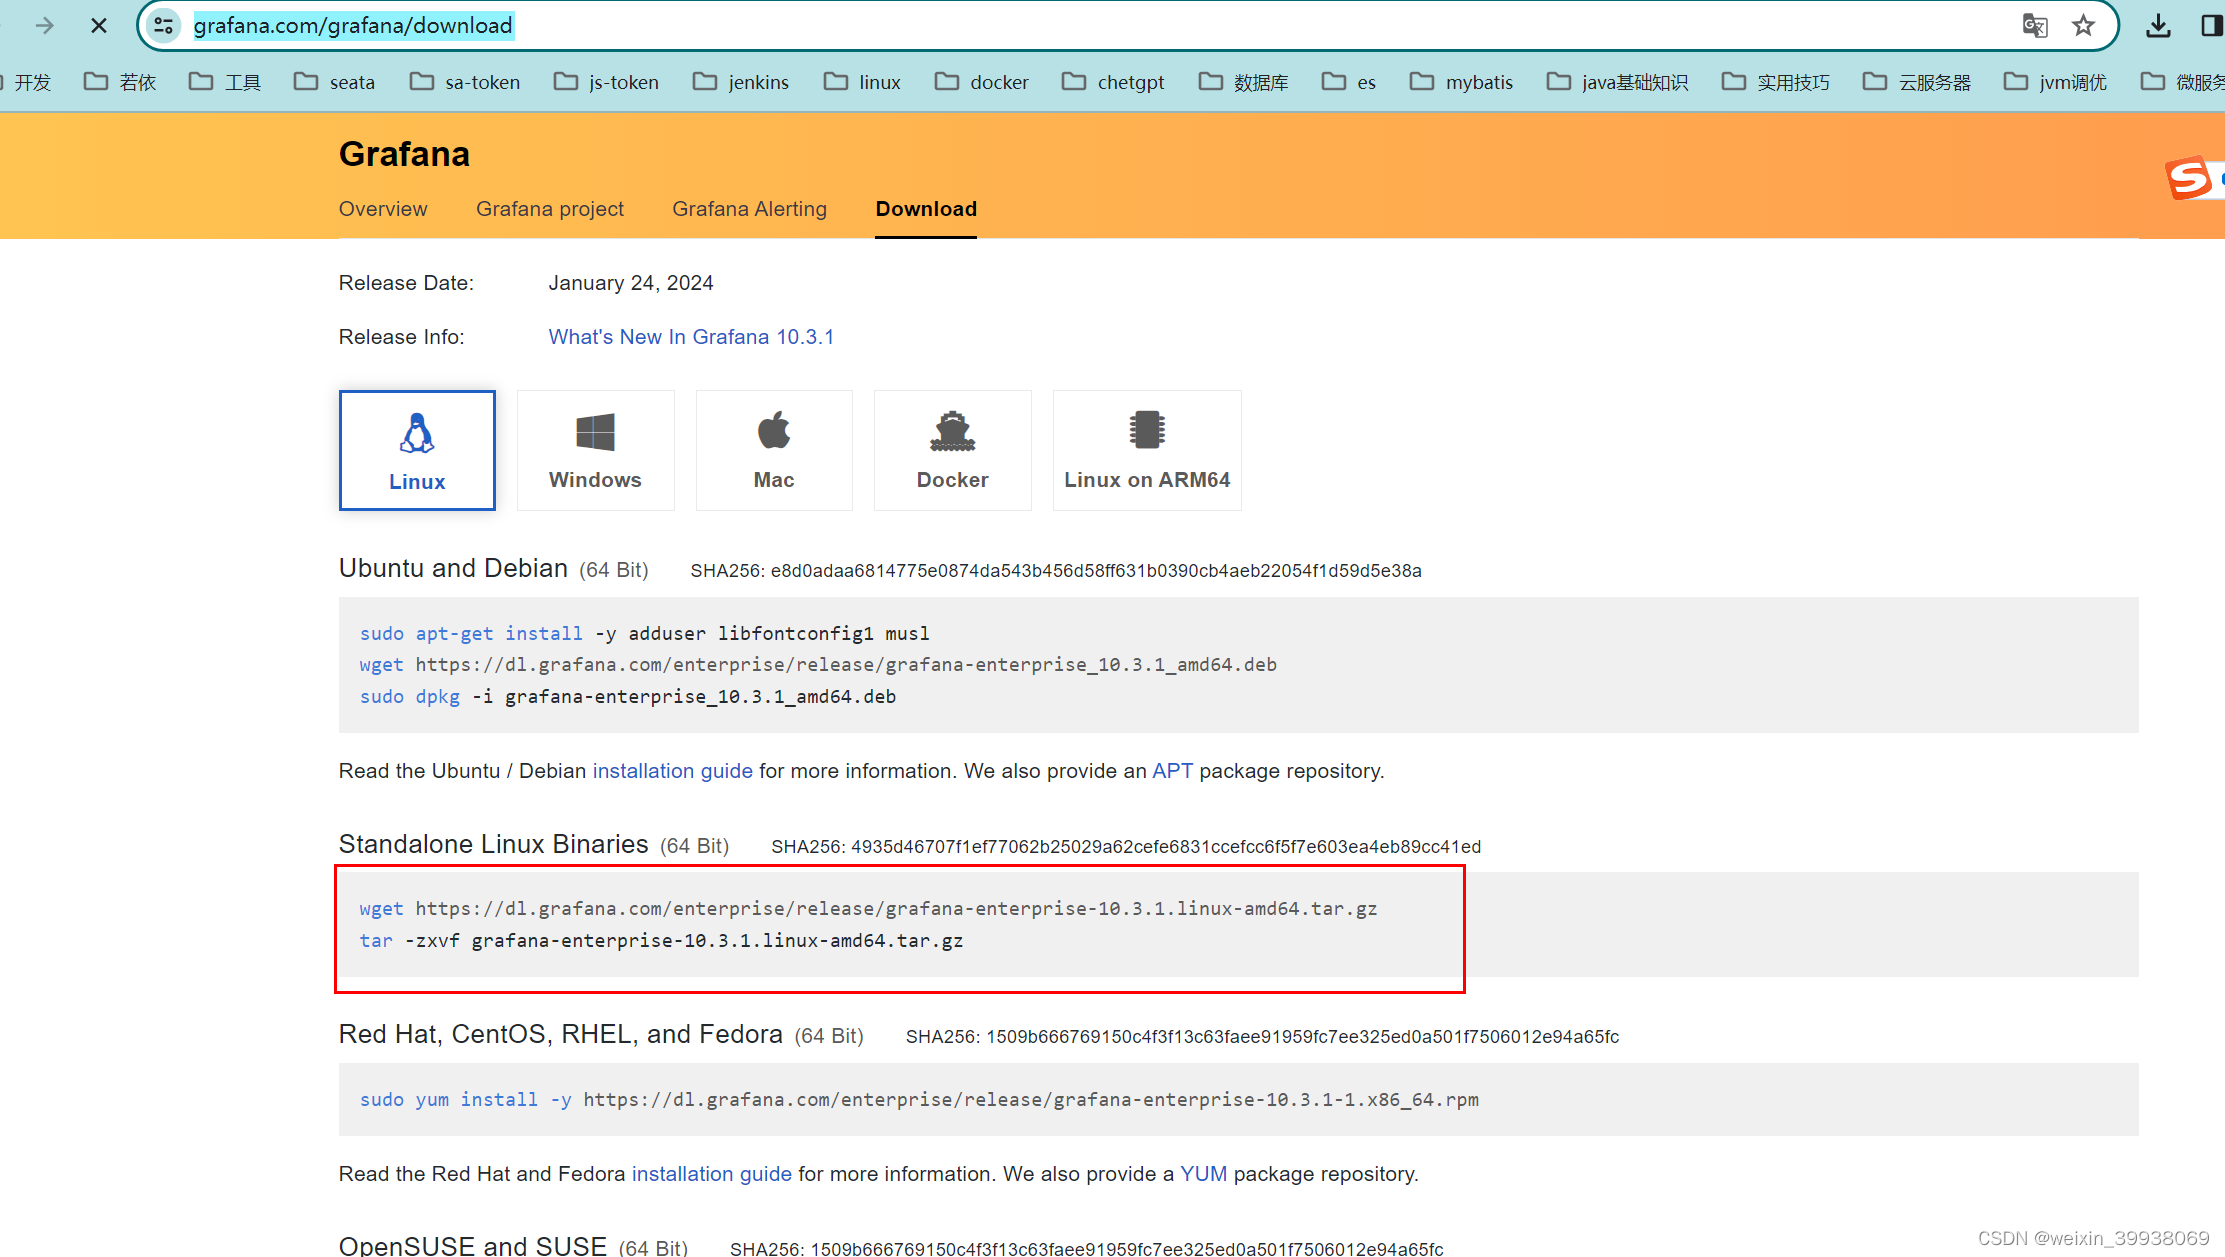
解压一下安装包
tar -vxf grafana-enterprise-10.3.1.linux-amd64.tar.gz
启动:
cd 到安装目录bin目录,执行./grafana-server
注意:默认账号密码为:
账号:admin
密码:admin

如果你想卸载,可以关闭服务(直接pkill grafana-server也行),直接删除安装目录,然后删除对应配置

```xml
sudo rm -rf /var/lib/grafana
sudo rm -rf /var/log/grafana
sudo rm -rf /etc/grafana
sudo rm -rf /etc/grafana/grafana.ini
sudo rm -rf  /var/lib/grafana/grafana.db
通常情况下,Grafana 服务的配置文件位于 /etc/grafana/grafana.ini,日志通常存储在 /var/log/grafana,而数据库默认位于 /var/lib/grafana/grafana.db。您可能需要查看这些文件以进行故障排查或者进行配置更改。记得在修改配置文件之后重启 Grafana 服务使更改生效。
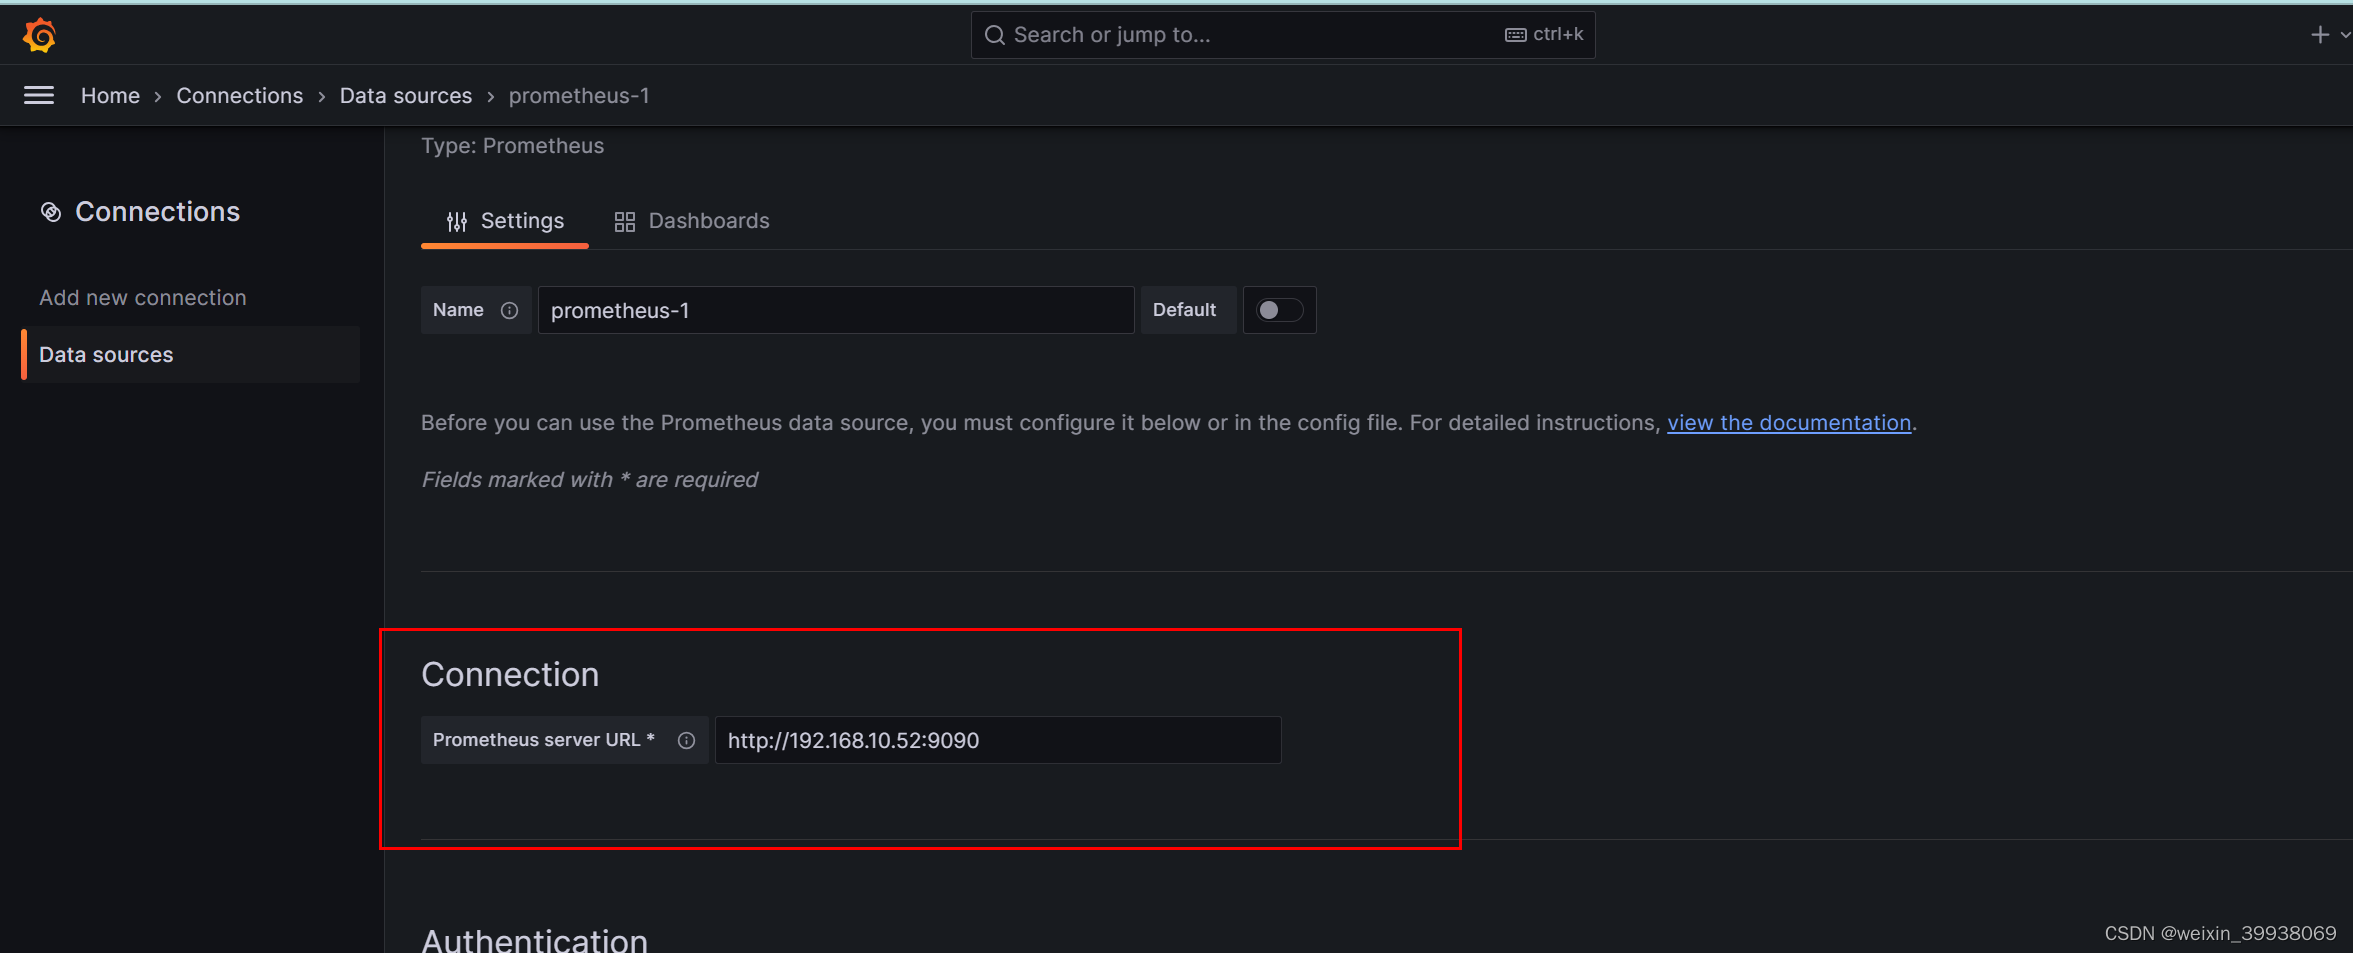
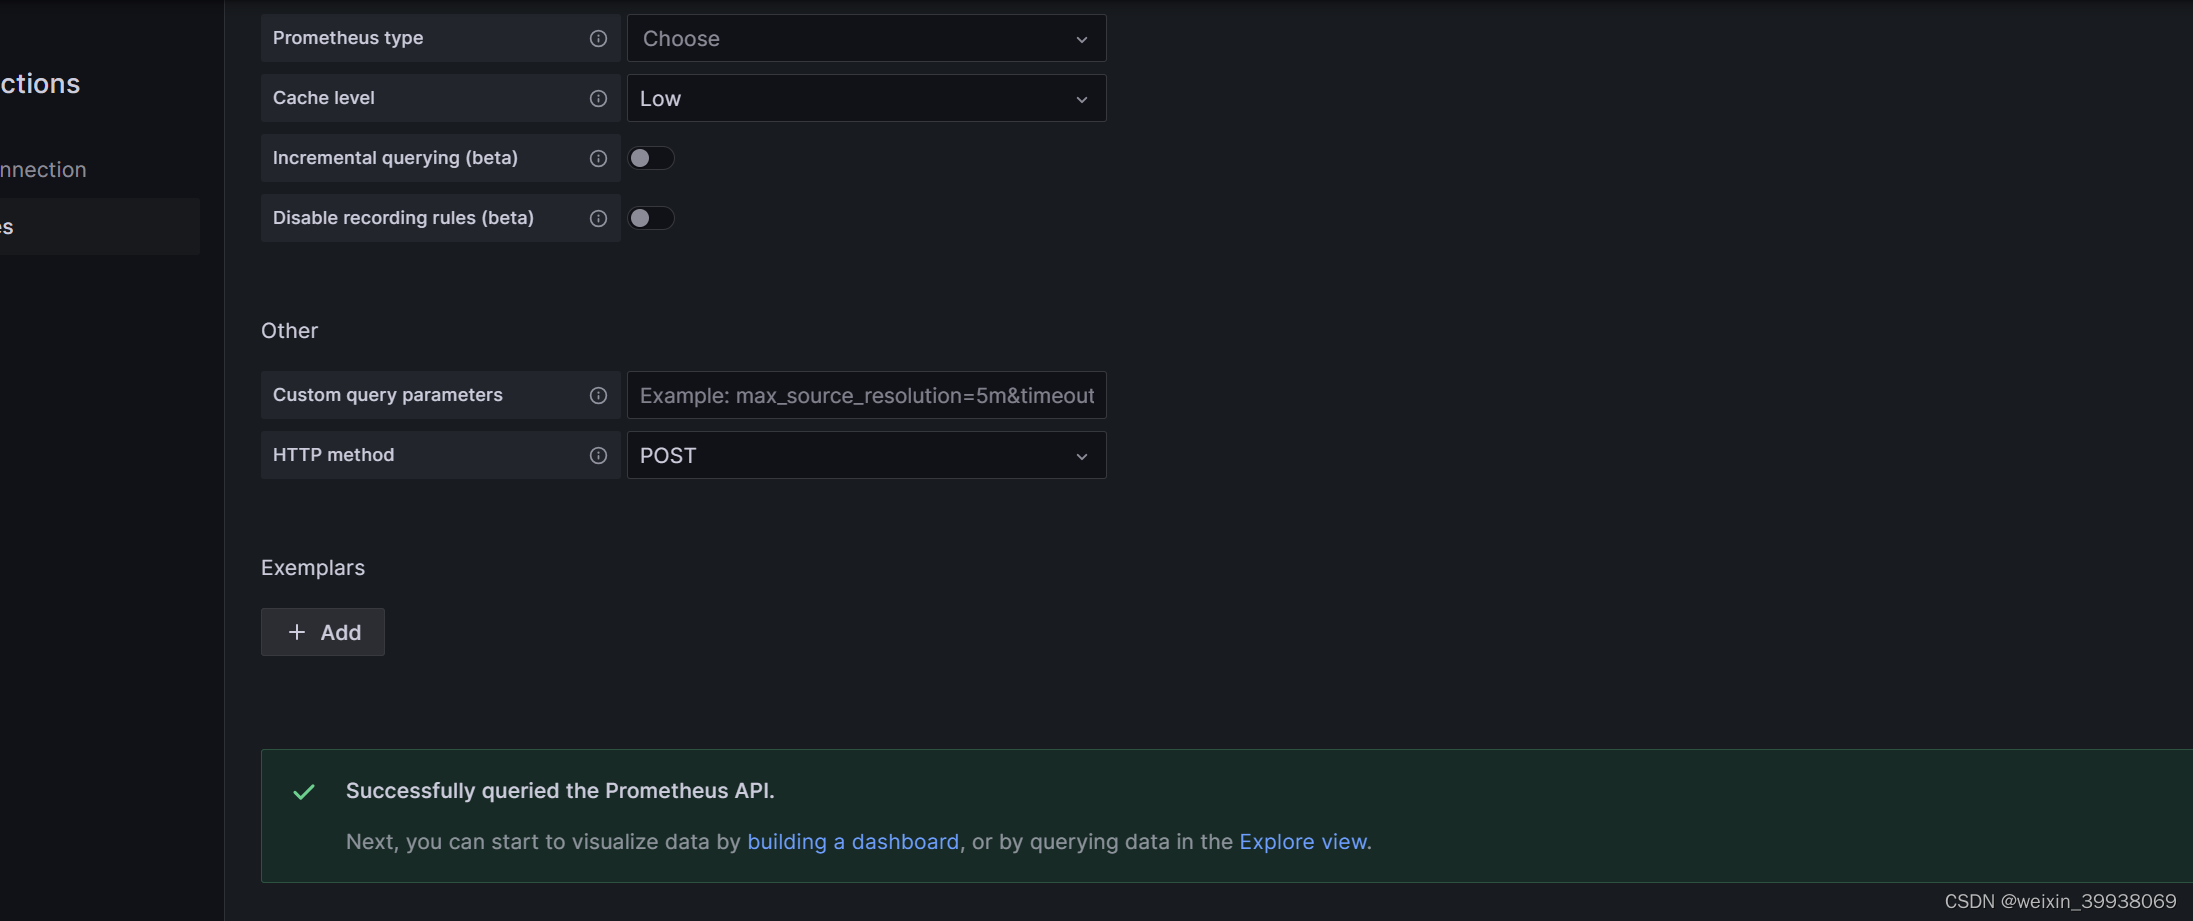
Grafana只用于展示数据,需要配置Prometheus数据源
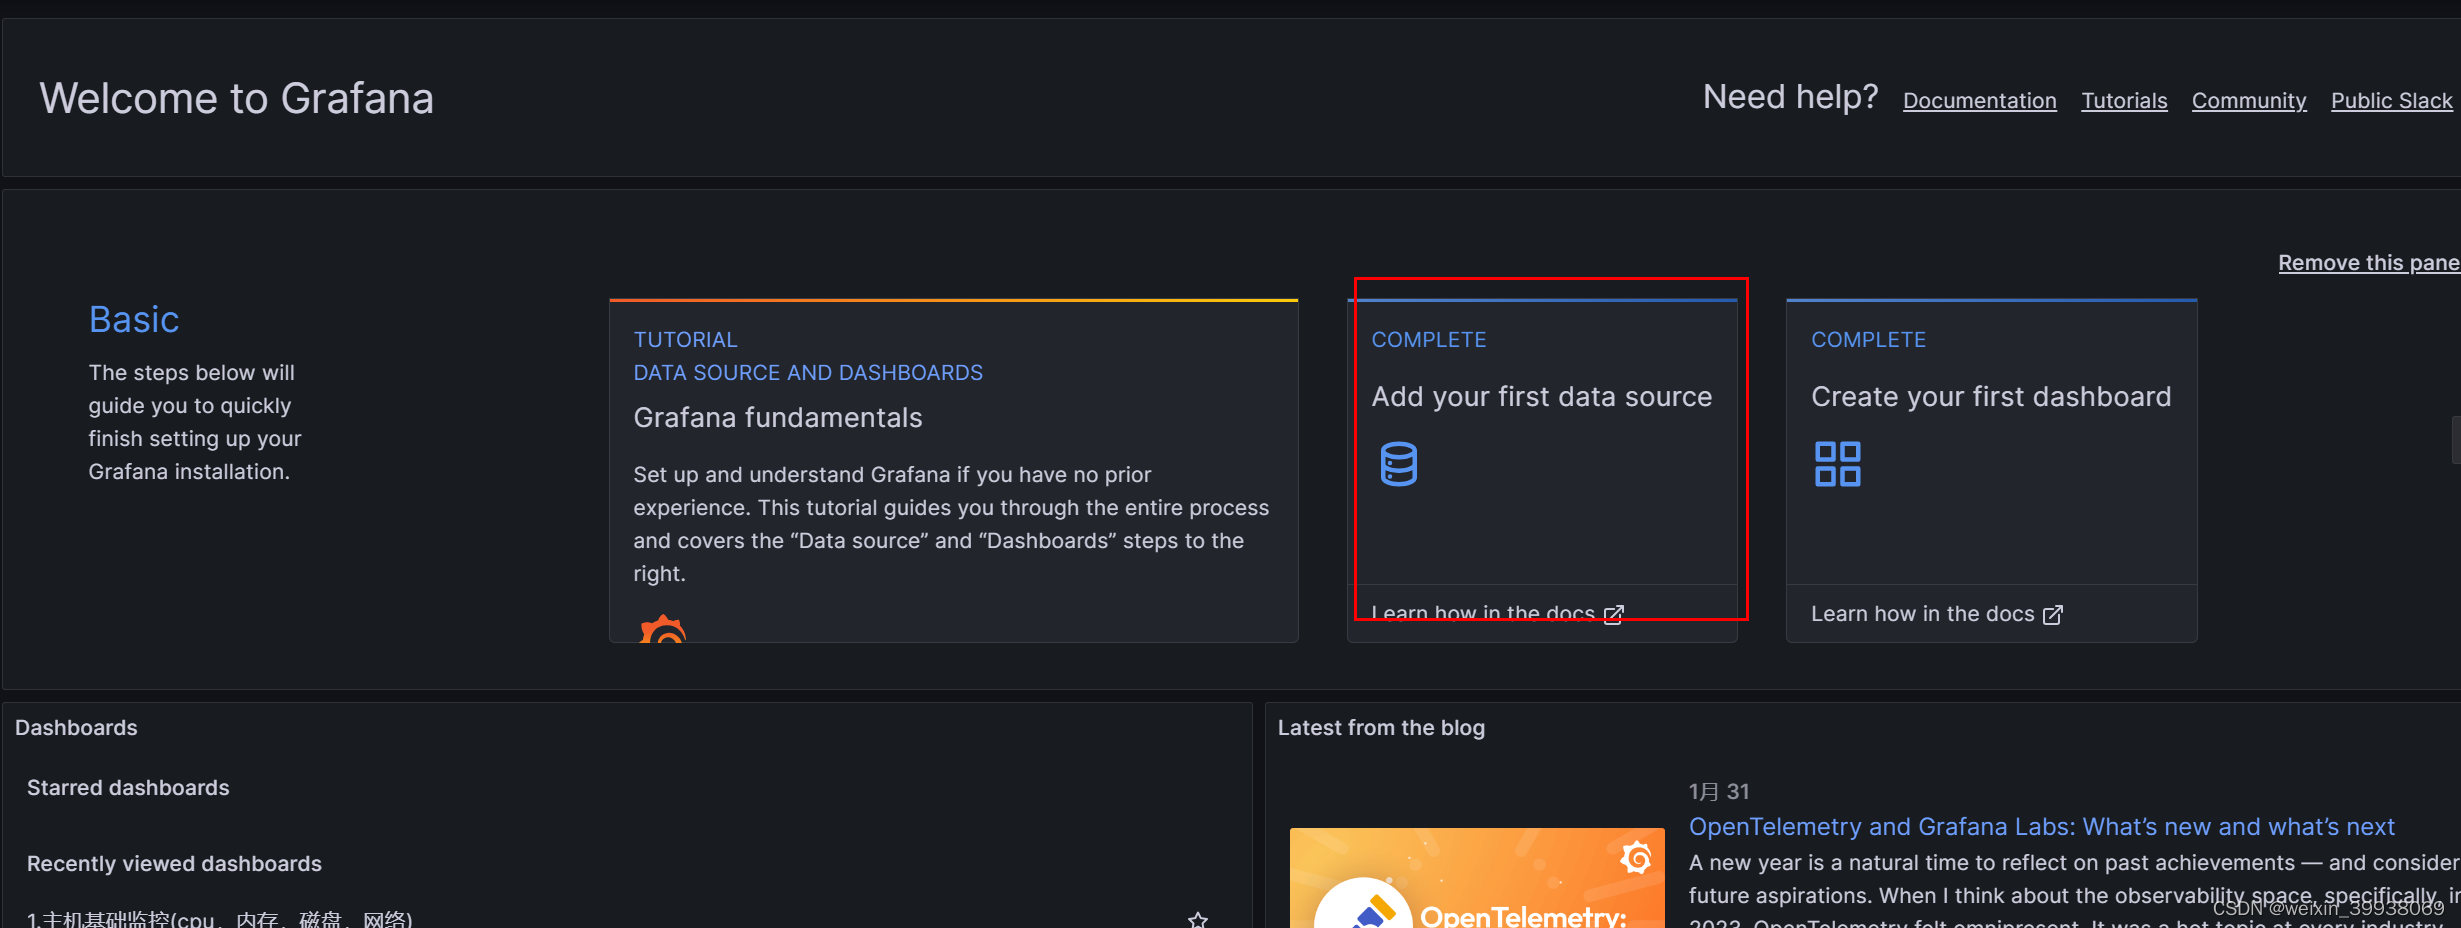
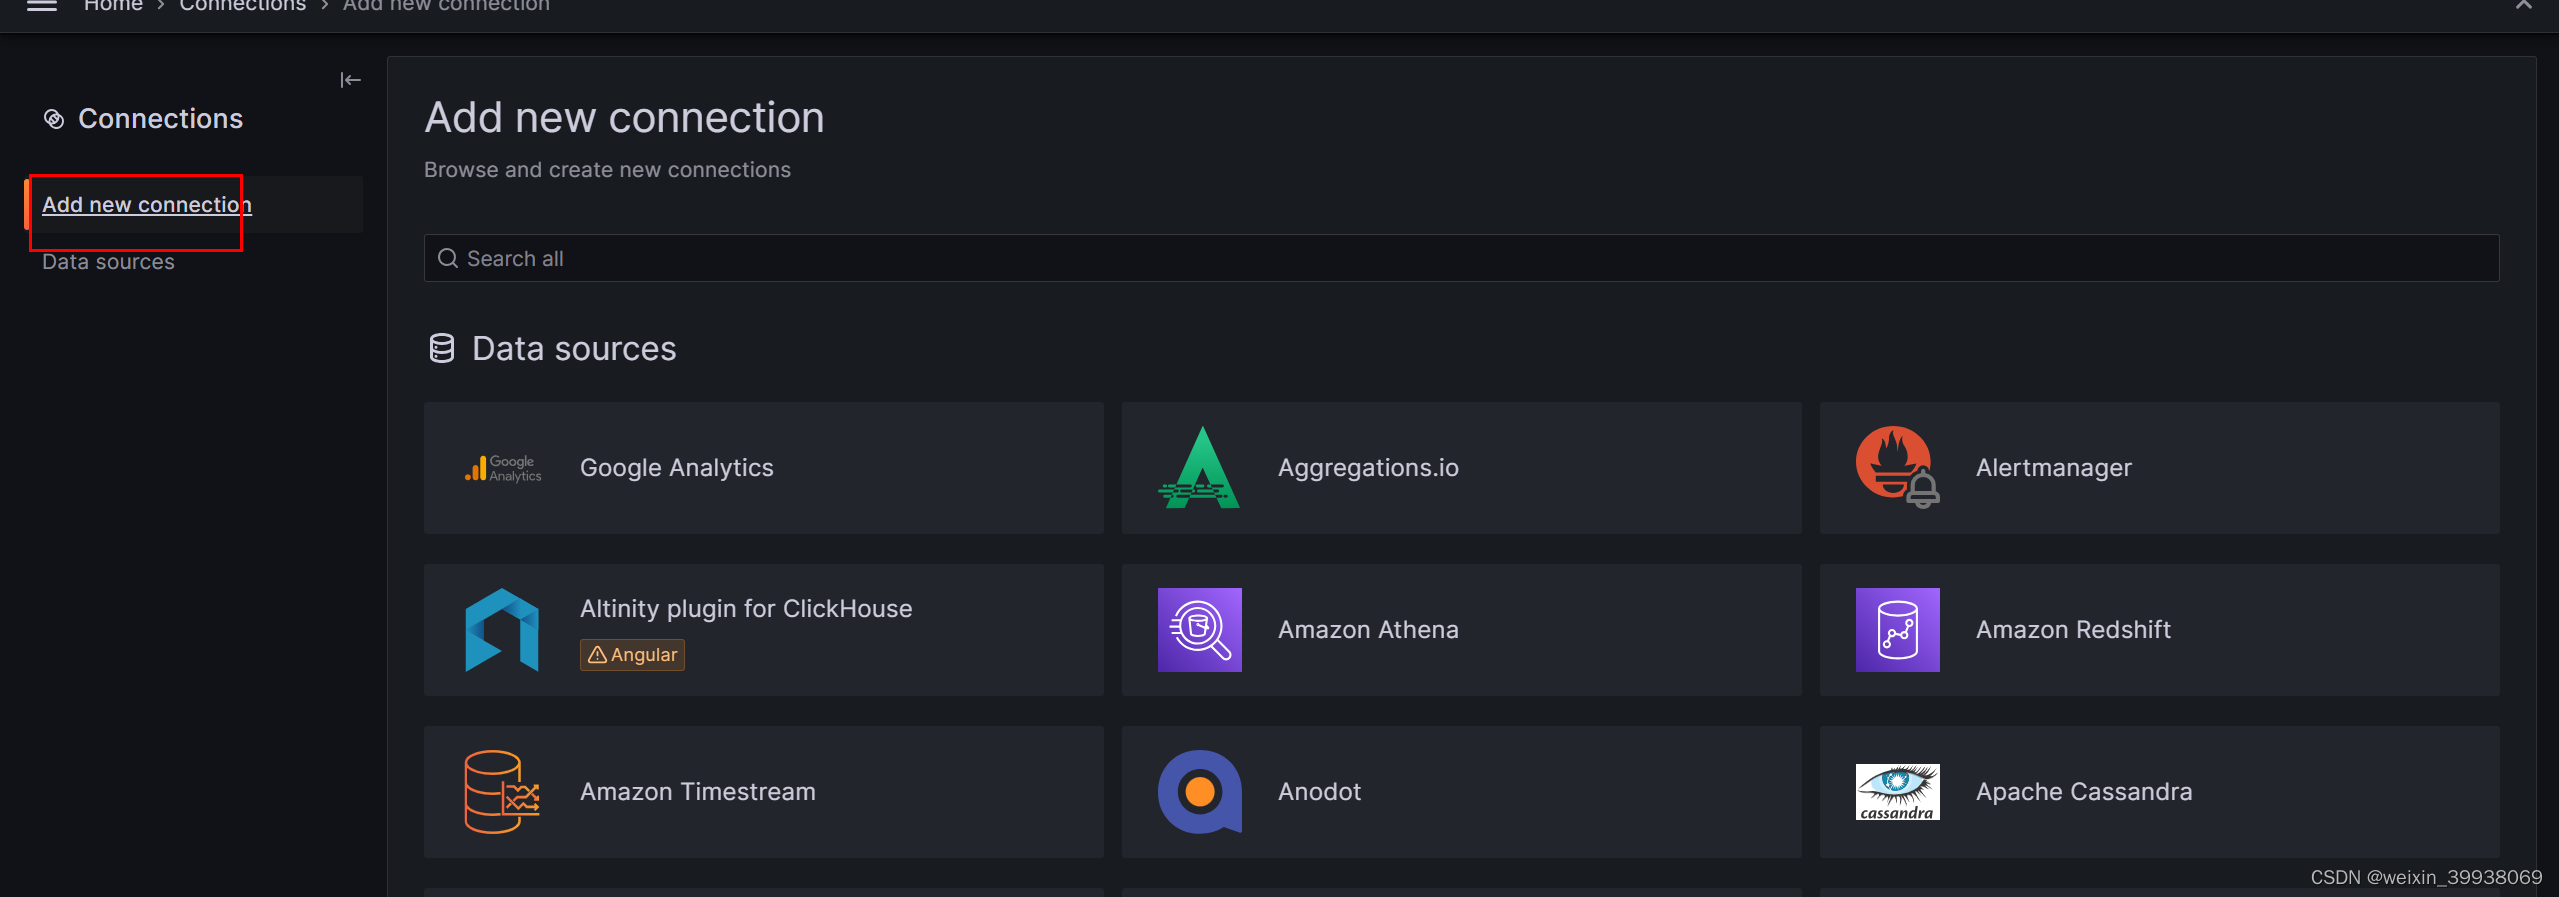
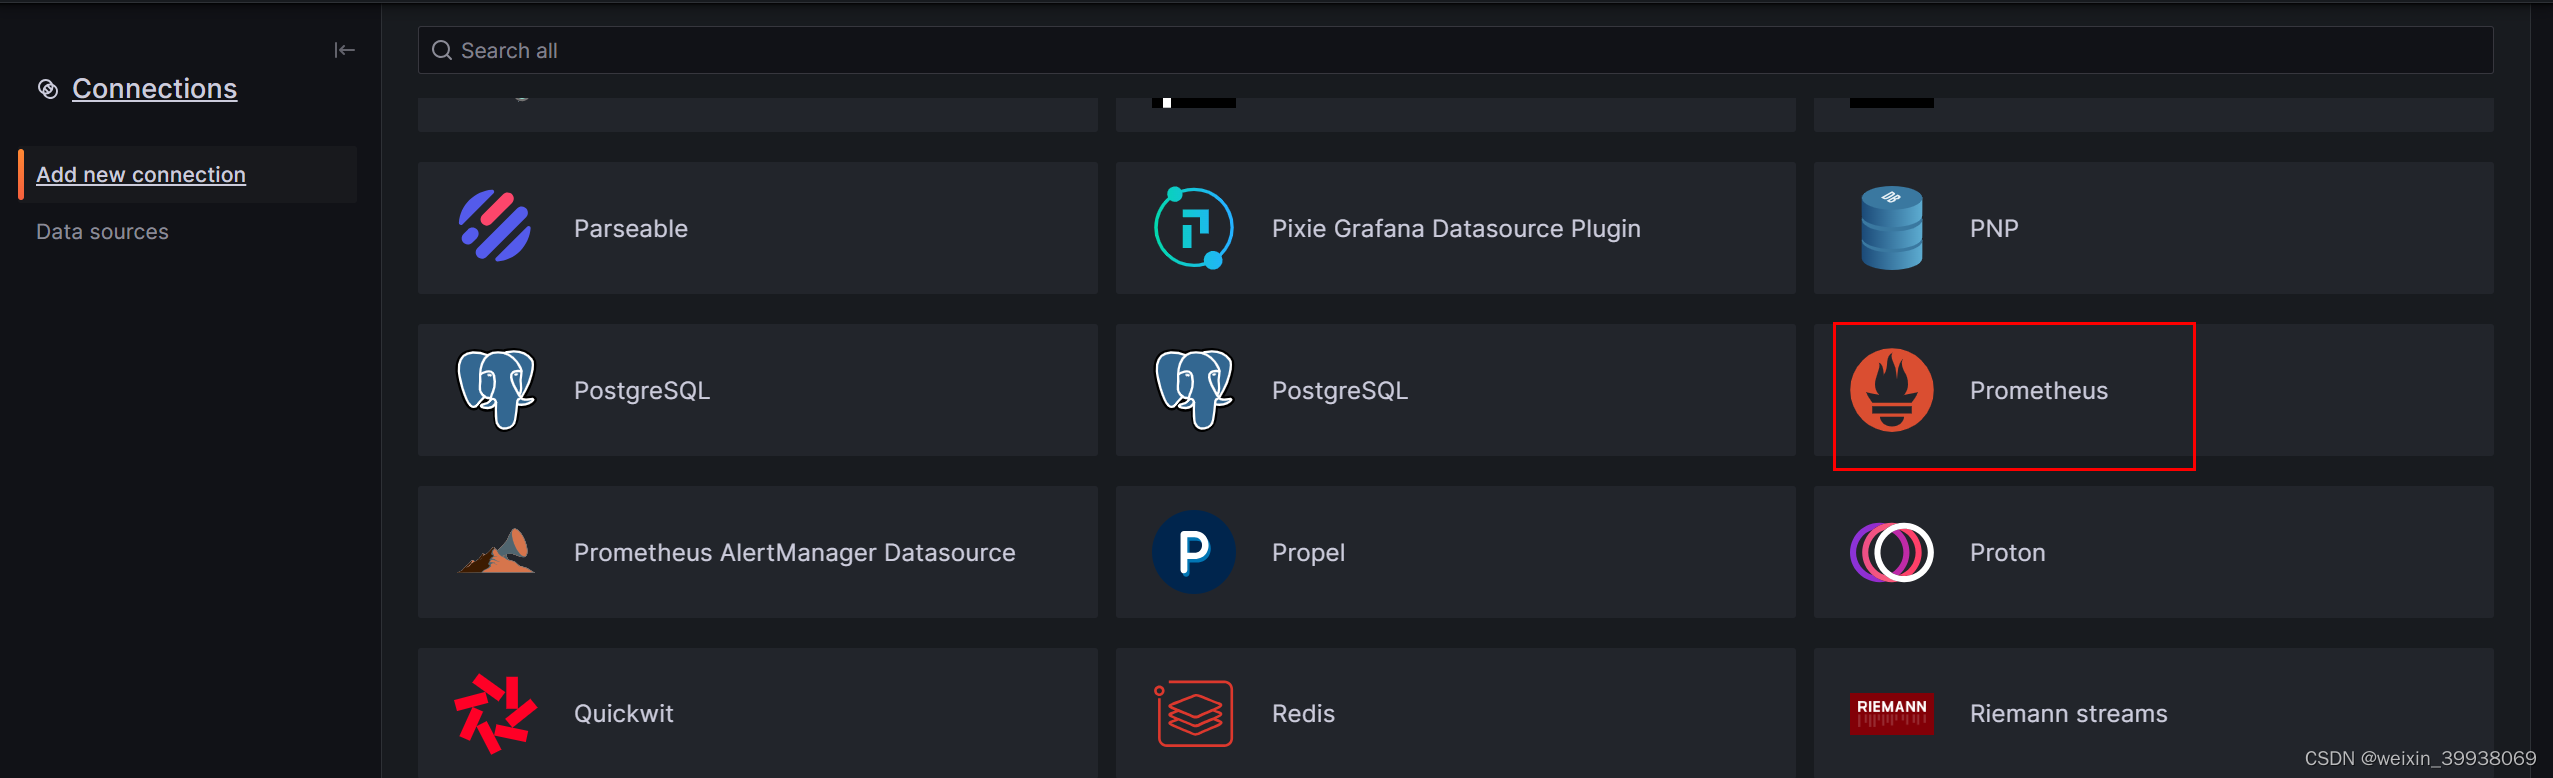
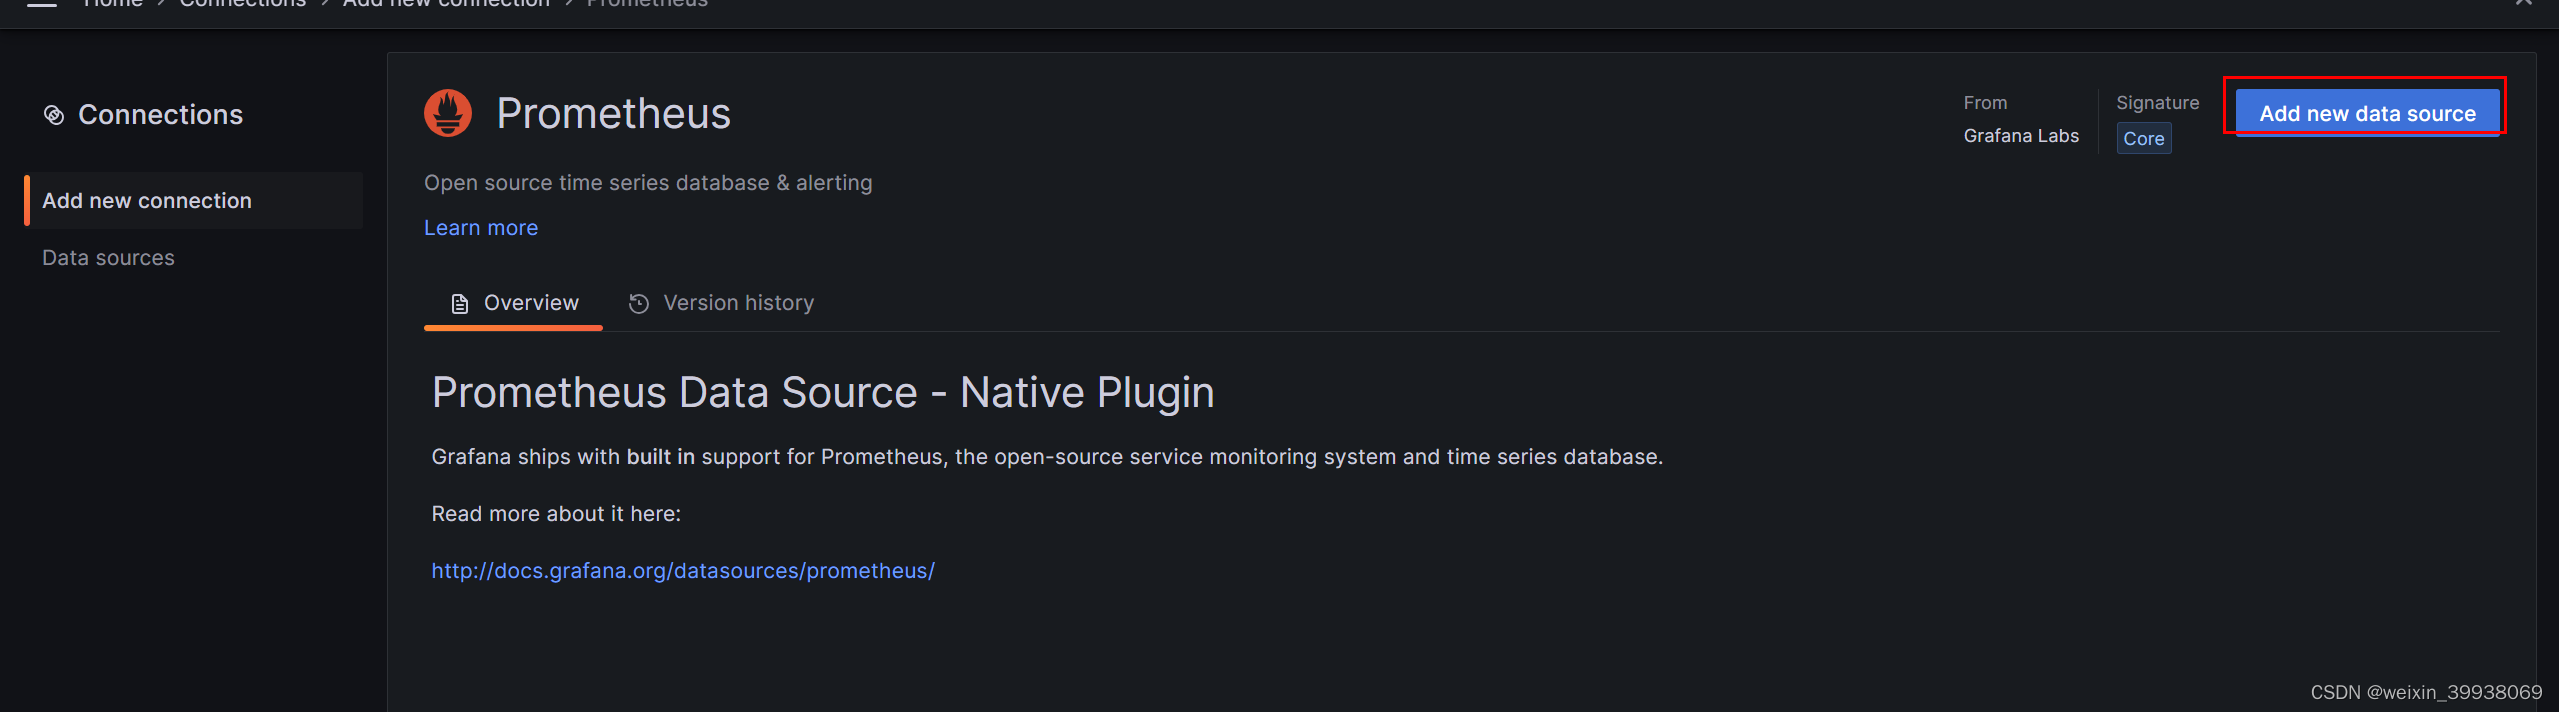
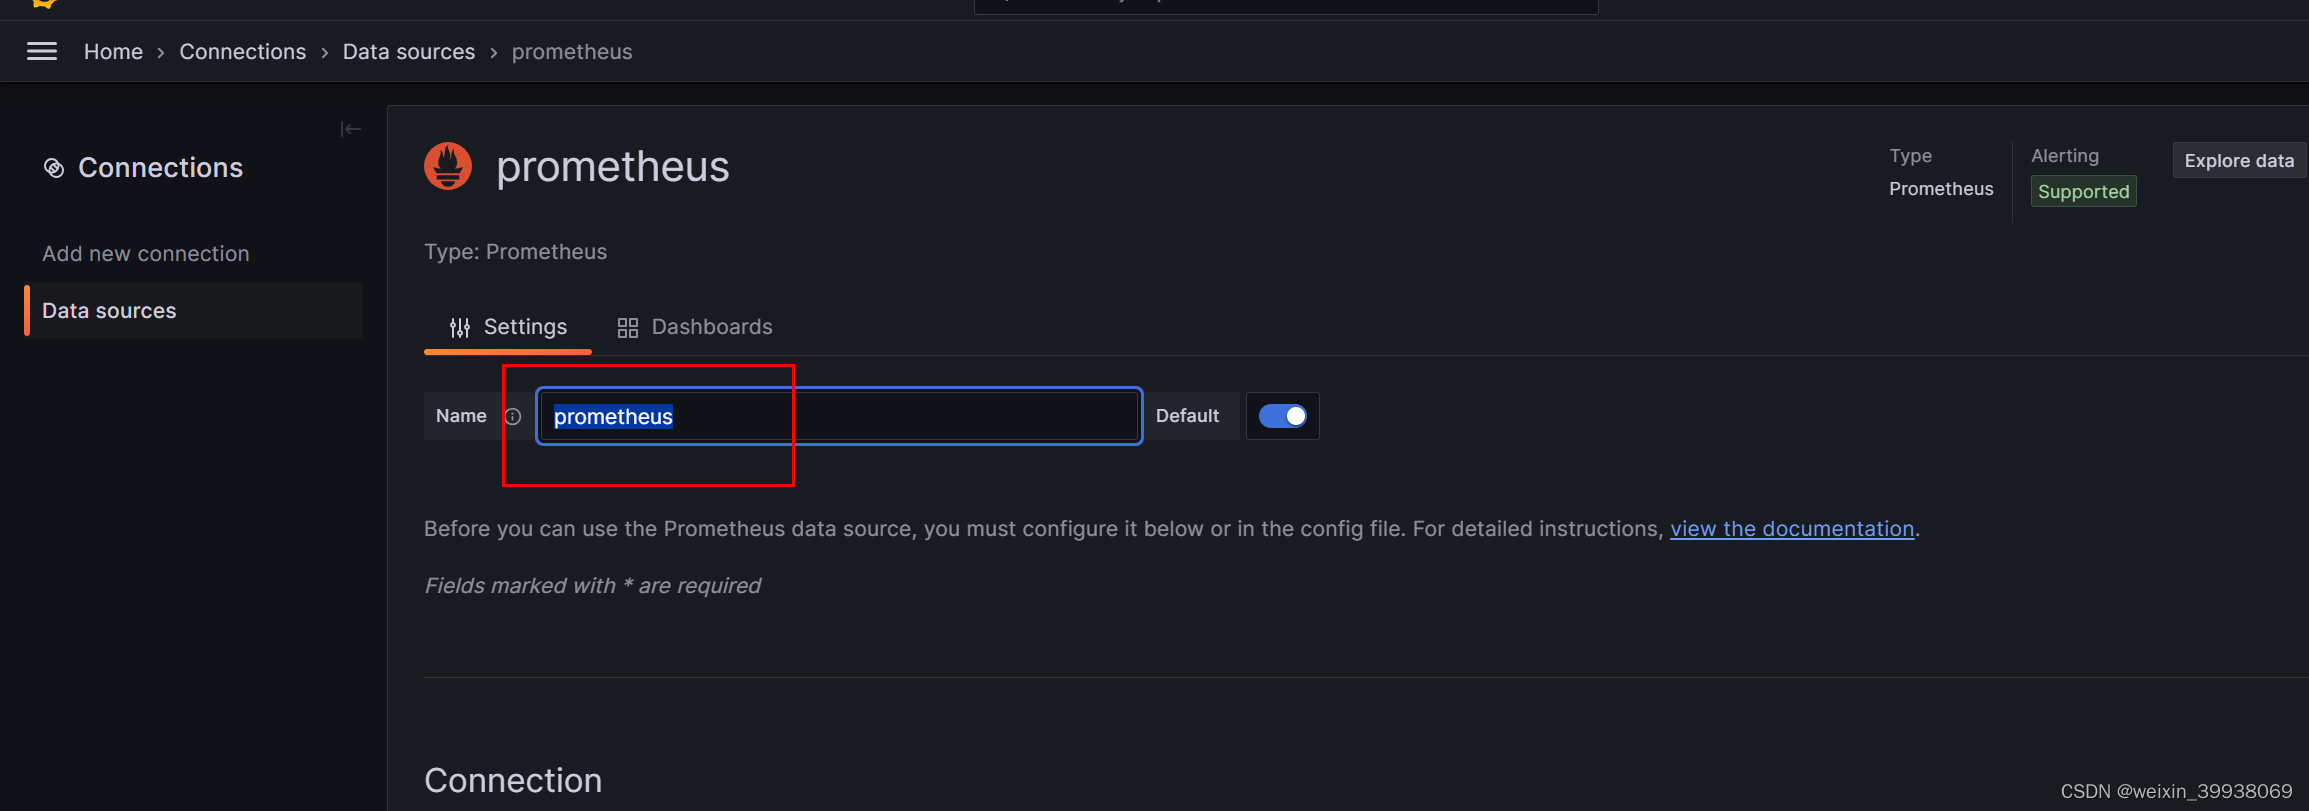
填写名称和promethues的地址,然后保存(名称这里我用了默认的):
之43a0145d41d5a21403467f192d2c.png)
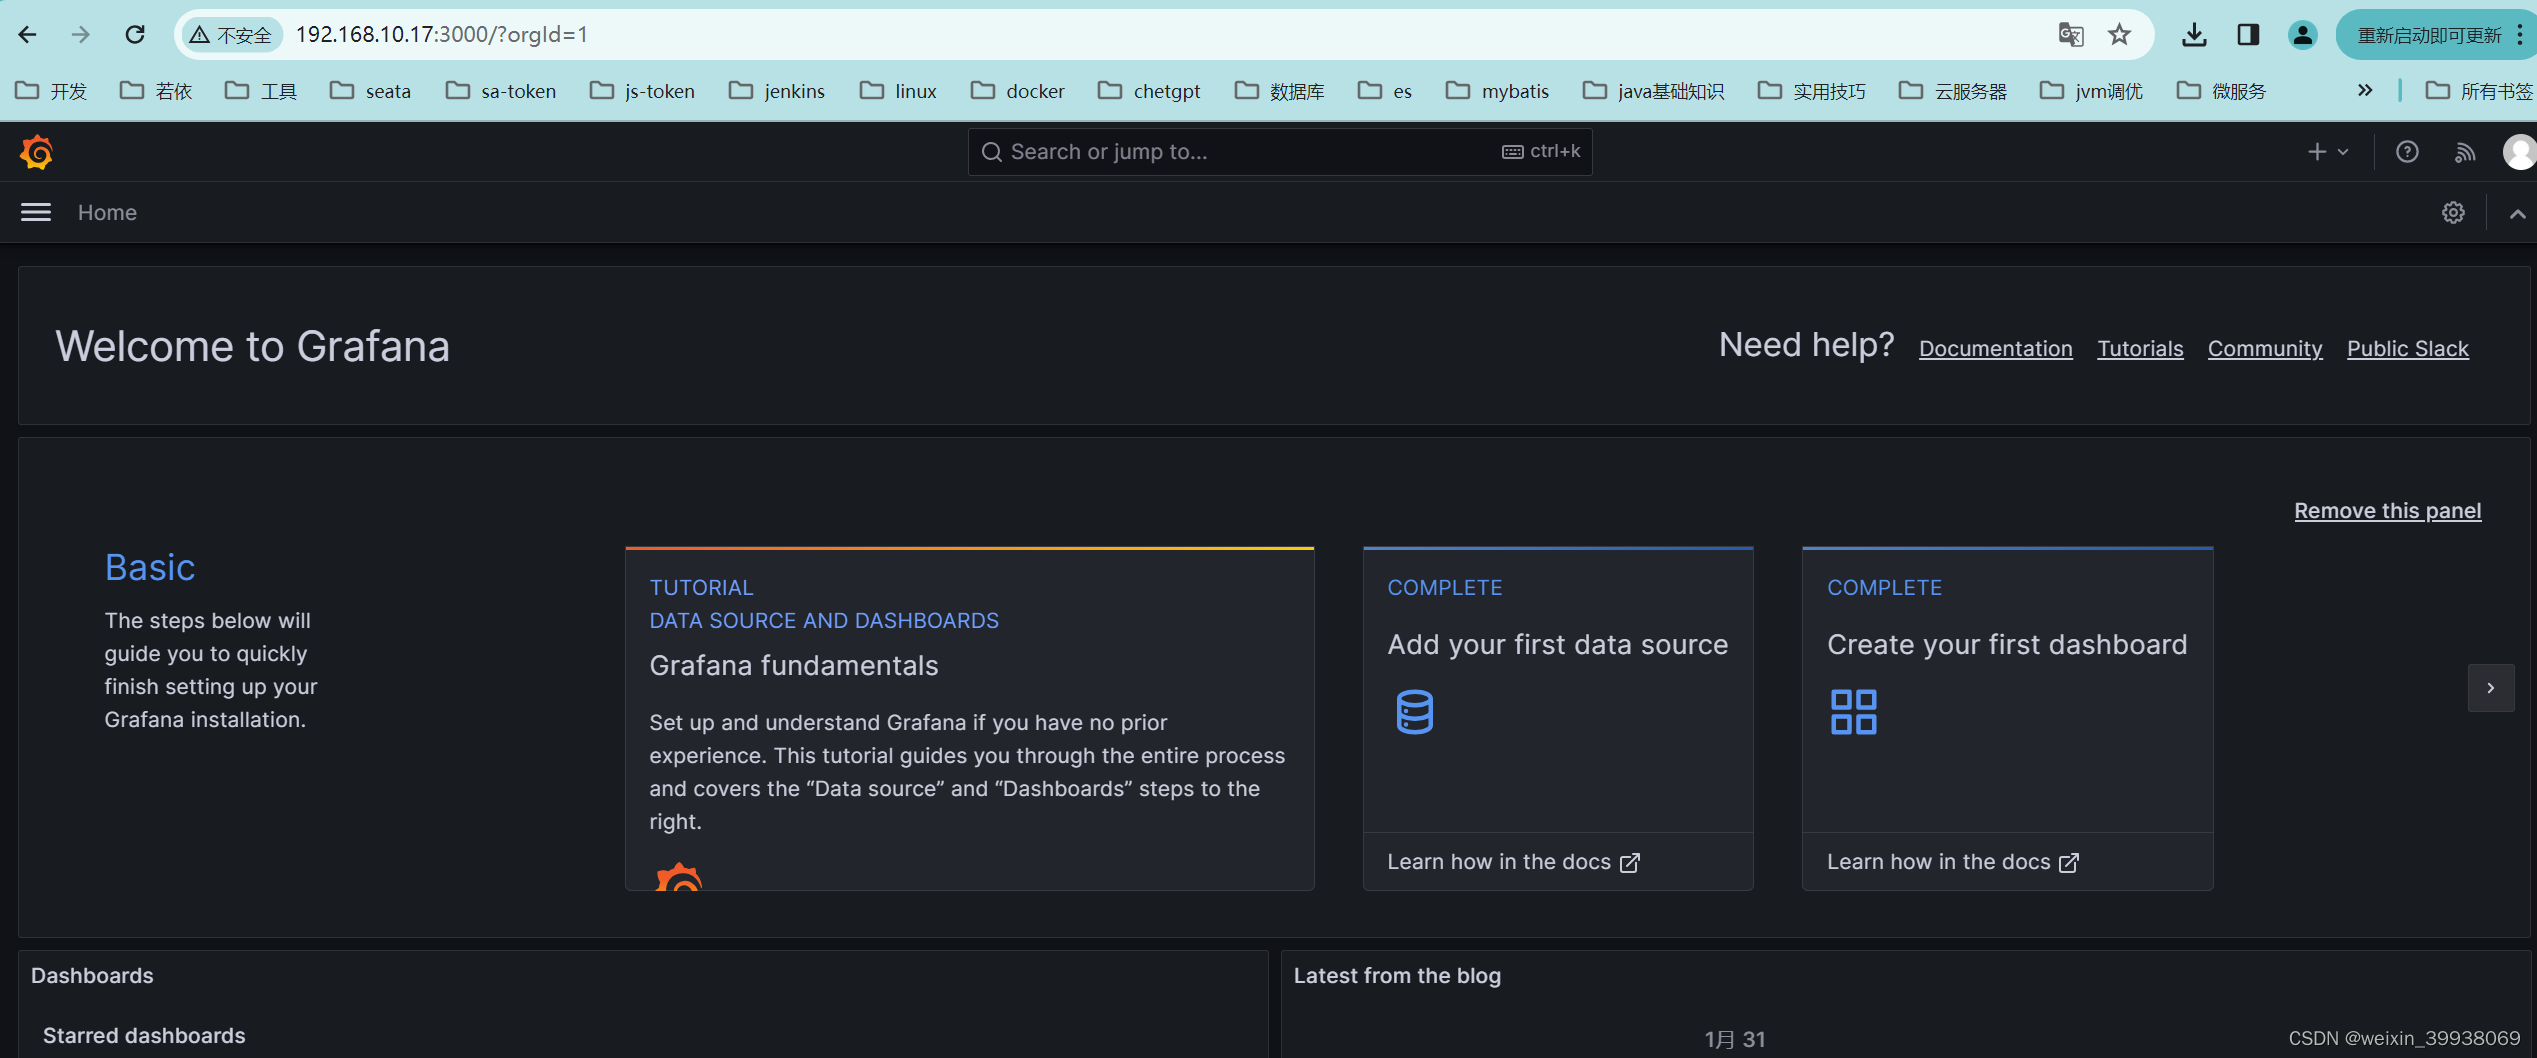
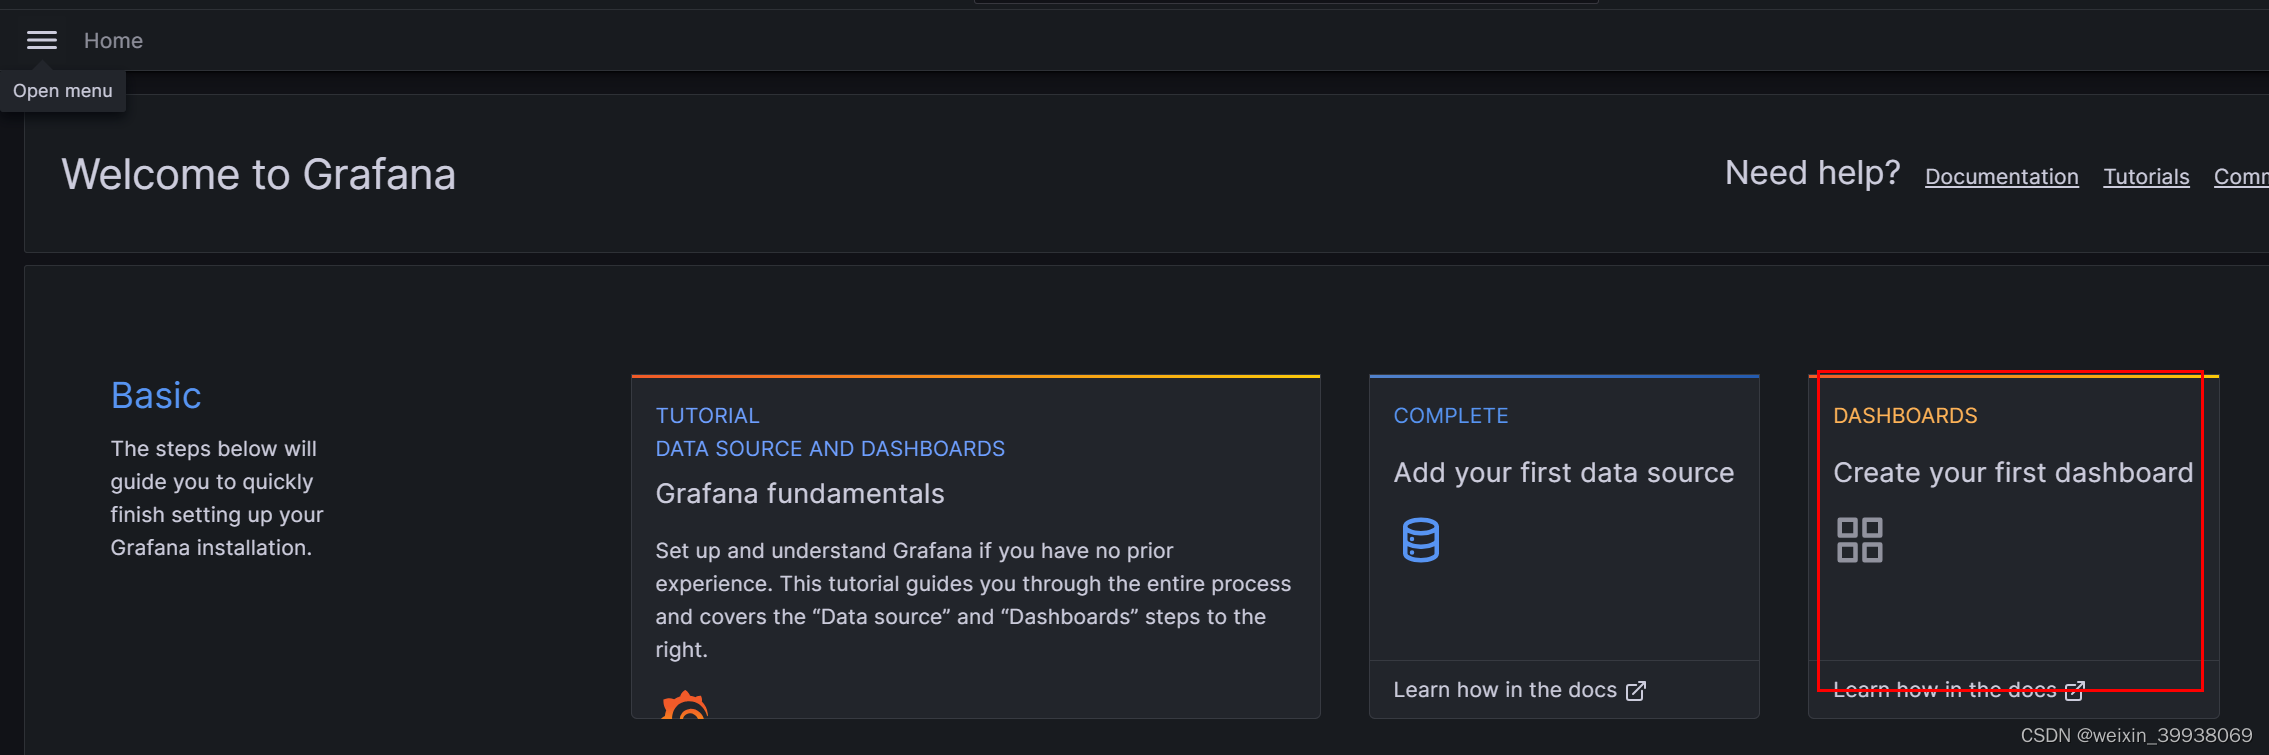
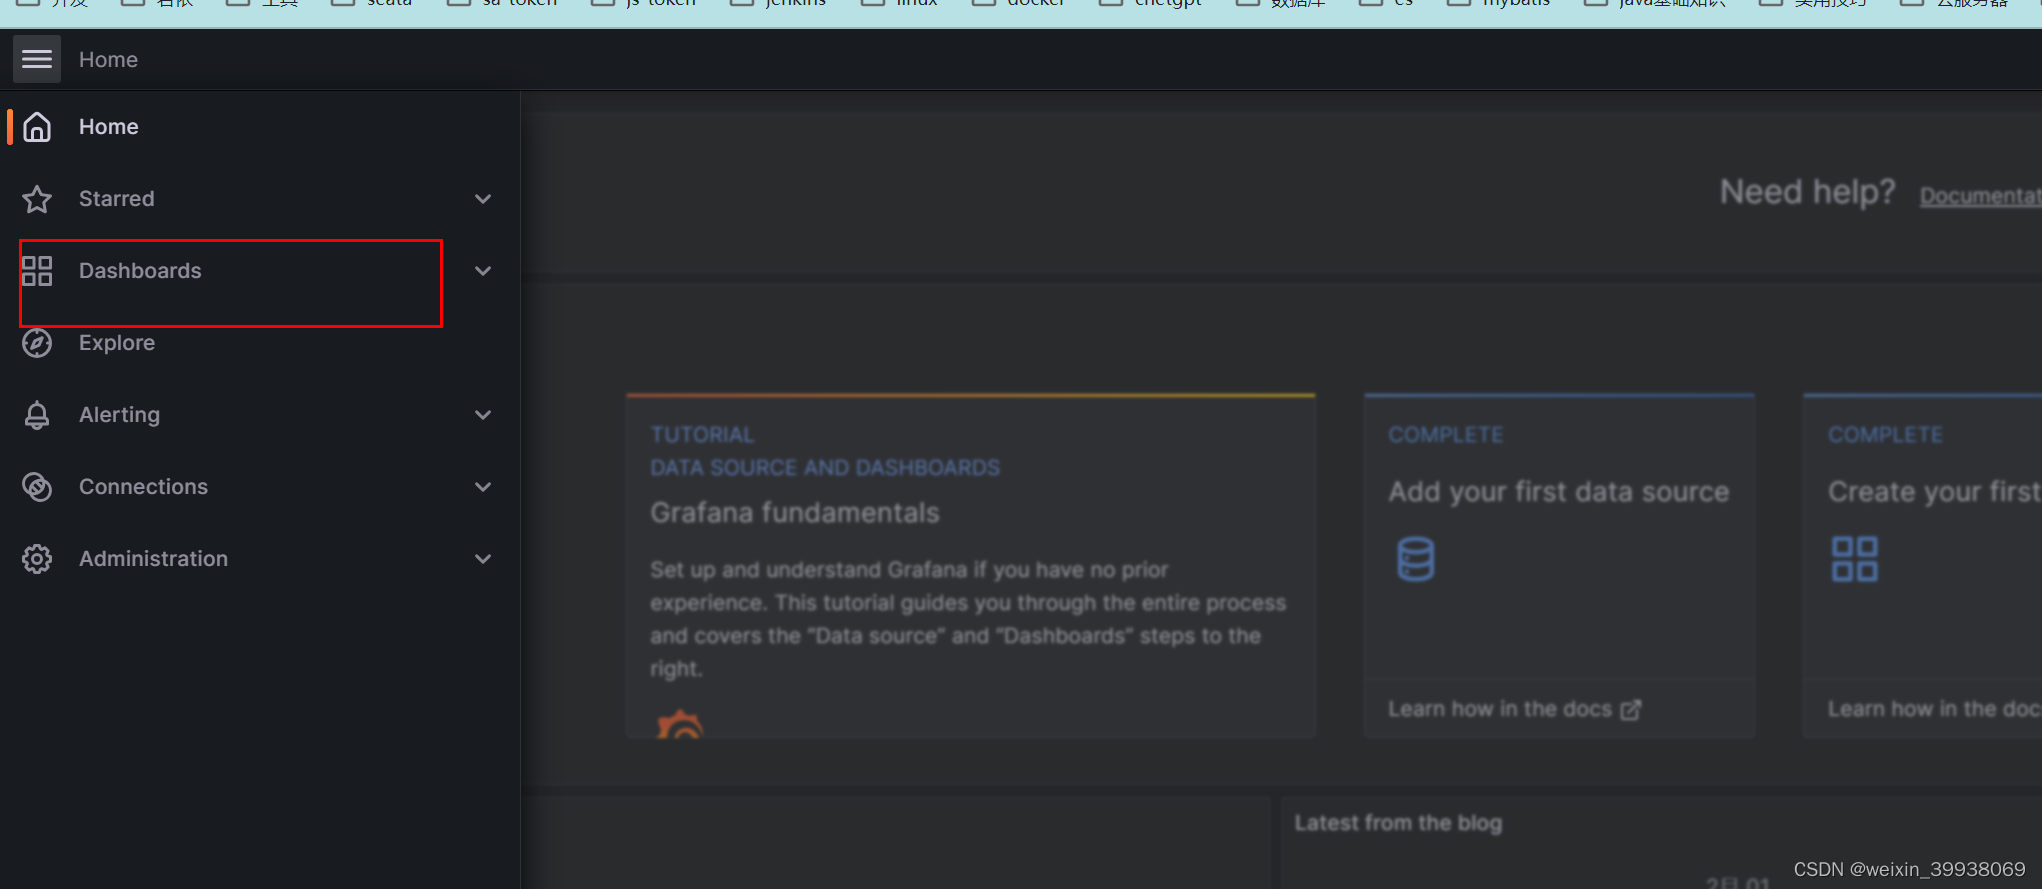
然后回到home,找到Create your first dashboard
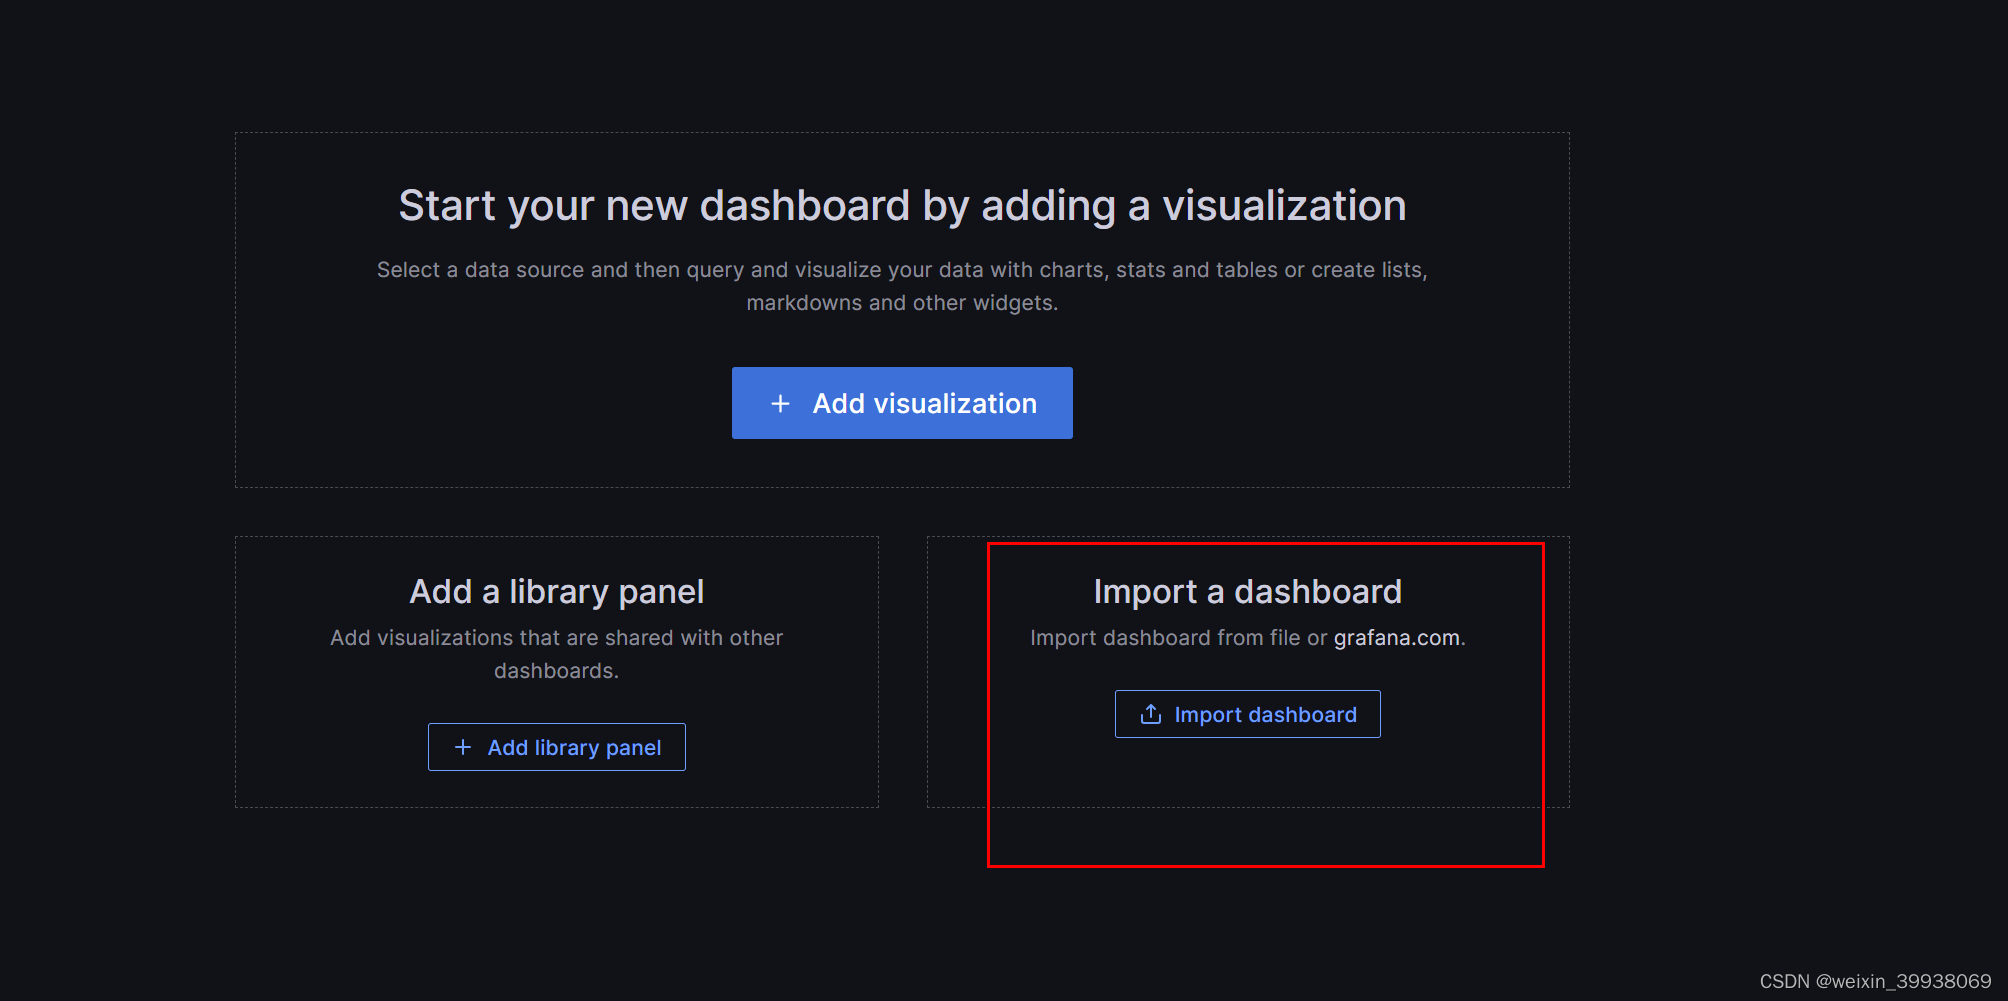
选择import
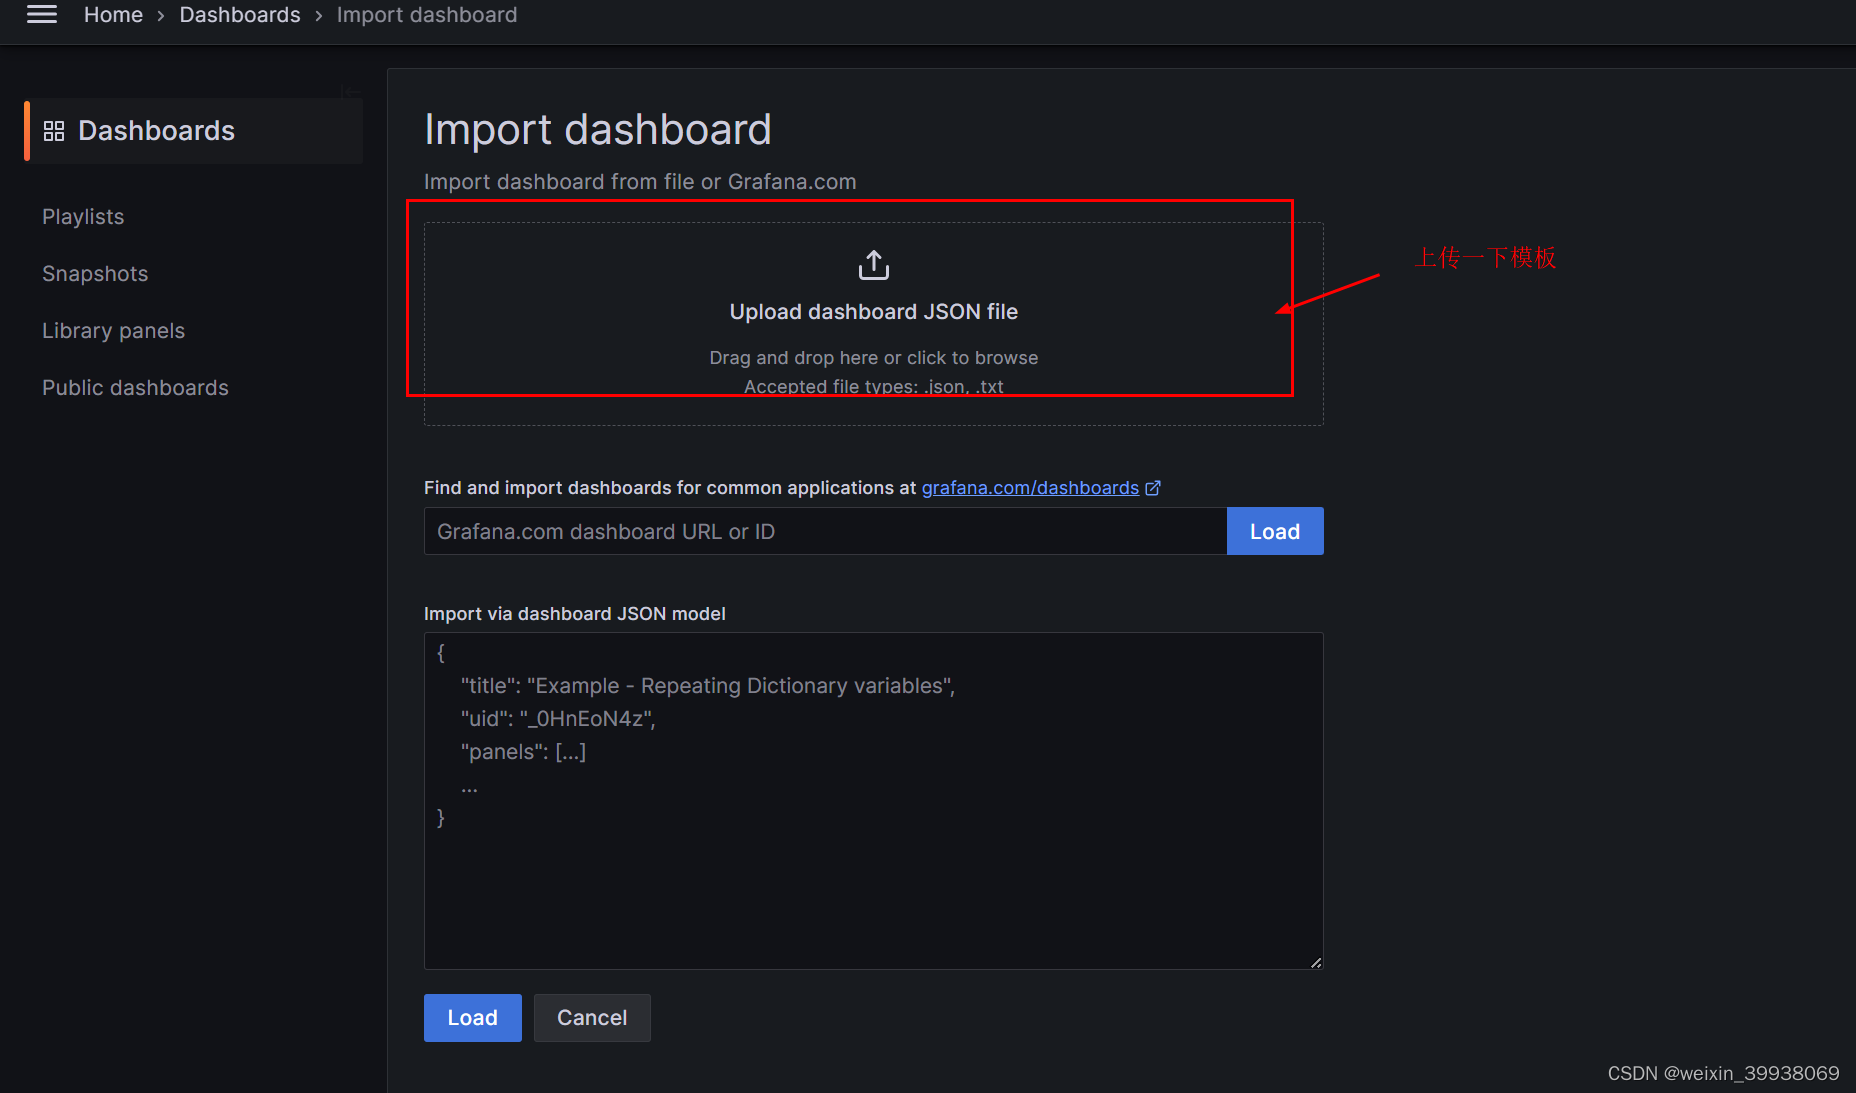
这边提供一个模板,自己复制后,新建一个json文件,编辑的时候粘贴进去,也可以自己去网上找一个,网上找的话需要自己调整和修改:
{
"__inputs": [
{
"name": "DS_PROMETHEUS",
"label": "Prometheus",
"description": "",
"type": "datasource",
"pluginId": "prometheus",
"pluginName": "Prometheus"
}
],
"__requires": [
{
"type": "grafana",
"id": "grafana",
"name": "Grafana",
"version": "6.5.2"
},
{
"type": "panel",
"id": "graph",
"name": "Graph",
"version": ""
},
{
"type": "datasource",
"id": "prometheus",
"name": "Prometheus",
"version": "1.0.0"
},
{
"type": "panel",
"id": "singlestat",
"name": "Singlestat",
"version": ""
}
],
"annotations": {
"list": [
{
"builtIn": 1,
"datasource": "-- Grafana --",
"enable": true,
"hide": true,
"iconColor": "rgba(0, 211, 255, 1)",
"name": "Annotations & Alerts",
"type": "dashboard"
}
]
},
"description": "RDS Dashboard for Prometheus RDS Exporter 1.x, it works with helm stable/RDS-ha exporter.\r\n\r\nIf you missing RDS memory utilization, please modify \"maxmemory\" value in values.yaml",
"editable": true,
"gnetId": 11835,
"graphTooltip": 0,
"id": null,
"iteration": 1583145402535,
"links": [],
"panels": [
{
"cacheTimeout": null,
"colorBackground": false,
"colorValue": false,
"colors": [
"rgba(245, 54, 54, 0.9)",
"rgba(237, 129, 40, 0.89)",
"rgba(50, 172, 45, 0.97)"
],
"datasource": "${DS_PROMETHEUS}",
"decimals": 0,
"editable": true,
"error": false,
"format": "s",
"gauge": {
"maxValue": 100,
"minValue": 0,
"show": false,
"thresholdLabels": false,
"thresholdMarkers": true
},
"gridPos": {
"h": 7,
"w": 2,
"x": 0,
"y": 0
},
"id": 9,
"interval": null,
"isNew": true,
"links": [],
"mappingType": 1,
"mappingTypes": [
{
"name": "value to text",
"value": 1
},
{
"name": "range to text",
"value": 2
}
],
"maxDataPoints": 100,
"nullPointMode": "connected",
"nullText": null,
"options": {},
"postfix": "",
"postfixFontSize": "50%",
"prefix": "",
"prefixFontSize": "50%",
"rangeMaps": [
{
"from": "null",
"text": "N/A",
"to": "null"
}
],
"sparkline": {
"fillColor": "rgba(31, 118, 189, 0.18)",
"full": false,
"lineColor": "rgb(31, 120, 193)",
"show": true
},
"tableColumn": "",
"targets": [
{
"expr": "max(max_over_time(redis_uptime_in_seconds_$namespace{exported_instance=\"$instance\"}[$__interval]))",
"format": "time_series",
"interval": "",
"intervalFactor": 2,
"legendFormat": "",
"metric": "",
"refId": "A",
"step": 1800
}
],
"thresholds": "",
"title": "Uptime",
"type": "singlestat",
"valueFontSize": "70%",
"valueMaps": [
{
"op": "=",
"text": "N/A",
"value": "null"
}
],
"valueName": "current"
},
{
"cacheTimeout": null,
"colorBackground": false,
"colorValue": false,
"colors": [
"rgba(245, 54, 54, 0.9)",
"rgba(237, 129, 40, 0.89)",
"rgba(50, 172, 45, 0.97)"
],
"datasource": "${DS_PROMETHEUS}",
"decimals": 0,
"editable": true,
"error": false,
"format": "none",
"gauge": {
"maxValue": 100,
"minValue": 0,
"show": false,
"thresholdLabels": false,
"thresholdMarkers": true
},
"gridPos": {
"h": 7,
"w": 2,
"x": 2,
"y": 0
},
"hideTimeOverride": true,
"id": 12,
"interval": null,
"isNew": true,
"links": [],
"mappingType": 1,
"mappingTypes": [
{
"name": "value to text",
"value": 1
},
{
"name": "range to text",
"value": 2
}
],
"maxDataPoints": 100,
"nullPointMode": "connected",
"nullText": null,
"options": {},
"postfix": "",
"postfixFontSize": "50%",
"prefix": "",
"prefixFontSize": "50%",
"rangeMaps": [
{
"from": "null",
"text": "N/A",
"to": "null"
}
],
"sparkline": {
"fillColor": "rgba(31, 118, 189, 0.18)",
"full": false,
"lineColor": "rgb(31, 120, 193)",
"show": true
},
"tableColumn": "",
"targets": [
{
"expr": "redis_connections_$namespace{exported_instance=\"$instance\"}",
"format": "time_series",
"intervalFactor": 2,
"legendFormat": "",
"metric": "",
"refId": "A",
"step": 2
}
],
"thresholds": "",
"timeFrom": "1m",
"timeShift": null,
"title": "Clients",
"type": "singlestat",
"valueFontSize": "80%",
"valueMaps": [
{
"op": "=",
"text": "N/A",
"value": "null"
}
],
"valueName": "current"
},
{
"cacheTimeout": null,
"colorBackground": false,
"colorValue": false,
"colors": [
"rgba(50, 172, 45, 0.97)",
"rgba(237, 129, 40, 0.89)",
"rgba(245, 54, 54, 0.9)"
],
"datasource": "${DS_PROMETHEUS}",
"decimals": 0,
"editable": true,
"error": false,
"format": "percent",
"gauge": {
"maxValue": 100,
"minValue": 0,
"show": true,
"thresholdLabels": false,
"thresholdMarkers": true
},
"gridPos": {
"h": 7,
"w": 4,
"x": 4,
"y": 0
},
"hideTimeOverride": true,
"id": 11,
"interval": null,
"isNew": true,
"links": [],
"mappingType": 1,
"mappingTypes": [
{
"name": "value to text",
"value": 1
},
{
"name": "range to text",
"value": 2
}
],
"maxDataPoints": 100,
"nullPointMode": "connected",
"nullText": null,
"options": {},
"postfix": "",
"postfixFontSize": "50%",
"prefix": "",
"prefixFontSize": "50%",
"rangeMaps": [
{
"from": "null",
"text": "N/A",
"to": "null"
}
],
"sparkline": {
"fillColor": "rgba(31, 118, 189, 0.18)",
"full": false,
"lineColor": "rgb(31, 120, 193)",
"show": true
},
"tableColumn": "",
"targets": [
{
"expr": "100 * (redis_memory_used_bytes_$namespace{exported_instance=\"$instance\"} / redis_memory_max_bytes_$namespace{exported_instance=\"$instance\"} )",
"format": "time_series",
"intervalFactor": 2,
"legendFormat": "",
"metric": "",
"refId": "A",
"step": 2
}
],
"thresholds": "80,95",
"timeFrom": "1m",
"timeShift": null,
"title": "Memory Usage",
"type": "singlestat",
"valueFontSize": "80%",
"valueMaps": [
{
"op": "=",
"text": "N/A",
"value": "null"
}
],
"valueName": "current"
},
{
"aliasColors": {},
"bars": false,
"dashLength": 10,
"dashes": false,
"datasource": "${DS_PROMETHEUS}",
"editable": true,
"error": false,
"fill": 1,
"fillGradient": 0,
"grid": {},
"gridPos": {
"h": 7,
"w": 8,
"x": 8,
"y": 0
},
"hiddenSeries": false,
"id": 2,
"isNew": true,
"legend": {
"avg": false,
"current": false,
"max": false,
"min": false,
"show": false,
"total": false,
"values": false
},
"lines": true,
"linewidth": 2,
"links": [],
"nullPointMode": "connected",
"options": {
"dataLinks": []
},
"percentage": false,
"pointradius": 5,
"points": false,
"renderer": "flot",
"seriesOverrides": [],
"spaceLength": 10,
"stack": false,
"steppedLine": false,
"targets": [
{
"expr": "rate(redis_commands_processed_total_$namespace{exported_instance=\"$instance\"}[1m])",
"format": "time_series",
"interval": "",
"intervalFactor": 2,
"legendFormat": "",
"metric": "A",
"refId": "A",
"step": 240,
"target": ""
}
],
"thresholds": [],
"timeFrom": null,
"timeRegions": [],
"timeShift": null,
"title": "Commands Executed / sec",
"tooltip": {
"msResolution": false,
"shared": true,
"sort": 0,
"value_type": "cumulative"
},
"type": "graph",
"xaxis": {
"buckets": null,
"mode": "time",
"name": null,
"show": true,
"values": []
},
"yaxes": [
{
"format": "short",
"label": null,
"logBase": 1,
"max": null,
"min": null,
"show": true
},
{
"format": "short",
"label": null,
"logBase": 1,
"max": null,
"min": null,
"show": true
}
],
"yaxis": {
"align": false,
"alignLevel": null
}
},
{
"aliasColors": {},
"bars": false,
"dashLength": 10,
"dashes": false,
"datasource": "${DS_PROMETHEUS}",
"decimals": 2,
"editable": true,
"error": false,
"fill": 1,
"fillGradient": 0,
"grid": {},
"gridPos": {
"h": 7,
"w": 8,
"x": 16,
"y": 0
},
"hiddenSeries": false,
"id": 1,
"isNew": true,
"legend": {
"avg": false,
"current": false,
"max": false,
"min": false,
"show": false,
"total": false,
"values": false
},
"lines": true,
"linewidth": 2,
"links": [],
"nullPointMode": "connected",
"options": {
"dataLinks": []
},
"percentage": true,
"pointradius": 5,
"points": false,
"renderer": "flot",
"seriesOverrides": [],
"spaceLength": 10,
"stack": false,
"steppedLine": false,
"targets": [
{
"expr": "irate(redis_keyspace_hits_total_$namespace{exported_instance=\"$instance\"}[5m])",
"format": "time_series",
"hide": false,
"interval": "",
"intervalFactor": 2,
"legendFormat": "hits",
"metric": "",
"refId": "A",
"step": 240,
"target": ""
},
{
"expr": "irate(redis_keyspace_misses_total_$namespace{exported_instance=\"$instance\"}[5m])",
"format": "time_series",
"hide": false,
"interval": "",
"intervalFactor": 2,
"legendFormat": "misses",
"metric": "",
"refId": "B",
"step": 240,
"target": ""
}
],
"thresholds": [],
"timeFrom": null,
"timeRegions": [],
"timeShift": null,
"title": "Hits / Misses per Sec",
"tooltip": {
"msResolution": false,
"shared": true,
"sort": 0,
"value_type": "individual"
},
"type": "graph",
"xaxis": {
"buckets": null,
"mode": "time",
"name": null,
"show": true,
"values": []
},
"yaxes": [
{
"format": "short",
"label": "",
"logBase": 1,
"max": null,
"min": 0,
"show": true
},
{
"format": "short",
"label": null,
"logBase": 1,
"max": null,
"min": null,
"show": true
}
],
"yaxis": {
"align": false,
"alignLevel": null
}
},
{
"aliasColors": {
"max": "#BF1B00"
},
"bars": false,
"dashLength": 10,
"dashes": false,
"datasource": "${DS_PROMETHEUS}",
"editable": true,
"error": false,
"fill": 1,
"fillGradient": 0,
"grid": {},
"gridPos": {
"h": 7,
"w": 12,
"x": 0,
"y": 7
},
"hiddenSeries": false,
"id": 7,
"isNew": true,
"legend": {
"avg": false,
"current": false,
"hideEmpty": false,
"hideZero": false,
"max": false,
"min": false,
"show": true,
"total": false,
"values": false
},
"lines": true,
"linewidth": 2,
"links": [],
"nullPointMode": "null as zero",
"options": {
"dataLinks": []
},
"percentage": false,
"pointradius": 5,
"points": false,
"renderer": "flot",
"seriesOverrides": [],
"spaceLength": 10,
"stack": false,
"steppedLine": false,
"targets": [
{
"expr": "redis_memory_used_bytes_$namespace{exported_instance=\"$instance\"} ",
"format": "time_series",
"intervalFactor": 2,
"legendFormat": "used",
"metric": "",
"refId": "A",
"step": 240,
"target": ""
},
{
"expr": "redis_memory_max_bytes_$namespace{exported_instance=\"$instance\"} ",
"format": "time_series",
"hide": false,
"intervalFactor": 2,
"legendFormat": "max",
"refId": "B",
"step": 240
}
],
"thresholds": [],
"timeFrom": null,
"timeRegions": [],
"timeShift": null,
"title": "Total Memory Usage",
"tooltip": {
"msResolution": false,
"shared": true,
"sort": 0,
"value_type": "cumulative"
},
"type": "graph",
"xaxis": {
"buckets": null,
"mode": "time",
"name": null,
"show": true,
"values": []
},
"yaxes": [
{
"format": "bytes",
"label": null,
"logBase": 1,
"max": null,
"min": 0,
"show": true
},
{
"format": "short",
"label": null,
"logBase": 1,
"max": null,
"min": null,
"show": true
}
],
"yaxis": {
"align": false,
"alignLevel": null
}
},
{
"aliasColors": {},
"bars": false,
"dashLength": 10,
"dashes": false,
"datasource": "${DS_PROMETHEUS}",
"editable": true,
"error": false,
"fill": 1,
"fillGradient": 0,
"grid": {},
"gridPos": {
"h": 7,
"w": 12,
"x": 12,
"y": 7
},
"hiddenSeries": false,
"id": 10,
"isNew": true,
"legend": {
"avg": false,
"current": false,
"max": false,
"min": false,
"show": true,
"total": false,
"values": false
},
"lines": true,
"linewidth": 2,
"links": [],
"nullPointMode": "connected",
"options": {
"dataLinks": []
},
"percentage": false,
"pointradius": 5,
"points": false,
"renderer": "flot",
"seriesOverrides": [],
"spaceLength": 10,
"stack": false,
"steppedLine": false,
"targets": [
{
"expr": "rate(redis_net_input_bytes_total_$namespace{exported_instance=\"$instance\"}[5m])",
"format": "time_series",
"intervalFactor": 2,
"legendFormat": "{{ input }}",
"refId": "A",
"step": 240
},
{
"expr": "rate(redis_net_output_bytes_total_$namespace{exported_instance=\"$instance\"}[5m])",
"format": "time_series",
"interval": "",
"intervalFactor": 2,
"legendFormat": "{{ output }}",
"refId": "B",
"step": 240
}
],
"thresholds": [],
"timeFrom": null,
"timeRegions": [],
"timeShift": null,
"title": "Network I/O",
"tooltip": {
"msResolution": true,
"shared": true,
"sort": 0,
"value_type": "cumulative"
},
"type": "graph",
"xaxis": {
"buckets": null,
"mode": "time",
"name": null,
"show": true,
"values": []
},
"yaxes": [
{
"format": "bytes",
"label": null,
"logBase": 1,
"max": null,
"min": null,
"show": true
},
{
"format": "short",
"label": null,
"logBase": 1,
"max": null,
"min": null,
"show": true
}
],
"yaxis": {
"align": false,
"alignLevel": null
}
},
{
"aliasColors": {},
"bars": false,
"dashLength": 10,
"dashes": false,
"datasource": "${DS_PROMETHEUS}",
"editable": true,
"error": false,
"fill": 7,
"fillGradient": 0,
"grid": {},
"gridPos": {
"h": 7,
"w": 12,
"x": 0,
"y": 14
},
"hiddenSeries": false,
"id": 5,
"isNew": true,
"legend": {
"alignAsTable": true,
"avg": false,
"current": true,
"max": false,
"min": false,
"rightSide": true,
"show": true,
"total": false,
"values": true
},
"lines": true,
"linewidth": 2,
"links": [],
"nullPointMode": "connected",
"options": {
"dataLinks": []
},
"percentage": false,
"pointradius": 5,
"points": false,
"renderer": "flot",
"seriesOverrides": [],
"spaceLength": 10,
"stack": true,
"steppedLine": false,
"targets": [
{
"expr": "sum (redis_db_keys_$namespace{exported_instance=\"$instance\"}) by (db)",
"format": "time_series",
"interval": "",
"intervalFactor": 2,
"legendFormat": "{{ db }} ",
"refId": "A",
"step": 240,
"target": ""
}
],
"thresholds": [],
"timeFrom": null,
"timeRegions": [],
"timeShift": null,
"title": "Total Items per DB",
"tooltip": {
"msResolution": false,
"shared": true,
"sort": 0,
"value_type": "individual"
},
"type": "graph",
"xaxis": {
"buckets": null,
"mode": "time",
"name": null,
"show": true,
"values": []
},
"yaxes": [
{
"format": "none",
"label": null,
"logBase": 1,
"max": null,
"min": null,
"show": true
},
{
"format": "short",
"label": null,
"logBase": 1,
"max": null,
"min": null,
"show": true
}
],
"yaxis": {
"align": false,
"alignLevel": null
}
},
{
"aliasColors": {},
"bars": false,
"dashLength": 10,
"dashes": false,
"datasource": "${DS_PROMETHEUS}",
"editable": true,
"error": false,
"fill": 7,
"fillGradient": 0,
"grid": {},
"gridPos": {
"h": 7,
"w": 12,
"x": 12,
"y": 14
},
"hiddenSeries": false,
"id": 13,
"isNew": true,
"legend": {
"avg": false,
"current": false,
"max": false,
"min": false,
"show": true,
"total": false,
"values": false
},
"lines": true,
"linewidth": 2,
"links": [],
"nullPointMode": "connected",
"options": {
"dataLinks": []
},
"percentage": false,
"pointradius": 5,
"points": false,
"renderer": "flot",
"seriesOverrides": [],
"spaceLength": 10,
"stack": true,
"steppedLine": false,
"targets": [
{
"expr": "sum (redis_db_keys_$namespace{exported_instance=\"$instance\"}) - sum (redis_db_keys_expiring_$namespace{exported_instance=\"$instance\"}) ",
"format": "time_series",
"interval": "",
"intervalFactor": 2,
"legendFormat": "not expiring",
"refId": "A",
"step": 240,
"target": ""
},
{
"expr": "sum (redis_db_keys_expiring_$namespace{exported_instance=\"$instance\"}) ",
"format": "time_series",
"interval": "",
"intervalFactor": 2,
"legendFormat": "expiring",
"metric": "",
"refId": "B",
"step": 240
}
],
"thresholds": [],
"timeFrom": null,
"timeRegions": [],
"timeShift": null,
"title": "Expiring vs Not-Expiring Keys",
"tooltip": {
"msResolution": false,
"shared": true,
"sort": 0,
"value_type": "individual"
},
"type": "graph",
"xaxis": {
"buckets": null,
"mode": "time",
"name": null,
"show": true,
"values": []
},
"yaxes": [
{
"format": "short",
"label": null,
"logBase": 1,
"max": null,
"min": null,
"show": true
},
{
"format": "short",
"label": null,
"logBase": 1,
"max": null,
"min": null,
"show": true
}
],
"yaxis": {
"align": false,
"alignLevel": null
}
},
{
"aliasColors": {
"evicts": "#890F02",
"memcached_items_evicted_total{instance=\"172.17.0.1:9150\",job=\"prometheus\"}": "#890F02",
"reclaims": "#3F6833"
},
"bars": false,
"dashLength": 10,
"dashes": false,
"datasource": "${DS_PROMETHEUS}",
"editable": true,
"error": false,
"fill": 1,
"fillGradient": 0,
"grid": {},
"gridPos": {
"h": 7,
"w": 12,
"x": 0,
"y": 21
},
"hiddenSeries": false,
"id": 8,
"isNew": true,
"legend": {
"avg": false,
"current": false,
"max": false,
"min": false,
"show": true,
"total": false,
"values": false
},
"lines": true,
"linewidth": 2,
"links": [],
"nullPointMode": "connected",
"options": {
"dataLinks": []
},
"percentage": false,
"pointradius": 5,
"points": false,
"renderer": "flot",
"seriesOverrides": [
{
"alias": "reclaims",
"yaxis": 2
}
],
"spaceLength": 10,
"stack": false,
"steppedLine": false,
"targets": [
{
"expr": "sum(rate(redis_expired_keys_total_$namespace{exported_instance=\"$instance\"}[5m])) by (instance)",
"format": "time_series",
"hide": false,
"interval": "",
"intervalFactor": 2,
"legendFormat": "expired",
"metric": "",
"refId": "A",
"step": 240,
"target": ""
},
{
"expr": "sum(rate(redis_evicted_keys_total_$namespace{exported_instance=\"$instance\"}[5m])) by (instance)",
"format": "time_series",
"interval": "",
"intervalFactor": 2,
"legendFormat": "evicted",
"refId": "B",
"step": 240
}
],
"thresholds": [],
"timeFrom": null,
"timeRegions": [],
"timeShift": null,
"title": "Expired / Evicted",
"tooltip": {
"msResolution": false,
"shared": true,
"sort": 0,
"value_type": "cumulative"
},
"type": "graph",
"xaxis": {
"buckets": null,
"mode": "time",
"name": null,
"show": true,
"values": []
},
"yaxes": [
{
"format": "short",
"label": null,
"logBase": 1,
"max": null,
"min": null,
"show": true
},
{
"format": "short",
"label": null,
"logBase": 1,
"max": null,
"min": null,
"show": true
}
],
"yaxis": {
"align": false,
"alignLevel": null
}
},
{
"aliasColors": {},
"bars": false,
"dashLength": 10,
"dashes": false,
"datasource": "${DS_PROMETHEUS}",
"editable": true,
"error": false,
"fill": 8,
"fillGradient": 0,
"grid": {},
"gridPos": {
"h": 7,
"w": 12,
"x": 12,
"y": 21
},
"hiddenSeries": false,
"id": 14,
"isNew": true,
"legend": {
"avg": false,
"current": false,
"max": false,
"min": false,
"show": true,
"total": false,
"values": false
},
"lines": true,
"linewidth": 1,
"links": [],
"nullPointMode": "connected",
"options": {
"dataLinks": []
},
"percentage": false,
"pointradius": 5,
"points": false,
"renderer": "flot",
"seriesOverrides": [],
"spaceLength": 10,
"stack": true,
"steppedLine": false,
"targets": [
{
"expr": "topk(5, irate(redis_commands_total_$namespace{exported_instance=\"$instance\"} [1m]))",
"format": "time_series",
"interval": "",
"intervalFactor": 2,
"legendFormat": "{{ cmd }}",
"metric": "redis_command_calls_total",
"refId": "A",
"step": 240
}
],
"thresholds": [],
"timeFrom": null,
"timeRegions": [],
"timeShift": null,
"title": "Command Calls / sec",
"tooltip": {
"msResolution": true,
"shared": true,
"sort": 0,
"value_type": "individual"
},
"type": "graph",
"xaxis": {
"buckets": null,
"mode": "time",
"name": null,
"show": true,
"values": []
},
"yaxes": [
{
"format": "short",
"label": null,
"logBase": 1,
"max": null,
"min": null,
"show": true
},
{
"format": "short",
"label": null,
"logBase": 1,
"max": null,
"min": null,
"show": true
}
],
"yaxis": {
"align": false,
"alignLevel": null
}
},
{
"aliasColors": {},
"bars": false,
"dashLength": 10,
"dashes": false,
"datasource": "${DS_PROMETHEUS}",
"fill": 1,
"fillGradient": 0,
"gridPos": {
"h": 7,
"w": 12,
"x": 0,
"y": 28
},
"hiddenSeries": false,
"id": 16,
"legend": {
"avg": false,
"current": false,
"max": false,
"min": false,
"show": true,
"total": false,
"values": false
},
"lines": true,
"linewidth": 1,
"links": [],
"nullPointMode": "null",
"options": {
"dataLinks": []
},
"percentage": false,
"pointradius": 2,
"points": false,
"renderer": "flot",
"seriesOverrides": [],
"spaceLength": 10,
"stack": false,
"steppedLine": false,
"targets": [
{
"expr": "redis_connected_clients_$namespace{exported_instance=\"$instance\"}",
"format": "time_series",
"intervalFactor": 1,
"refId": "A"
}
],
"thresholds": [],
"timeFrom": null,
"timeRegions": [],
"timeShift": null,
"title": "Redis connected clients",
"tooltip": {
"shared": true,
"sort": 0,
"value_type": "individual"
},
"type": "graph",
"xaxis": {
"buckets": null,
"mode": "time",
"name": null,
"show": true,
"values": []
},
"yaxes": [
{
"format": "short",
"label": null,
"logBase": 1,
"max": null,
"min": null,
"show": true
},
{
"format": "short",
"label": null,
"logBase": 1,
"max": null,
"min": null,
"show": true
}
],
"yaxis": {
"align": false,
"alignLevel": null
}
}
],
"refresh": "30s",
"schemaVersion": 21,
"style": "dark",
"tags": [
"prometheus",
"rds"
],
"templating": {
"list": [
{
"current": {
"text": "Prometheus",
"value": "Prometheus"
},
"hide": 0,
"includeAll": false,
"label": "Prometheus",
"multi": false,
"name": "DS_PROMETHEUS",
"options": [],
"query": "prometheus",
"refresh": 1,
"regex": "",
"skipUrlSync": false,
"type": "datasource"
},
{
"allValue": null,
"current": {},
"datasource": "$DS_PROMETHEUS",
"definition": "label_values({instance=\"rds\"}, namespace)",
"hide": 0,
"includeAll": false,
"label": "Namespace",
"multi": false,
"name": "namespace",
"options": [],
"query": "label_values({instance=\"rds\"}, namespace)",
"refresh": 2,
"regex": "",
"skipUrlSync": false,
"sort": 0,
"tagValuesQuery": "",
"tags": [],
"tagsQuery": "",
"type": "query",
"useTags": false
},
{
"allValue": null,
"current": {},
"datasource": "$DS_PROMETHEUS",
"definition": "label_values({instance=\"rds\",namespace=\"$namespace\"}, pod)",
"hide": 0,
"includeAll": false,
"label": "Pod Name",
"multi": false,
"name": "pod_name",
"options": [],
"query": "label_values({instance=\"rds\",namespace=\"$namespace\"}, pod)",
"refresh": 2,
"regex": "",
"skipUrlSync": false,
"sort": 1,
"tagValuesQuery": "",
"tags": [],
"tagsQuery": "",
"type": "query",
"useTags": false
},
{
"allValue": null,
"current": {},
"datasource": "$DS_PROMETHEUS",
"definition": "label_values({instance=\"rds\",namespace=\"$namespace\",pod=\"$pod_name\"}, exported_instance)",
"hide": 0,
"includeAll": false,
"label": null,
"multi": false,
"name": "instance",
"options": [],
"query": "label_values({instance=\"rds\",namespace=\"$namespace\",pod=\"$pod_name\"}, exported_instance)",
"refresh": 2,
"regex": "",
"skipUrlSync": false,
"sort": 1,
"tagValuesQuery": "",
"tags": [],
"tagsQuery": "",
"type": "query",
"useTags": false
}
]
},
"time": {
"from": "now-24h",
"to": "now"
},
"timepicker": {
"refresh_intervals": [
"5s",
"10s",
"30s",
"1m",
"5m",
"15m",
"30m",
"1h",
"2h",
"1d"
],
"time_options": [
"5m",
"15m",
"1h",
"6h",
"12h",
"24h",
"2d",
"7d",
"30d"
]
},
"timezone": "browser",
"title": "RDS Dashboard for Prometheus RDS Exporter (helm stable/rds-ha)",
"uid": "xDLNRKUWzRDS",
"version": 4
}
上传后点load
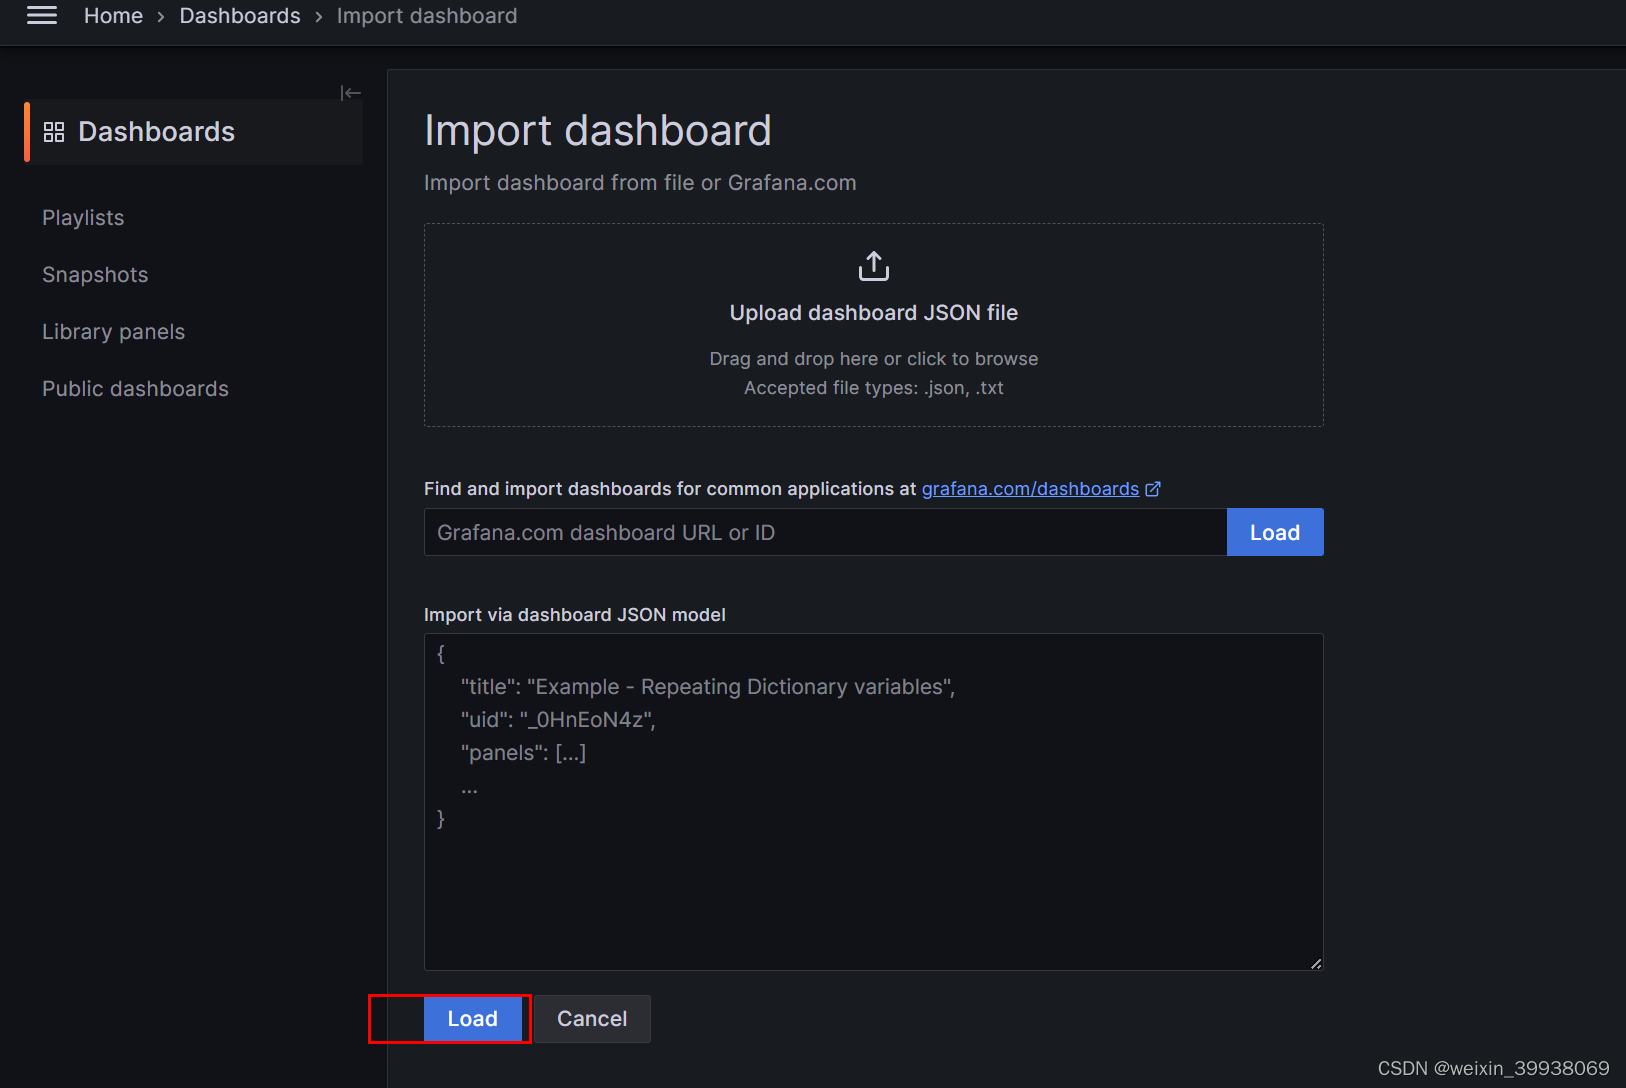
之后可以在这里找回自己新建的仪表盘
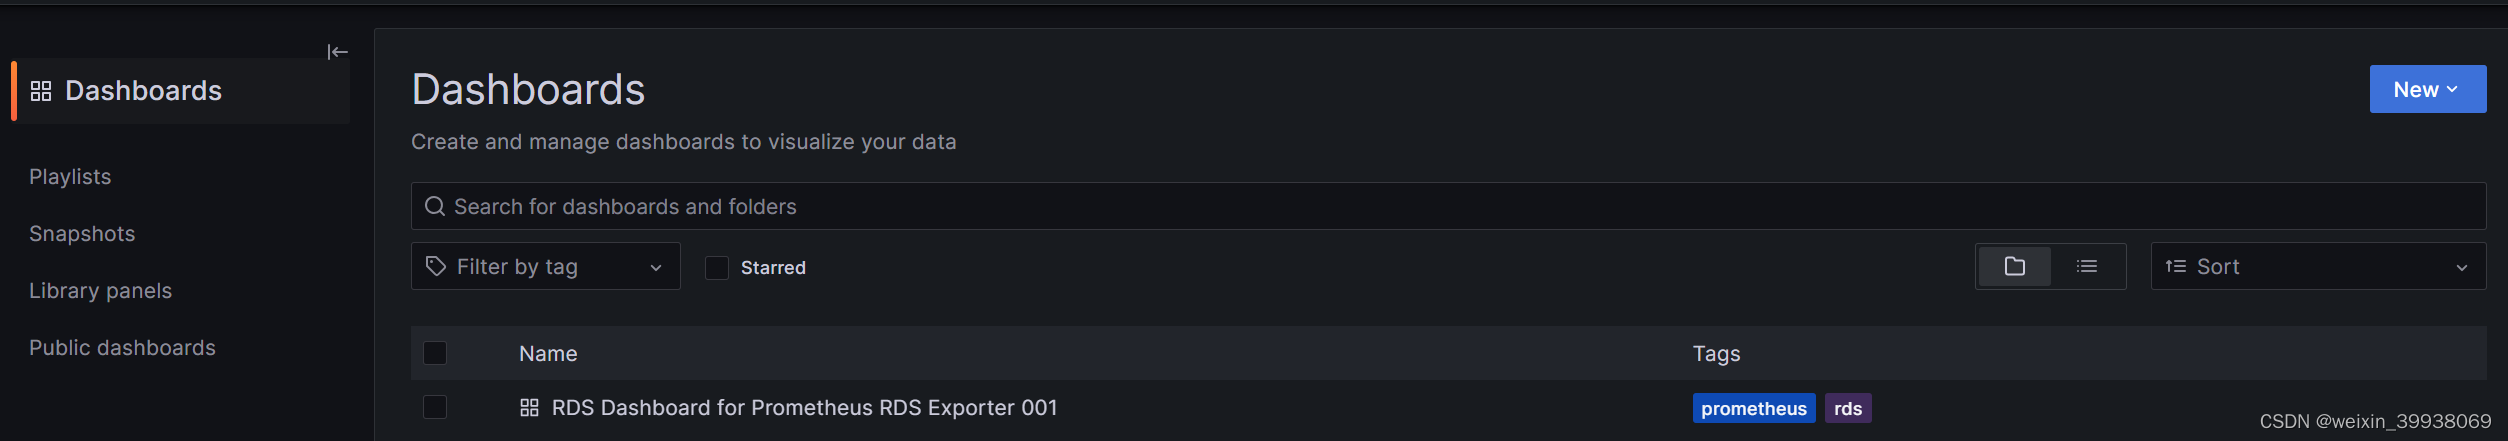
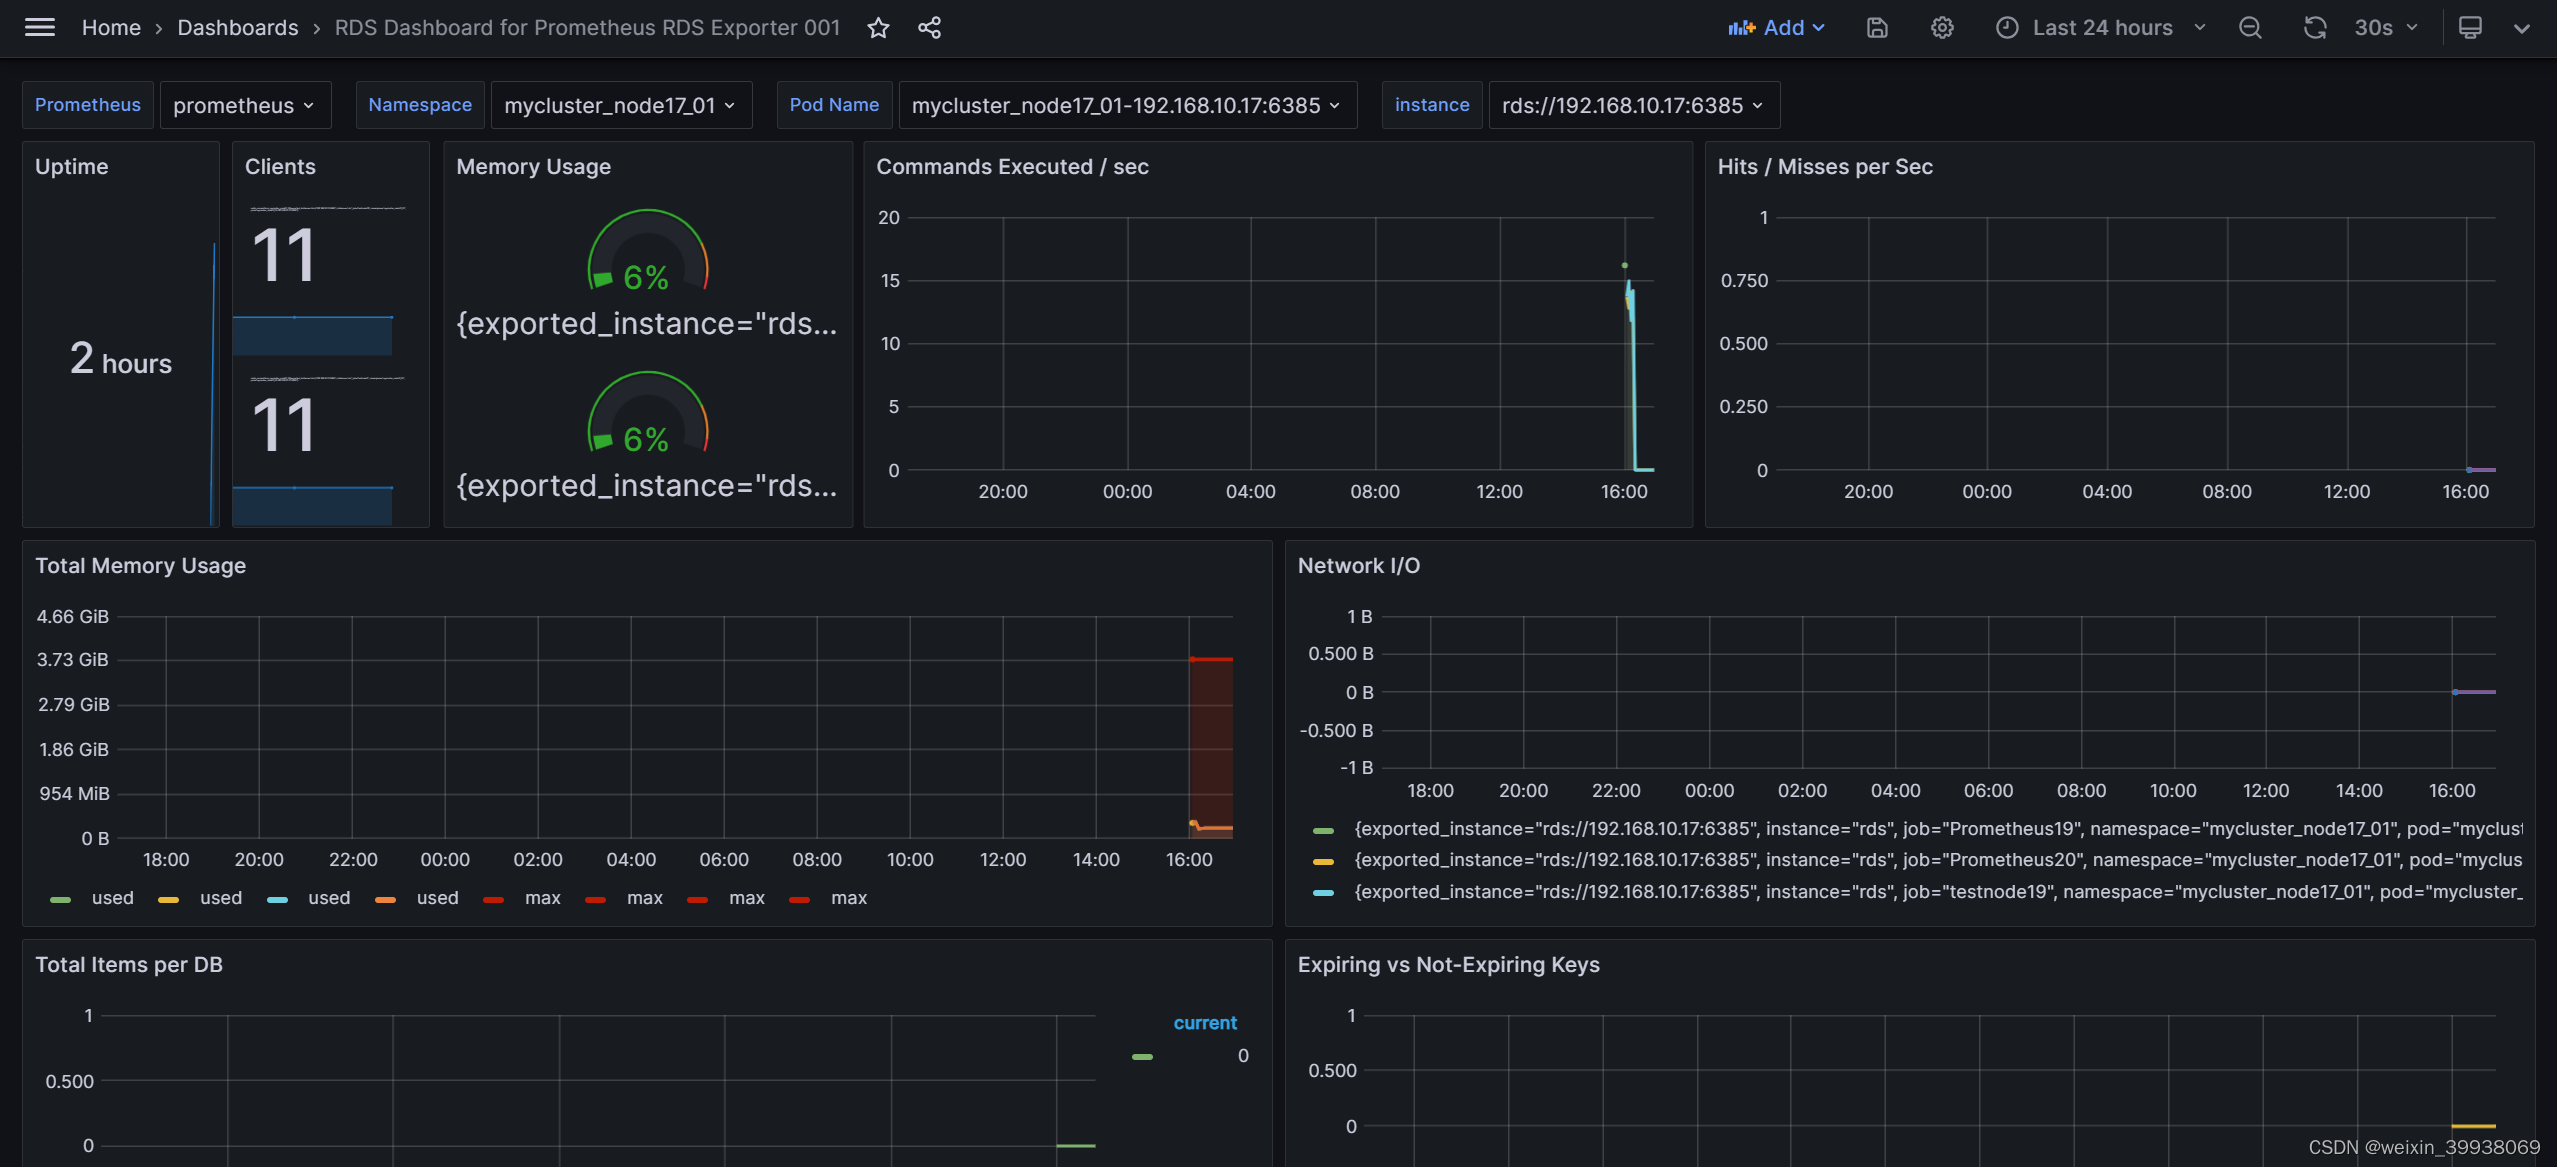
模板是已经适配了rds的,如果你想要用redis的,请自行上网搜索,正常配置好后,效果图如下:


 1万+
1万+


 被折叠的 条评论
为什么被折叠?
被折叠的 条评论
为什么被折叠?
 到【灌水乐园】发言


