


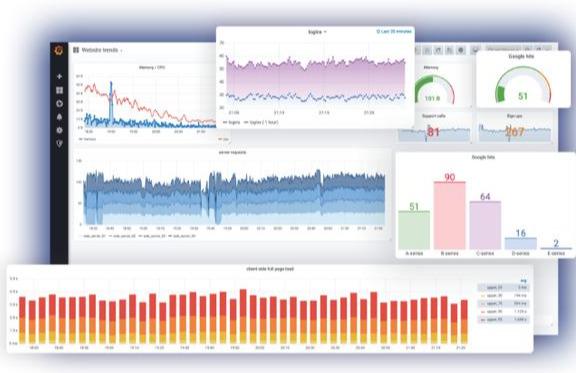
先来看一张grafana的效果图
Grafana 是一款开源的可视化和分析软件。 它允许查询、可视化、警告和探索项目的各种指标,无论它们存储在哪里。 简单地说,它为你提供了将时间序列数据库(TSDB)数据转换为漂亮的图形和可视化的工具。
第一步 安装grafana
grafana支持的操作系统涵盖了目前主流的所有的操作系统,linux(Ubuntu,centos,macos,windows等)
当然也支持在容器中安装和使用(Docker 镜像)
例如:ubuntu环境的安装
sudo apt-get install -y apt-transport-httpssudo apt-get install -y software-properties-common wgetwget -q -O - https://packages.grafana.com/gpg.key | sudo apt-key add -# Alternatively you can add the beta repository, see in the table abovesudo add-apt-repository "deb https://packages.grafana.com/enterprise/deb stable main"sudo apt-get updatesudo apt-get install grafana-enterprise 最低0.47元/天 解锁文章


 被折叠的 条评论
为什么被折叠?
被折叠的 条评论
为什么被折叠?
 到【灌水乐园】发言


