


1.颜色(color):
八种内建的颜色缩写
b : blue
g : green
r : red
c : cyan
m : magenta
y : yellow
k : block
w : white
其他的颜色表示方法
(1).灰色阴影(通过数值来设置)
(2).html中最常见的十六进制表示
(3).RGB元组
示例如下:
#!/usr/bin/python
#coding: utf-8
import numpy as np
import matplotlib.pyplot as plt
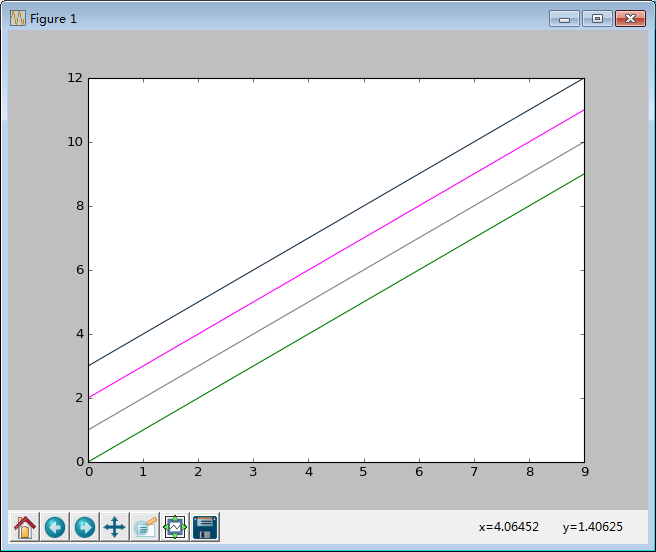
x = np.arange(10)
# 使用内建的方法
plt.plot(x, color = "g")
# 使用灰色阴影(通过数值指定)
plt.plot(x + 1, color = "0.5")
# 使用html最常用的16进制表示
plt.plot(x + 2, color = "#FF00FF")
# 使用RGB元组的形式
plt.plot(x + 3, color = (0.1, 0.2, 0.3))
plt.show()
对于下面三种对颜色的设置,可以通过百度轻轻松松获取到,直接搜索颜色代码就可以,会提示很多,随便选一个自己认为合适的就可以。
2.点(marker)的样式(共有23种)
character
description
'8'
octagon
'.'
point marker
','
pixel marker
'o'
circle marker
'v'
triangle_down marker
'^'
triangle_up marker
'<'
triangle_left marker
'>'
triangle_right marker
'1'
tri_down marker
'2'
tri_up marker
'3'
tri_left marker
'4'
tri_right marker
's'
square marker
'p'
pentagon marker
'*'
star marker
'h'
hexagon1 marker
'H'
hexagon2 marker
'+'
plus marker
'x'
x marker
'D'
diamond marker
'd'
thin_diamond marker
'|'
vline marker
'_'
hline marker
#!/usr/bin/python
#coding: utf-8
import numpy as np
import matplotlib.pyplot as plt
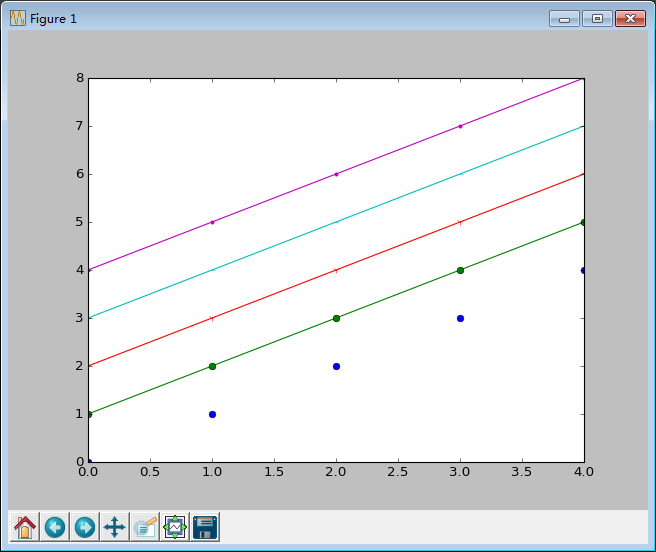
x = np.arange(1, 6)
# 在画多条线段的时候,如果说对颜色没有特别的要求,其实没必要进行指定,
# matplotlib会自动的设置颜色的类型,便于区分
# marker 显式指定的话,画出的是线段,
# 如果不显式指定,画出的是给定的类型,显示结果是一些点,比如使用 _(下划线) 的话,
# matplotlib内部也会分辨出是marker对象
plt.plot(x - 1, "o")
plt.plot(x, marker = "o")
plt.plot(x + 1, marker = "1")
plt.plot(x + 2, marker = "_")
plt.plot(x + 3, marker = ".")
plt.show()
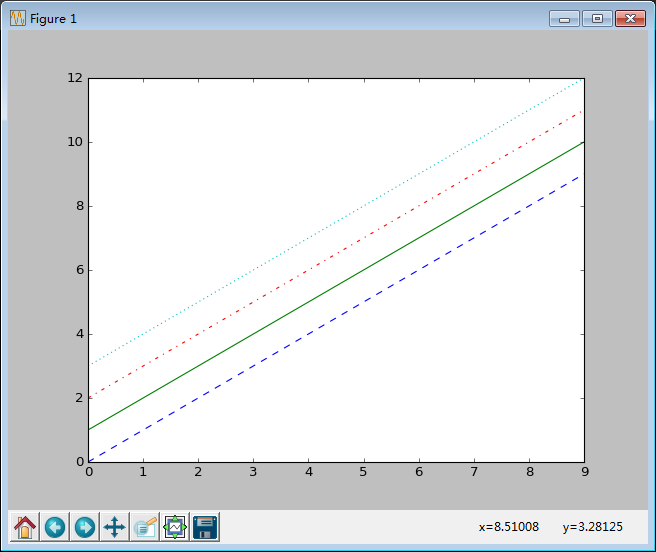
3.线的样式
线共有四种样式, 不需要显示指定
- 实线
-- 虚线
-. 点划线
: 点线
#!/usr/bin/python
#coding: utf-8
import numpy as np
import matplotlib.pyplot as plt
x = np.arange(10)
plt.plot(x, "--")
plt.plot(x + 1, "-")
plt.plot(x + 2, "-.")
plt.plot(x + 3, ":")
plt.show()
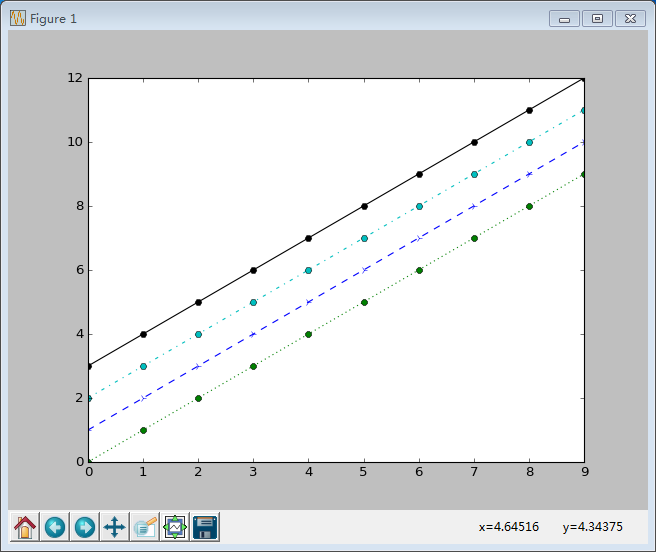
4.样式字符串
可以将颜色,点型,线型写成一个字符串(颜色只能是内建的8种颜色类型的一种,不能是后面提到的那三种情况,测试结果是这样的)
#!/usr/bin/python
#coding: utf-8
import numpy as np
import matplotlib.pyplot as plt
x = np.arange(10)
plt.plot(x, "g8:")
plt.plot(x + 1, "b4--")
plt.plot(x + 2, "cH-.")
plt.plot(x + 3, "kH-")
plt.show()


 1177
1177


 被折叠的 条评论
为什么被折叠?
被折叠的 条评论
为什么被折叠?
 到【灌水乐园】发言


