


 作者简介
作者简介
马听,多年 DBA 实战经验,对 MySQL、 Redis、ClickHouse 等数据库有一定了解,专栏《一线数据库工程师带你深入理解 MySQL》、《Redis 运维实战》作者。ClickTail 是 Altinity 公司开发的一个 Go 语言的日志解析、传输工具,可解析 MySQL 慢查询日志、Nginx 日志、MongoDB 日志等,并能直接写入 ClickHouse。 今天来聊聊如何通过 ClickTail + CH 实现 MySQL 慢查询日志实时展示(实验操作系统:CentOS 7.8;CH 版本:20.10.3)。
1 安装 MySQL
8.0 安装参考:https://dev.mysql.com/doc/refman/8.0/en/linux-installation.html2 安装 ClickHouse
ClickHouse 单机版安装参考:https://clickhouse.tech/docs/zh/getting-started/install/3 创建慢查询表
登录 ClickHouse:clickhouse-clientCREATE DATABASE IF NOT EXISTS clicktail;CREATE TABLE IF NOT EXISTS clicktail.mysql_slow_log(`_time` DateTime,`_date` Date default toDate(`_time`),`_ms` UInt32,client String,query String,normalized_query String,query_time Float32,user String,statement String,tables String,schema String,rows_examined UInt32,rows_sent UInt32,lock_time Float32,connection_id UInt32,error_num UInt32,killed UInt16,rows_affected UInt32,database String,comments String,bytes_sent UInt32,tmp_tables UInt8,tmp_disk_tables UInt8,tmp_table_sizes UInt32,transaction_id String,query_cache_hit UInt8,full_scan UInt8,full_join UInt8,tmp_table UInt8,tmp_table_on_disk UInt8,filesort UInt8,filesort_on_disk UInt8,merge_passes UInt32,IO_r_ops UInt32,IO_r_bytes UInt32,IO_r_wait_sec Float32,rec_lock_wait_sec Float32,queue_wait_sec Float32,pages_distinct UInt32,sl_rate_type String,sl_rate_limit UInt16,hosted_on String,read_only UInt8,replica_lag UInt64,role String) ENGINE = MergeTree(`_date`, (`_time`, query), 8192);cat ./mysql_slow_log.sql | clickhouse-client --multiline4 配置 ClickTail
安装 ClickTail,参考:https://github.com/Altinity/clicktail 修改配置文件:vim /etc/clicktail/clicktail.conf[Application Options]APIHost = http://localhost:8123/[Required Options]ParserName = mysqlLogFiles = /usr/local/mysql/data/mysql-slow.logDataset = clicktail.mysql_slow_log[MySQL Parser Options]Host = localhost:3306User = clicktail_rPass = IJNbgt666create user 'clicktail_r'@'localhost' identified with mysql_native_password by 'IJNbgt666';GRANT SELECT ON *.* TO 'clicktail_r'@'localhost';5 启动 ClickTail
service clicktail start6 慢日志分析
如果 MySQL 端有慢查询,则会实时写入 CH。 可在 CH 中进行如下相关操作查出对应的慢查询:6.1 显示最慢的 10 条 SQL
select _time, query, round(query_time, 4) AS latency from mysql_slow_log where query != 'COMMIT' order by query_time DESC LIMIT 10;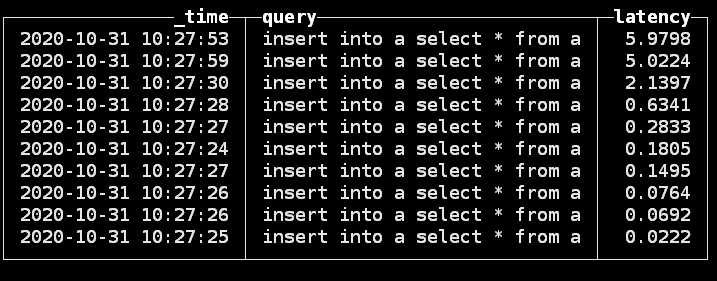
6.2 显示锁时间最长的 10 条 SQL
select query,round(query_time, 4) AS latency, round(lock_time, 6) AS lock_time from mysql_slow_log where query != 'COMMIT' and lock_time >0 order by lock_time desc limit 10;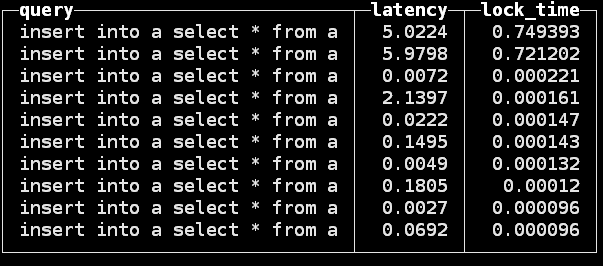
6.3 根据平均耗时查询
查看数据库慢查询语句平均耗时,75% 和 99% 该类语句的平均耗时,并按照该类语句造成的负载进行排序:select normalized_query, count(*) AS count, round(avg(query_time), 4) AS latency_avg, round(quantile(0.75)(query_time), 4) AS latency_p75, round(quantile(0.99)(query_time), 4) AS latency_p99, round((latency_avg * count) / (max(_time) - min(_time)), 4) AS load from mysql_slow_log where query != 'COMMIT' GROUP BY normalized_query HAVING count > 1 ORDER BY load DESC limit 10; 专栏《ClickHouse 实战笔记》系列文章推荐
ClickHouse 实战笔记 第01期:Kafka 数据同步到 ClickHouse
欢迎加入 ClickHouse 交流群,入群请添加下方群秘微信,备注“ClickHouse”,等待群秘邀你入群。
专栏《ClickHouse 实战笔记》系列文章推荐
ClickHouse 实战笔记 第01期:Kafka 数据同步到 ClickHouse
欢迎加入 ClickHouse 交流群,入群请添加下方群秘微信,备注“ClickHouse”,等待群秘邀你入群。


LIKECOLUMN
悦专栏
在这里,学好编程
做更优秀的 IT人!


 2202
2202


 被折叠的 条评论
为什么被折叠?
被折叠的 条评论
为什么被折叠?
 到【灌水乐园】发言


