


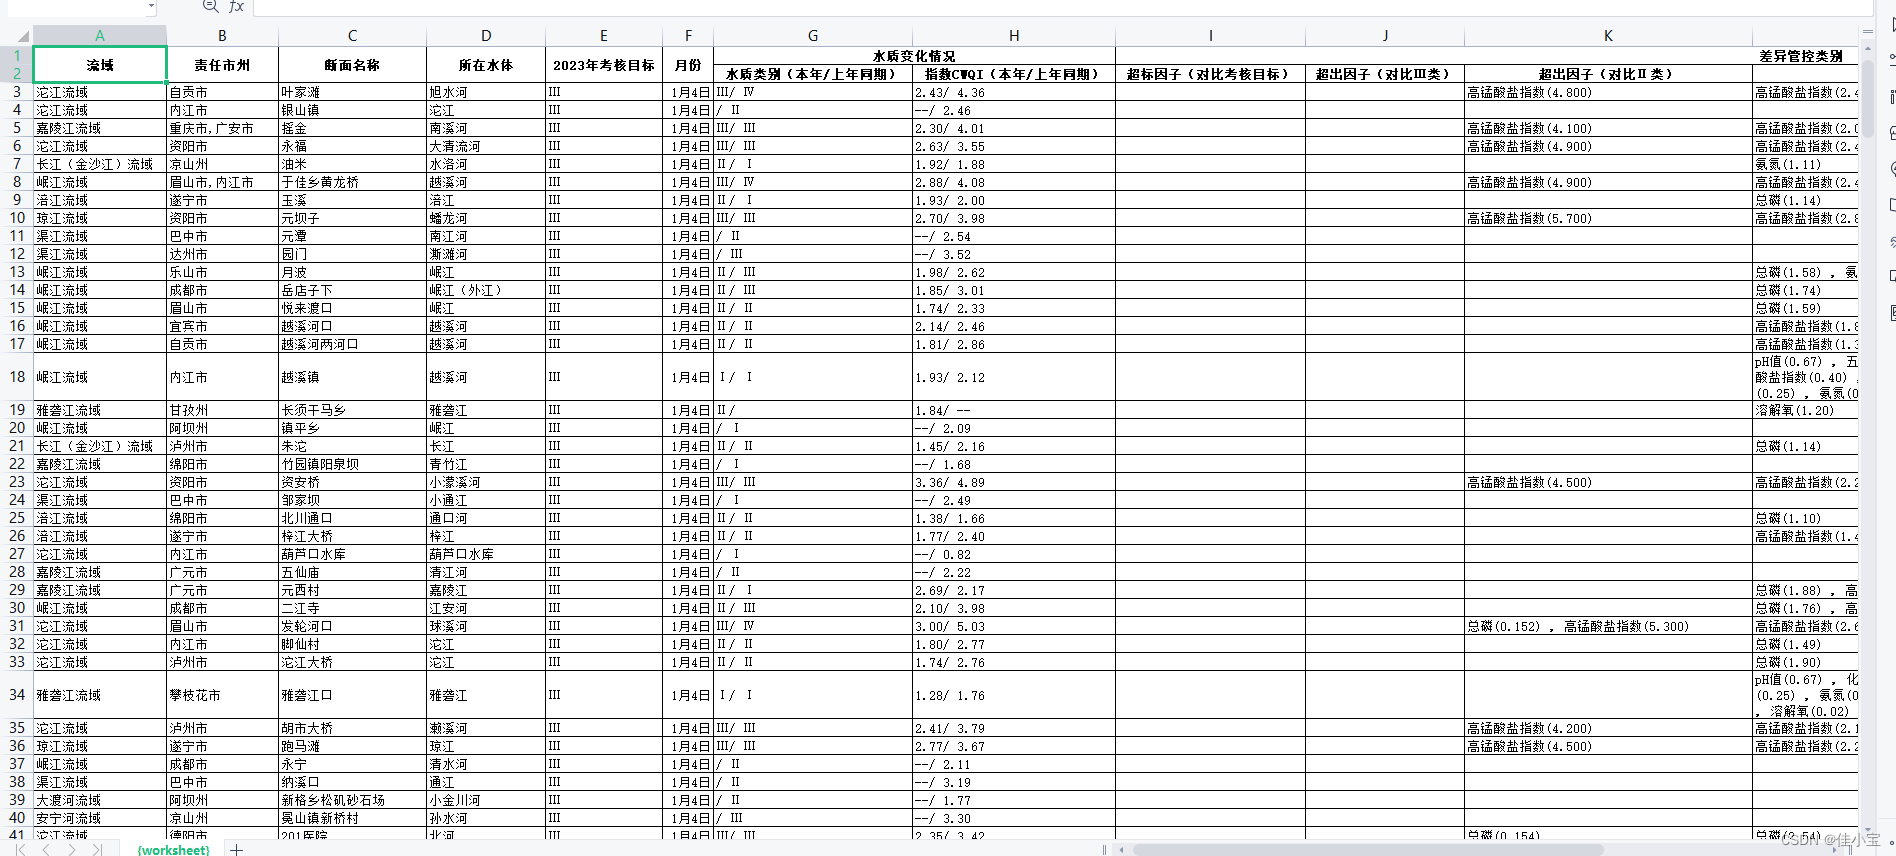

<table class="common_table" id="tabDiv1">
    <thead>
        <tr>
		    <th rowspan="2">流域</th>
		    <th rowspan="2">责任市州</th>
		    <th rowspan="2">断面名称</th>
		    <th rowspan="2">所在水体</th>
		    <th rowspan="2">{{yearStr}}年考核目标</th>
		    <th rowspan="2">月份</th>
		    <th colspan="2">水质变化情况</th>
		    <th colspan="6">差异管控类别</th>
		    <th rowspan="2">趋势研判</th>
		    <th rowspan="2">目标预警</th>
	    </tr>
        <tr>
		    <th>水质类别(本年/上年同期)</th>
			<th>指数CWQI(本年/上年同期)</th>
			<th>超标因子(对比考核目标)</th>
			<th>超出因子(对比Ⅲ类)</th>
			<th>超出因子(对比Ⅱ类)</th>
			<th>定类因子</th>
			<th>超出频次(对比Ⅲ类)</th>
			<th>超出频次(对比Ⅱ类)</th>

		</tr>

    </thead>
    <tbody>
        <tr>
            <td>1111</td>
            <td>1111</td>
            <td>1111</td>
            <td>1111</td>
            <td>1111</td>
            <td>1111</td>
            <td>1111</td>
            <td>1111</td>
            <td>1111</td>
            <td>1111</td>
        </tr>

    </tbody>
</table>
<div class="item-echarts hydrologyForecast" id="Line" ref="Line"></div>
//js部分

base64(content) {
	return window.btoa(unescape(encodeURIComponent(content)));
},


tableToExcel() {
            //这里把echart转化成图片,也可以把这个放在生成echart的位置,但是我这边测试生成的图                        //片没有数据
            this.imagesBase64=this.myChart.getDataURL('png');
			this.$message({
		          message: '正在导出...',
		          type: 'success',
		           offset:'150'
		     });

           // 这里是要导出的table的id
			var excelContent = $("#tabDiv1").html();
            //这里把图片添加在img标签
            var images='<img src="'+this.imagesBase64+'"/>';
			var excelFile = "<html xmlns:o='urn:schemas-microsoft-com:office:office' xmlns:x='urn:schemas-microsoft-com:office:excel' xmlns='http://www.w3.org/TR/REC-html40'>";
			excelFile += "<head><!--[if gte mso 9]><xml><x:ExcelWorkbook><x:ExcelWorksheets><x:ExcelWorksheet><x:Name>{worksheet}</x:Name><x:WorksheetOptions><x:DisplayGridlines/></x:WorksheetOptions></x:ExcelWorksheet></x:ExcelWorksheets></x:ExcelWorkbook></xml><![endif]--></head>";
			excelFile += "<body><table width='10%' border='1'>";
			excelFile += excelContent;
			excelFile += "</table>"
			excelFile += images;
			excelFile += "</body>";
			excelFile += "</html>";
			var link = "data:application/vnd.ms-excel;base64," +                         this.base64(excelFile);
			var a = document.createElement("a");
            //这里是要导出的文件名字
			a.download = "断面文件" + ".xlsx";
			a.href = link;
			a.click();
},
//echart部分
		EchartLine(dataX,seriesData1,seriesData2){
				this.myChart = echarts.init(this.$refs.Line); //图标初始化
				var option = {
                        color:['#7030A0','#ED7D31'],
                         title: {
					      left: 'center',
					      text: '重点流域水功能区达标情况',
					      top:10,
					      textStyle:{
					      	fontSize:16
					      }
					    },
                        tooltip: {
                            trigger: 'axis',

                        },
						legend: {
                        	bottom:"0px",
                            left: 'center',
							data:['达标谁功能区个数','水功能区达标率']
                        },
                        grid: {
                            top:"20%",
                            left: '5%',
                            right: '5%',
                            bottom: '10%',
                            containLabel: true
                        },
                        xAxis: {
                           /// boundaryGap: false,
                            type: 'category',
                            data:dataX,
                            axisLabel:{
                                interval:0,
                                rotate:70,
                            },

                        },
                        yAxis: [
							{
								type: 'value',
								axisLine: {
									lineStyle: {
										color: '#7030A0'
									}
								},
							},
							{
								type: 'value',
								position: 'right',
								axisLine: {
									lineStyle: {
										color: '#ED7D31'
									}
								},
								axisLabel: {
									formatter: '{value} %'
								}
							},

						],
                        series: [
							{
								name:'达标谁功能区个数',
								type:'bar',
								"barMaxWidth":"30%",
								data:seriesData1
							},
							{
								name:'水功能区达标率',
								type:'line',
								yAxisIndex: 1,
								data:seriesData2
							}
						]
                    };
					this.myChart.setOption(option,true);


			}


 799
799


 被折叠的 条评论
为什么被折叠?
被折叠的 条评论
为什么被折叠?
 到【灌水乐园】发言


