


效果
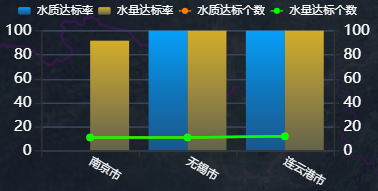
功能
- 防止悬浮框溢出
- 图例图标宽高度修改
- 柱状图之间间距设置
- X轴数据名称柱状图内显示(注释)
- X轴数据名称倾斜显示
- X轴文字显示优先级(注释)
- 柱状图初始显示数量
- 柱状图颜色渐变
- 折线图点大小
- 鼠标点击,滚动,拖动柱状图展示所有数据
代码
let option = {
    tooltip: {
        trigger: 'axis',
        confine: true, // 防止悬浮框溢出图表
    },
    grid: {
        bottom: "21.2%",
        height: 96,
    },
    legend: {
        data: ['水质达标率', '水量达标率', '水质达标个数', '水量达标个数'],
        textStyle: {  // 图例样式
            color: "#fff",
            fontSize: 9
        },
        itemWidth: 10,  // 设置宽度 图例图标的宽高
        itemHeight: 6, // 设置高度
        itemGap: 4 // 设置间距  图例间距
        // bottom: "1%",
    },
    color: ["#FF7F00", "#00FF00", "#4472C4", "#FFC000"],
    xAxis: [
        {
            // type: 'category',
            data: xAxisData,  // x轴数据
            axisPointer: {
                type: 'shadow'
            },
            axisLabel: {
                // inside: true,  // x轴文字显示在柱状图内
                // formatter: function (value) {
                //     return value.split("").join("\n");
                // },
                textStyle: {
                    fontSize: 9,
                    itemSize: '',
                    color: '#fff'
                },
                rotate: -30,  // x轴文字倾斜显示
            },
            axisLine: {
                // lineStyle: {color: '#37445A'}    // x轴坐标轴颜色
            },
            // z: 10,  // 显示优先级
            splitLine: {  // 网格线样式
                show: false,
                lineStyle: {
                    color: ['#37445A'],
                    width: 1,
                    type: 'solid'
                }
            }
        }
    ],
    yAxis: [
        {
            type: 'value',
            name: '',
            min: 0,
            max: 20,
            // interval: 40,
            axisLabel: {
                formatter: '{value}',
                textStyle: {
                    color: '#fff'
                }
            },
            axisLine: {
                // lineStyle: {color: '#fff'}    // y轴坐标轴颜色
            },
            splitLine: {
                show: true,
                lineStyle: {
                    color: ['#37445A'],
                    width: 1,
                    type: 'solid'
                }
            }
        },
        {
            type: 'value',
            name: '',
            min: 0,
            max: 20,
            // interval: 40,
            axisLabel: {
                formatter: '{value}',
                textStyle: {
                    color: '#fff'
                }
            },
            axisLine: {
                // lineStyle: {color: '#fff'}    // y轴坐标轴颜色
            },
            splitLine: {
                show: true,
                lineStyle: {
                    color: ['#37445A'],
                    width: 1,
                    type: 'solid'
                }
            }
        }
    ],
    dataZoom: [  // 展示前10条数据
        {
            type: 'inside',
            startValue: 0,
            endValue: 9
        }
    ],
    series: [
        {
            name: '水质达标个数',
            type: 'line',
            yAxisIndex: 1,
            symbol: 'circle',     //设定为实心点
            symbolSize: 6,   //设定实心点的大小
            data: lineDataFirst
        },
        {
            name: '水量达标个数',
            type: 'line',
            yAxisIndex: 1,
            symbol: 'circle',     //设定为实心点
            symbolSize: 6,   //设定实心点的大小
            data: lineDataSecond
        },
        {
            name: '水质达标率',
            type: 'bar',
            itemStyle: {  //柱状图颜色渐变
                color: new echarts.graphic.LinearGradient(
                    0, 0, 0, 1,
                    [
                        {offset: 0, color: '#079FF9'},
                        {offset: 0.5, color: '#0F76BC'},
                        {offset: 1, color: '#1A568A'}
                    ]
                )
            },
            data: barDataFirst
        },
        {
            name: '水量达标率',
            type: 'bar',
            barGap: '0%',  // 柱状图间距0
		 itemStyle: {
                color: new echarts.graphic.LinearGradient(
                    0, 0, 0, 1,
                    [
                        {offset: 0, color: '#D2AD29'},
                        {offset: 0.5, color: '#9C893F'},
                        {offset: 1, color: '#63634B'}
                    ]
                )
            },
            data: barDataSecond
        },
    ]
};
this.drinkBarLine = this.$echarts.init(document.getElementById(id));
// 页面刷时延迟加载,以便柱状图自适应父级div宽高
setTimeout(() => {
    this.drinkBarLine.resize();
}, 500);
this.drinkBarLine.setOption(option);

// 鼠标点击,滚动,拖动柱状图展示所有数据
var zoomSize = 6;
let _this = this;
this.drinkBarLine.on('click', function (params) {
    _this.drinkBarLine.dispatchAction({
        type: 'dataZoom',
        startValue: xAxisData[Math.max(params.dataIndex - zoomSize / 2, 0)],
        endValue: xAxisData[Math.min(params.dataIndex + zoomSize / 2, (barDataFirst).length - 1)]
    });
});


 1万+
1万+


 被折叠的 条评论
为什么被折叠?
被折叠的 条评论
为什么被折叠?
 到【灌水乐园】发言


