


 LiveCharts2是一个跨平台的数据可视化库,支持多种图表类型和动态更新数据。在WinForms中,通过NuGet安装后,可以使用CartesianChart控件创建动态曲线图。文章展示了如何配置自定义数据类型MeasureModel的映射,以避免LiveCharts无法识别数据类型的错误,同时提到了在大量数据时可能出现的性能问题。
1 LiveCharts2 是什么?
GitHub:https://github.com/beto-rodriguez/LiveCharts2
LiveCharts是一个.net的数据可视化库,可以跨多个设备和框架运行,
它在MIT许可证下运行(免费),并提供了一个付费包来提高性能和扩展功能。
1 开发者
是一位长得巨帅的大佬

2 简介
LiveCharts2 是一个简单、灵活、交互式以及功能强大的跨平台图表库。

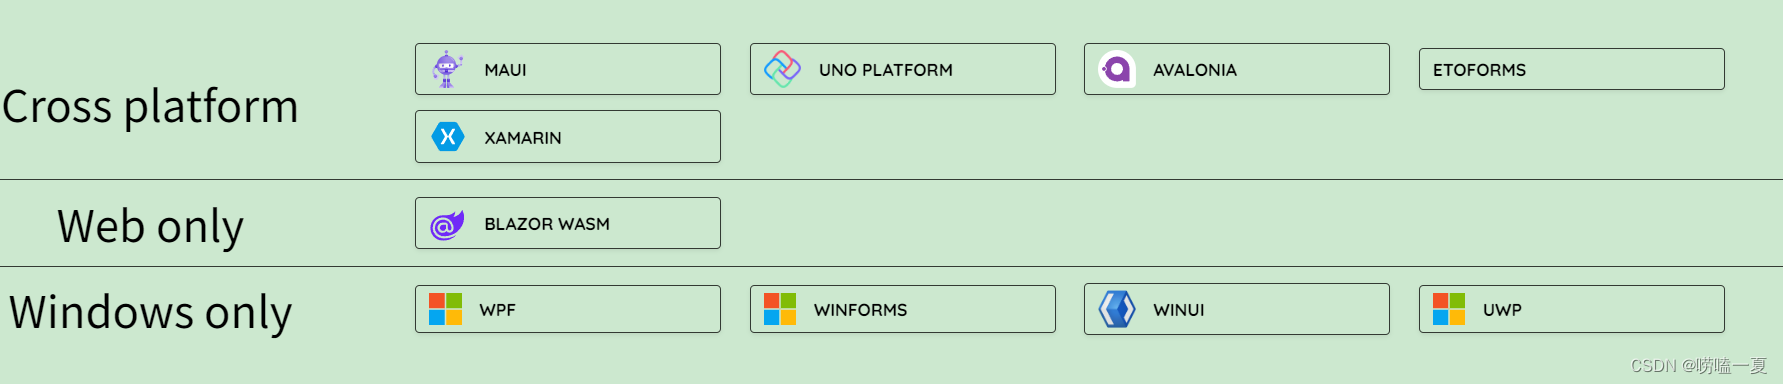
LiveCharts2 现在几乎可以运行在任何平台,支持Maui,Uno Platform、Avalonia、Etoforms、Xamarin、Blazor-wasm、WPF、Winforms、WinUI、UWP等。
LiveCharts2 是LiveCharts(0)的升级,它修复了前身的主要设计问题,专注于在任何地方运行,在不丢失V0中已有的特性情况下提高了灵活性。

2 LiveCharts2 可以做什么?
LiveCharts2 提供了折现图、饼图、柱状图、散点图、面积图等多种类型的图表。此外,它还支持多个图表联动显示,支持动态更新数据、自定义样式和动画效果等功能。


3 简单使用LiveCharts2 ,实现动态曲线图
由于工作中使用winform开发比较多,所以下面是在winform中使用LiveCharts的。下面实现的是一个自定义数据类型的动态曲线图。
3.1 LiveCharts包下载
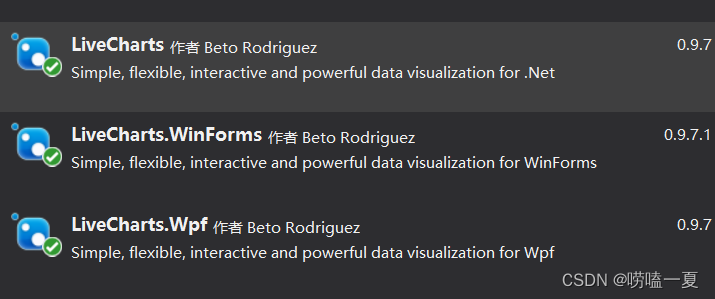
使用Nuget搜索LiveCharts,下载需要的包即可。我下载了这三个包。
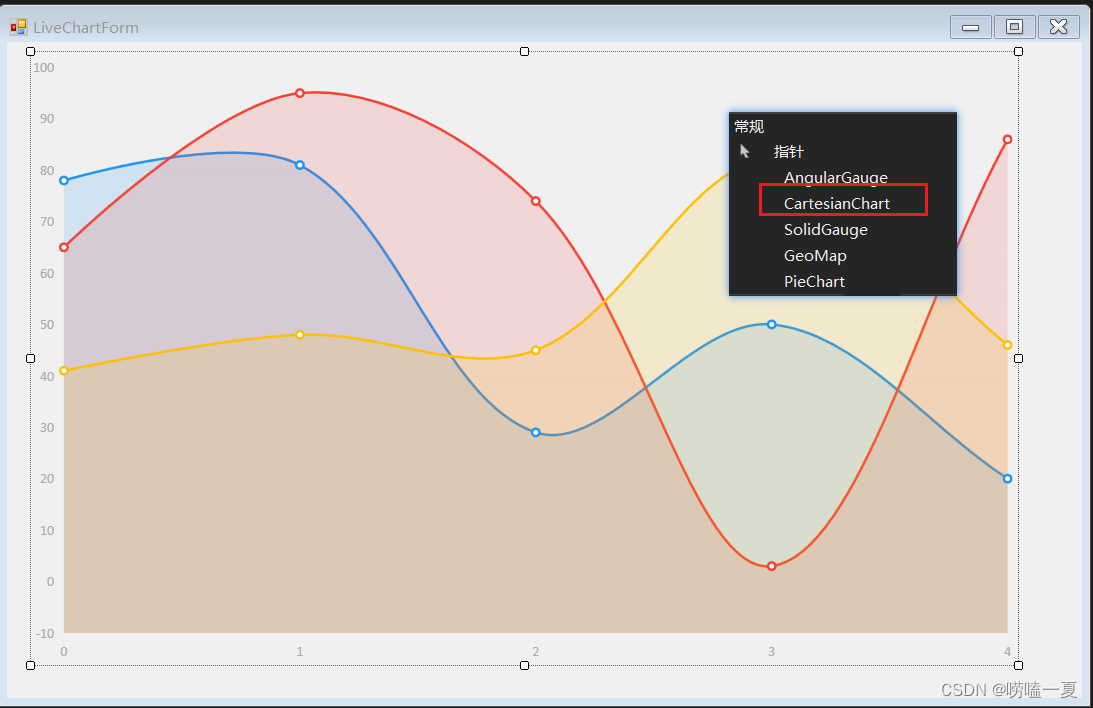
将LiveCharts包拖拽到控件箱,就可以像其它控件那样正常使用了。在这里我使用了CartesianChart 拖放到界面上,如下图所示:
3.2 后台代码
OscChart 是曲线控件的名称
using System;
using System.Collections.Generic;
using System.ComponentModel;
using System.Data;
using System.Drawing;
using System.Linq;
using System.Text;
using System.Windows.Forms;

using LiveCharts;
using LiveCharts.Configurations;
using LiveCharts.Wpf;

namespace View.PrjForm
{
    public partial class LiveChartForm : Form
    {

        private double _trend;

        //定时刷新曲线
        Timer timerChart;
        public LiveChartForm()
        {
            InitializeComponent();

            #region  多Y轴曲线

            //将自定义类型MeasureModel映射到曲线坐标点
            var mapper = Mappers.Xy<MeasureModel>()
              .X(model => model.Time)    //使用 Time.作为X轴的标签
              .Y(model => model.Value);  //使用Value 作为Y轴的值

            //全局保存映射器
            Charting.For<MeasureModel>(mapper);

            //添加三条曲线
            OscChart.Series.Add(new LineSeries
            {
                Values = new ChartValues<MeasureModel> {
                    new MeasureModel(1,1),
                    new MeasureModel(2,5),
                    new MeasureModel(3,3),
                    new MeasureModel(4,5),
                    new MeasureModel(5,3),
                },
                ScalesYAt = 0
            });

            OscChart.Series.Add(new LineSeries
            {
                Values = new ChartValues<MeasureModel> {
                    new MeasureModel(1,20),
                    new MeasureModel(2,30),
                    new MeasureModel(3,70),
                    new MeasureModel(4,20),
                    new MeasureModel(5,10),
                },

                ScalesYAt = 1
            });
            OscChart.Series.Add(new LineSeries
            {
                Values = new ChartValues<MeasureModel> {
                    new MeasureModel(1,600),
                    new MeasureModel(2,300),
                    new MeasureModel(3,200),
                    new MeasureModel(4,600),
                    new MeasureModel(5,800),
                },
                ScalesYAt = 2
            });

            //添加3条Y坐标轴
            OscChart.AxisY.Add(new Axis
            {
                Foreground = System.Windows.Media.Brushes.DodgerBlue,
                Title = "Blue Axis"
            });

            OscChart.AxisY.Add(new Axis
            {
                Foreground = System.Windows.Media.Brushes.IndianRed,
                Title = "Red Axis",
                Position = AxisPosition.RightTop
            });

            OscChart.AxisY.Add(new Axis
            {
                Foreground = System.Windows.Media.Brushes.DarkOliveGreen,
                Title = "Green Axis",
                Position = AxisPosition.RightTop
            });

            OscChart.AxisX.Add(new Axis
            {
                DisableAnimations = true,
                LabelFormatter = value => value.ToString(),
                Separator = new Separator
                {
                    Step = 1
                }
            }) ;

            #endregion


            //定时器刷新
            timerChart = new Timer()
            {
                Interval = 200,

            };
            timerChart.Tick += TimerChart_Tick;
            timerChart.Start();
        }

        int time = 5;
        private void TimerChart_Tick(object sender, EventArgs e)
        {
            LineStart();
        }

        /// <summary>
        /// 连续折现图的方法
        /// </summary>
        private void LineStart()
        {
            time++;

            var r = new Random();
            _trend = r.Next(-10, 10);


            //更新纵坐标数据
            OscChart.Series[0].Values.Add(new MeasureModel(time, _trend));

            _trend = r.Next(10, 100);
            OscChart.Series[1].Values.Add(new MeasureModel(time, _trend));

            _trend = r.Next(100, 1000);
            OscChart.Series[2].Values.Add(new MeasureModel(time, _trend));

           if(time > 20)
            {//只关心前面20个数据

                OscChart.AxisX[0].MaxValue = time;
                OscChart.AxisX[0].MinValue = time - 20;
            }

        }

    }

    /// <summary>
    /// 自定义类型
    /// </summary>
    public class MeasureModel
    {

      public   MeasureModel(double time, double val)
        {
            Time = time;
            Value = val;
        }
        public double Time { get; set; }

        public double Value { get; set; }
    }
}
3.3 效果图
在运行的时候发现LiveCharts在数据量大的时候,会卡顿,没有那么流畅。

3.4 过程中遇到的问题
具体问题信息如下:
LiveCharts.Helpers.LiveChartsException
  HResult=0x80131500
  Message=LiveCharts does not know how to plot MeasureModel, you can either, use an already configured type or configure this type you are trying to use, For more info see http://lvcharts.net/App/examples/v1/wpf/Types%20and%20Configuration
  Source=LiveCharts
LiveCharts 不知道如何绘制MeasureModel(自定义的数据类型)。
解决方法:使用Mappers映射绑定
           //将自定义类型MeasureModel映射到曲线坐标点
            var mapper = Mappers.Xy<MeasureModel>()
              .X(model => model.Time)    //使用 Time.作为X轴的标签
              .Y(model => model.Value);  //使用Value 作为Y轴的值

            //全局保存映射器
            Charting.For<MeasureModel>(mapper);


 1060
1060

 被折叠的 条评论
为什么被折叠?
被折叠的 条评论
为什么被折叠?
 到【灌水乐园】发言


