


Echarts绘制带箭头的线
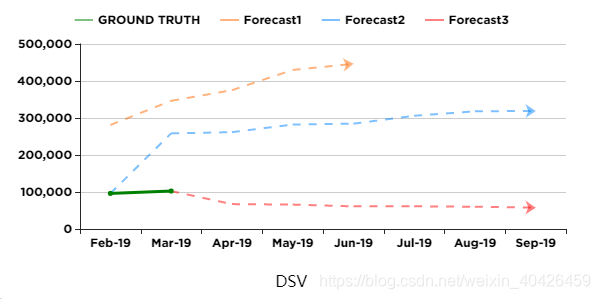
这个图主要参考echarts官网的关系图绘制的,难点在于去掉其余导向图的箭头,只保留最后一个节点的箭头,以及处理值为null时箭头的指向问题,代码如下:
<template>
    <div class="invoicechart">
      <div class="invoicechart_box" :id="elId"> </div>
    </div>
<!-- :id="echartId"  -->
</template>
<script>
  import uuidv1 from 'uuid/v1'
  export default {
  name: 'r-echarts-line-mul',
  data () {
    return {
            elId: 'echartid11',
            // myChart实例数组
            myChart:null,
            legendShow:false,
        }
    },
    props: {
        data: {//具体数据
            type: Object,
            default(){
              return{

              }
            }

        }
    },
    created(){
      this.elId = uuidv1() //获取随机id
    },
    mounted () {
        this.setEchart();

    },
    watch:{
        data: {//监听数值是否有变化
            handler(newValue, oldValue) {
              if (!this.myChart) {
                this.setEchart();
              }else{
                this.chartChange();
              }

            },
            deep: true//深度
        }
    },
    computed: {
        origin() {
            return this.data;
        },
        option() {
            let that = this;
            // console.log('color',this.data.color)
            let obj = {
                title: {
                    text: that.origin.title?that.origin.title:''
                },
                color:['#6fac45','#f5bb94','#a2c6e7','#aeaeae'],
                tooltip: { },
                legend: { },
                xAxis: {
                    type: 'category',
                    // boundaryGap: true,
                    axisLine:{
                        lineStyle:{
                            color:'#292727'
                        }
                    },
                    axisLabel:{
                        textStyle:{
                            color:'#000000',
                            fontFamily:'Gotham-Bold'
                        }
                    },
                    data: that.origin.xAxisData?that.origin.xAxisData:[],
                },
                yAxis: {
                    type: 'value',
                    show: true,
                    min:that.origin.min?that.origin.min:0,
                    axisLine:{
                        lineStyle:{
                            color:'#292727'
                        }
                    },
                    axisLabel: {
                        show: true,
                        position: 'inside',
                        interval: 'auto',
                        textStyle:{
                            color:'#000000',
                            fontFamily:'Gotham-Bold'
                        },
                        // formatter: '{value}%'
                    }

                },
                series: this.dealSeries
            }
            return obj;
        },
        dealSeries(){
            let data=[];
            let objdata={};
            let links={};
            let color=this.data.color?this.data.color:['#6fac45','#ff6800','#0083ff','#ff0202'];
            if(this.data.seriesData){
                this.data.seriesData.forEach((element,index) => {
                  // console.log('1',element.data)
                  //过滤null,将所有值为null的转为字符串‘null’
                  element.data = element.data.map((item,index) => {
                    return item==null?'null':item;
                  })
                  // console.log('2',element.data)
                  //倒序遍历数组,查找值为null的值,并将其删除,知道值为数字则跳出循环
                  for(var i = element.data.length-1;i!=-1;i--){
                    if(element.data[i] == 'null'){
                      //符合条件,移除
                      element.data.pop();
                    }else{
                      break;
                    }
                  }
                  // console.log('3',element.data)
                  //箭头指向,值为null时指向置为空,将线的宽度置为0,隐藏线
                  links = element.data.map(function (item, i) {
                      if(item=='null'){
                        return {
                          source:'',
                          target: '',
                          lineStyle: {
                            normal: {
                              width: 0,
                              curveness: 0.2
                            }
                          }
                        }
                      }else{
                        return {
                          source: i,
                          target: i + 1
                        }
                      }
                    });
                    links.pop();
                    let list = links.pop();
                    list.symbolSize=[0,10]
                    links.push(list);
                    //绘制实线
                    if(element.name=='true_value'){
                      objdata={
                        type: 'line',
                        data: element.data,
                        symbol: 'circle',     //设定为实心点
                        symbolSize: 5,   //设定实心点的大小
                        color:'green',
                        lineStyle: {
                          normal: {
                            type:'solid',
                            color:'green',
                            width:3
                          }
                        }
                      }
                    }else{
                     //绘制虚线
                      objdata={
                        type: 'graph',
                        layout: 'none',
                        coordinateSystem: 'cartesian2d',
                        symbolSize: 0,
                        edgeSymbol: ['circle', 'arrow'],
                        edgeSymbolSize: [0, 0],
                        data:element.data,
                        links:links,
                        color:color[index],
                        lineStyle: {
                          normal: {
                            type:'dashed',
                            color:color[index],
                            width:2,
                          }
                        }
                      };
                    }
                    // console.log(objdata)
                    if(element&&Object.prototype.toString.call(element)=="[object Object]"){
                        for(let key in element){
                            if(!objdata[key]){
                                objdata[key]=element[key];
                            }
                        }
                    }
                    data.push(objdata);
                });
            }
            return data;
        }
    },
    methods: {
        setEchart () {
            let _this=this;
            this.myChart = this.$echarts.init(document.getElementById(_this.elId));
            this.myChart.setOption(this.option);
            this.myChart.group = _this.data.name;
            this.$echarts.connect(_this.data.name);
            window.addEventListener('resize',function(){//图表自适应
                _this.myChart.resize();
            });
        },
        chartChange () {
            this.myChart.setOption(this.option);
        },

    },
    beforeDestroy(){
        this.myChart.clear();
    }
}
</script>


 251
251


 被折叠的 条评论
为什么被折叠?
被折叠的 条评论
为什么被折叠?
 到【灌水乐园】发言


