


实现效果:👇
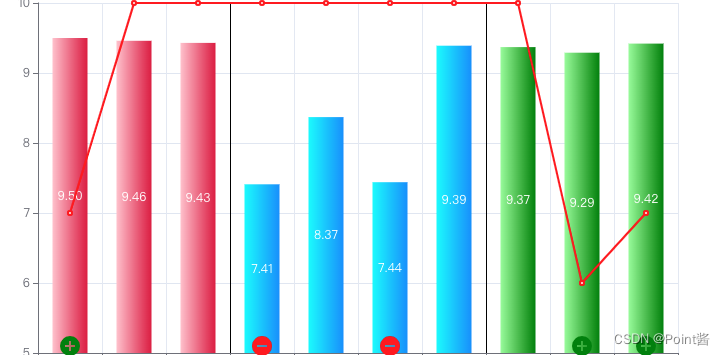
第一种办法:
itemStyle: {
              normal: {
                  //柱体的颜色
                  //右,下,左,上(1,0,0,0)表示从正右开始向左渐变
                  color: function (params) {
                      console.log(params);
                      var colorList = [
                          ['#00FCFF', '#008297'],
                          ['#0091FF', '#005EA4'],
                          ['#901698', '#F157EE'],
                          ['#40FBCB', '#009871']
                      ];

                      var colorItem = colorList[params.dataIndex];
                      return new echarts.graphic.LinearGradient(0, 0, 0, 1, [{
                              offset: 0,
                              color: colorItem[0]
                          },
                          {
                              offset: 1,
                              color: colorItem[1]
                          }
                      ], false);
                  }
              }
          },
但是。。。迷幻的是 echarts 和 graphic 一直报错,这个方法就是用不了 时间有限 于是换了种写法
            itemStyle: {
              normal: {
                color: function (params) {
                  let colorArray = [
                    {
                      top: "#DC143C",
                      bottom: "#FFC0CB",
                    },
                    {
                      top: "#DC143C",
                      bottom: "#FFC0CB",
                    },
                    {
                      top: "#DC143C",
                      bottom: "#FFC0CB",
                    },
                    {
                      top: "#0091FF",
                      bottom: "#00FCFF",
                    },
                    {
                      top: "#0091FF",
                      bottom: "#00FCFF",
                    },
                    {
                      top: "#0091FF",
                      bottom: "#00FCFF",
                    },
                    {
                      top: "#0091FF",
                      bottom: "#00FCFF",
                    },

                    {
                      top: "#008000",
                      bottom: "#98FB98",
                    },
                    {
                      top: "#008000",
                      bottom: "#98FB98",
                    },
                    {
                      top: "#008000",
                      bottom: "#98FB98",
                    },
                  ];
                  let num = colorArray.length;
                  return {
                    type: "linear",
                    colorStops: [
                      {
                        offset: 0,
                        color: colorArray[params.dataIndex % num].bottom,
                      },
                      {
                        offset: 1,
                        color: colorArray[params.dataIndex % num].top,
                      },
                    ],
                  };
                },

                label: {
                  show: true,
                  position: "inside",
                  textStyle: {
                    color: "white",
                  },
                },
              },
            },


 1万+
1万+


 被折叠的 条评论
为什么被折叠?
被折叠的 条评论
为什么被折叠?
 到【灌水乐园】发言


