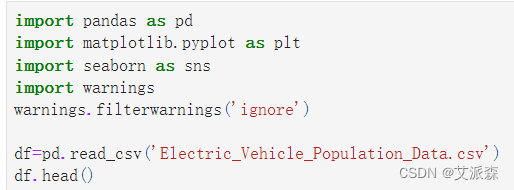
import pandas as pd
import matplotlib.pyplot as plt
import seaborn as sns
import warnings
warnings.filterwarnings('ignore')
df=pd.read_csv('Electric_Vehicle_Population_Data.csv')
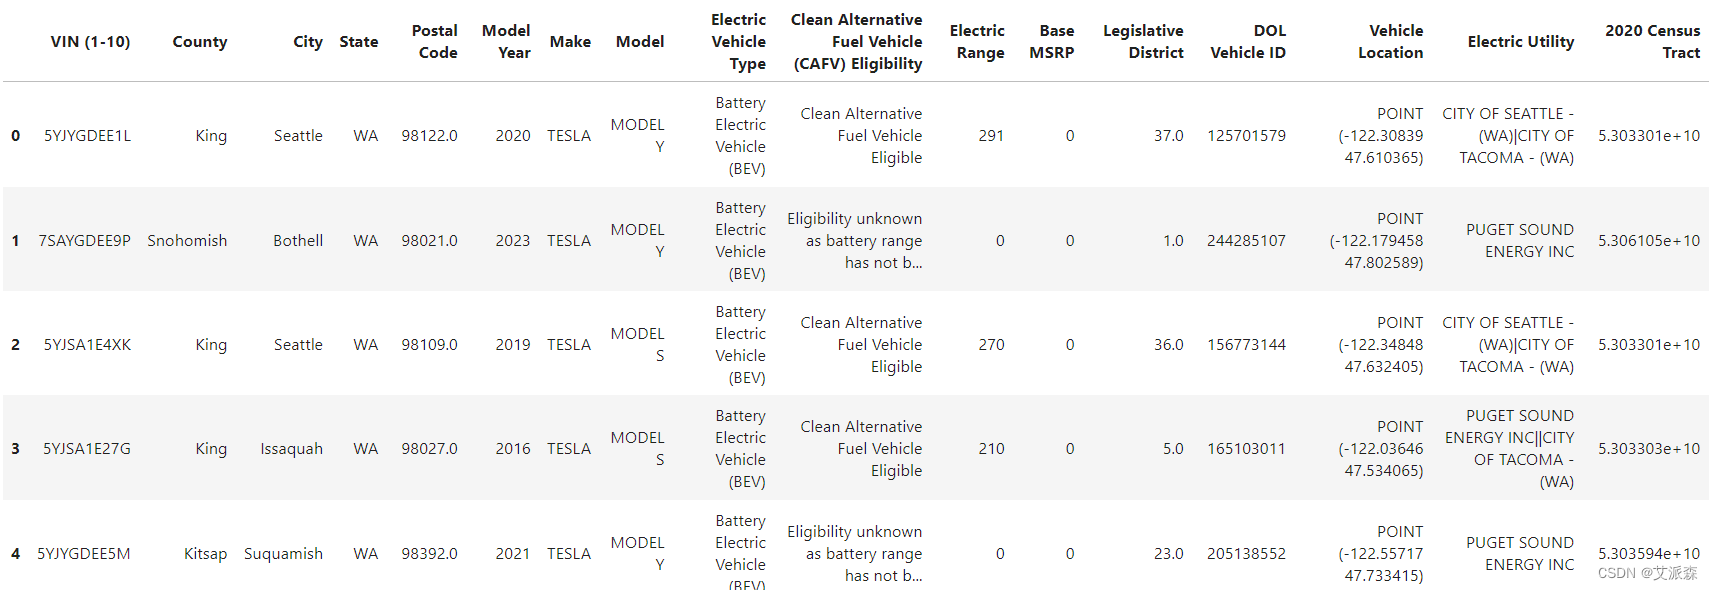
df.head()
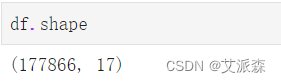
df.shape
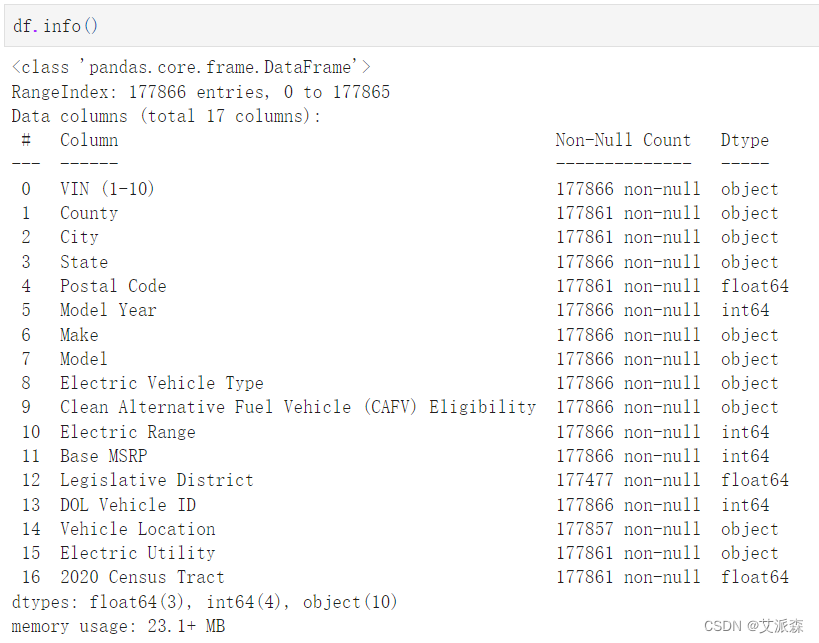
df.info()
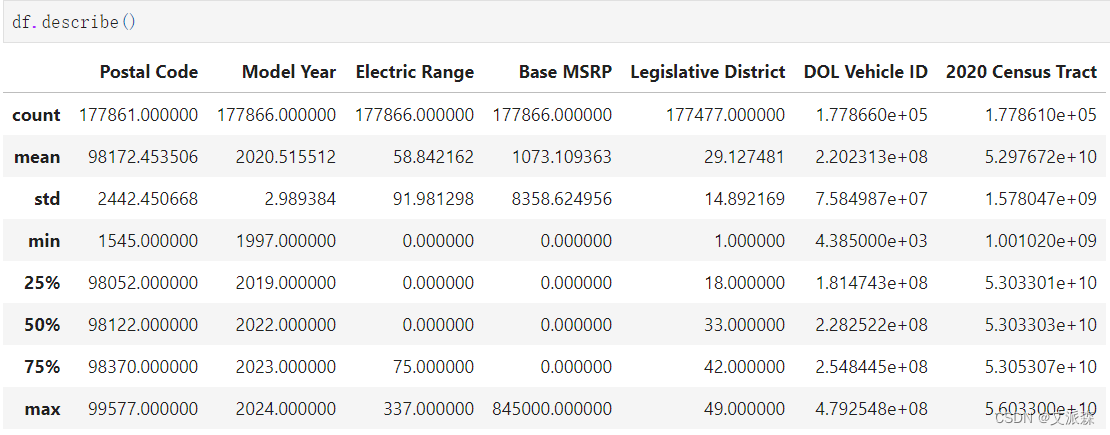
df.describe()
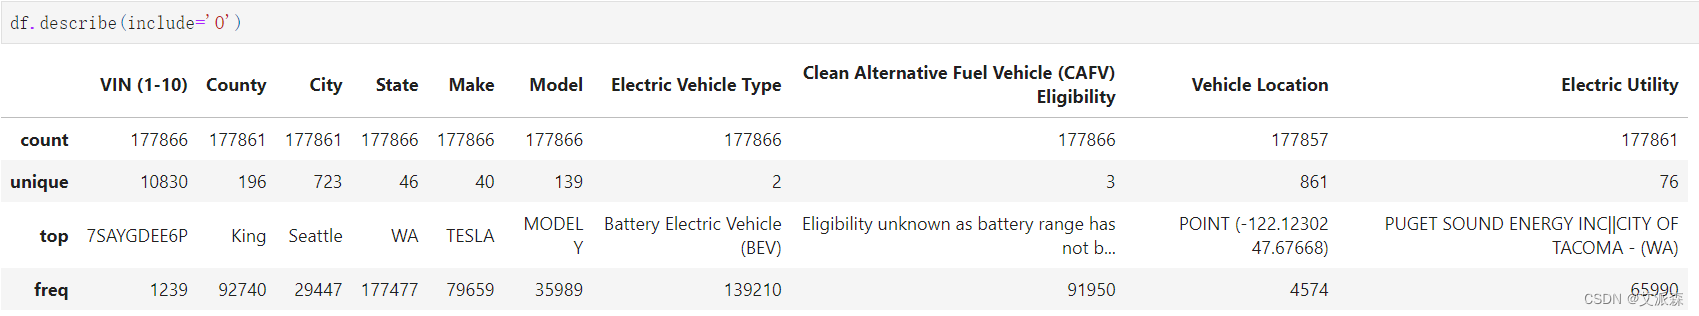
df.describe(include='O')
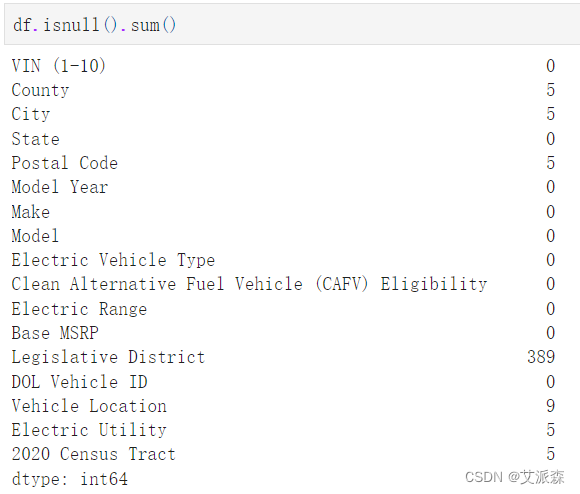
df.isnull().sum()
df.duplicated().sum()
df.dropna(inplace=True)
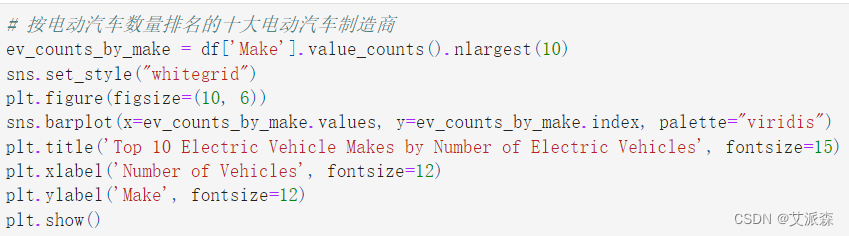
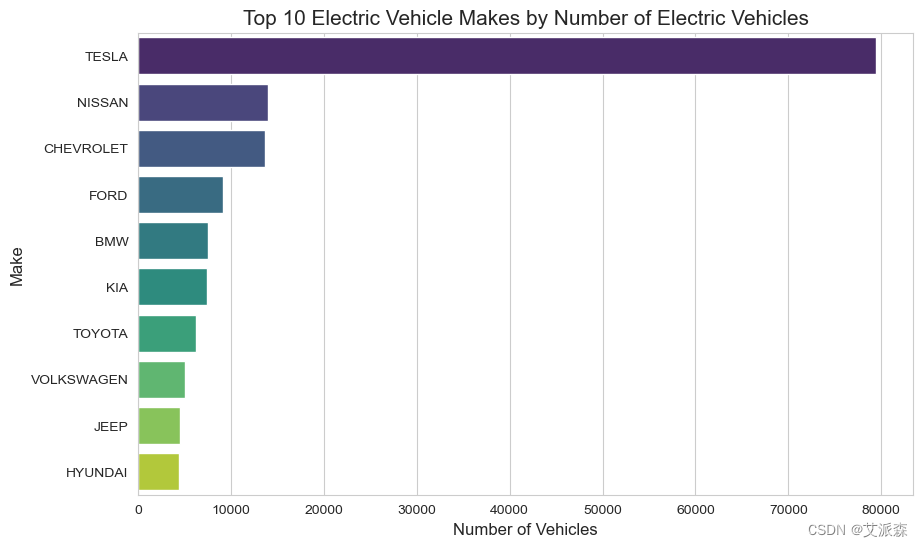
可视化1:按电动汽车数量排名的十大电动汽车制造商。
# 按电动汽车数量排名的十大电动汽车制造商
ev_counts_by_make = df['Make'].value_counts().nlargest(10)
sns.set_style("whitegrid")
plt.figure(figsize=(10, 6))
sns.barplot(x=ev_counts_by_make.values, y=ev_counts_by_make.index, palette="viridis")
plt.title('Top 10 Electric Vehicle Makes by Number of Electric Vehicles', fontsize=15)
plt.xlabel('Number of Vehicles', fontsize=12)
plt.ylabel('Make', fontsize=12)
plt.show()
可视化显示,特斯拉是电动汽车市场的领头羊,其次是日产,雪佛兰表明特斯拉是最受欢迎的品牌。
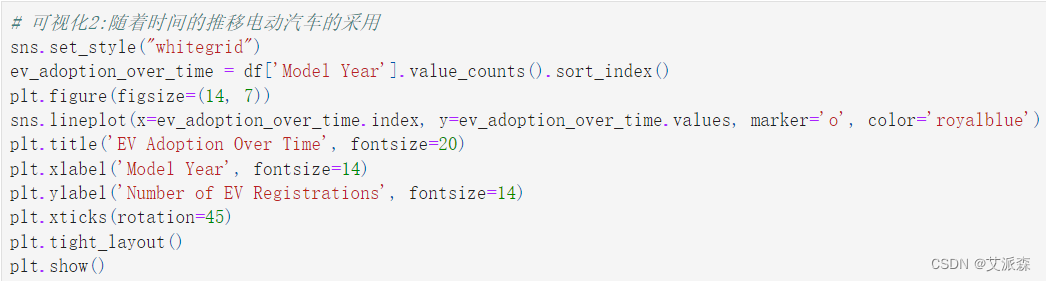
# 可视化2:随着时间的推移电动汽车的采用
sns.set_style("whitegrid")
ev_adoption_over_time = df['Model Year'].value_counts().sort_index()
plt.figure(figsize=(14, 7))
sns.lineplot(x=ev_adoption_over_time.index, y=ev_adoption_over_time.values, marker='o', color='royalblue')
plt.title('EV Adoption Over Time', fontsize=20)
plt.xlabel('Model Year', fontsize=14)
plt.ylabel('Number of EV Registrations', fontsize=14)
plt.xticks(rotation=45)
plt.tight_layout()
plt.show()
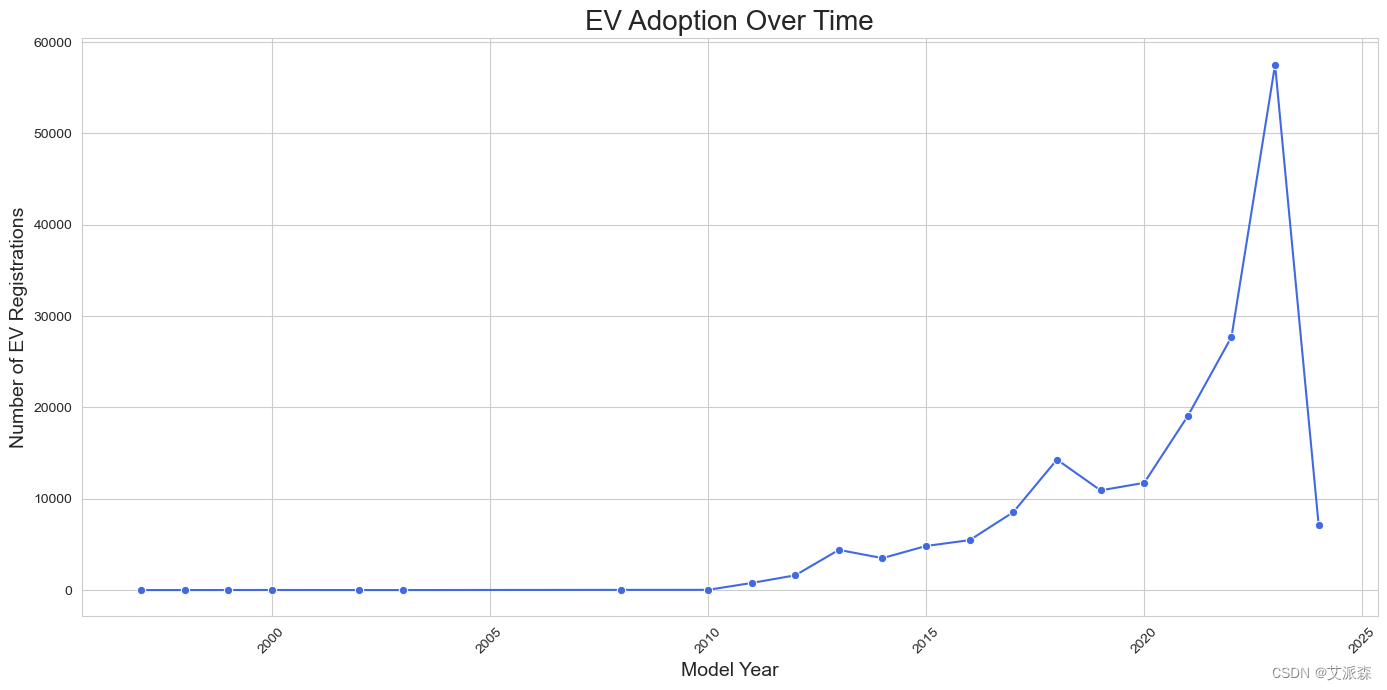
“随着时间的推移,电动汽车的采用”可视化显示了电动汽车注册量的显著增长,从2010年代初开始增长,并在2020年代进一步加速增长。近年来,电动汽车的采用呈指数级增长,这意味着它正变得越来越受欢迎。
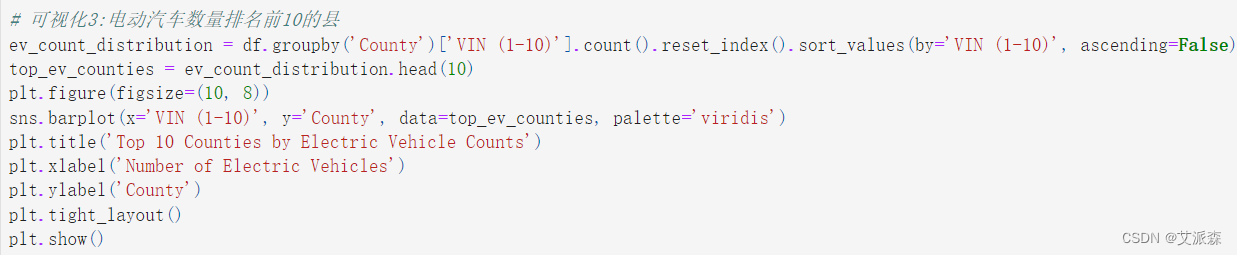
# 可视化3:电动汽车数量排名前10的县
ev_count_distribution = df.groupby('County')['VIN (1-10)'].count().reset_index().sort_values(by='VIN (1-10)', ascending=False)
top_ev_counties = ev_count_distribution.head(10)
plt.figure(figsize=(10, 8))
sns.barplot(x='VIN (1-10)', y='County', data=top_ev_counties, palette='viridis')
plt.title('Top 10 Counties by Electric Vehicle Counts')
plt.xlabel('Number of Electric Vehicles')
plt.ylabel('County')
plt.tight_layout()
plt.show()
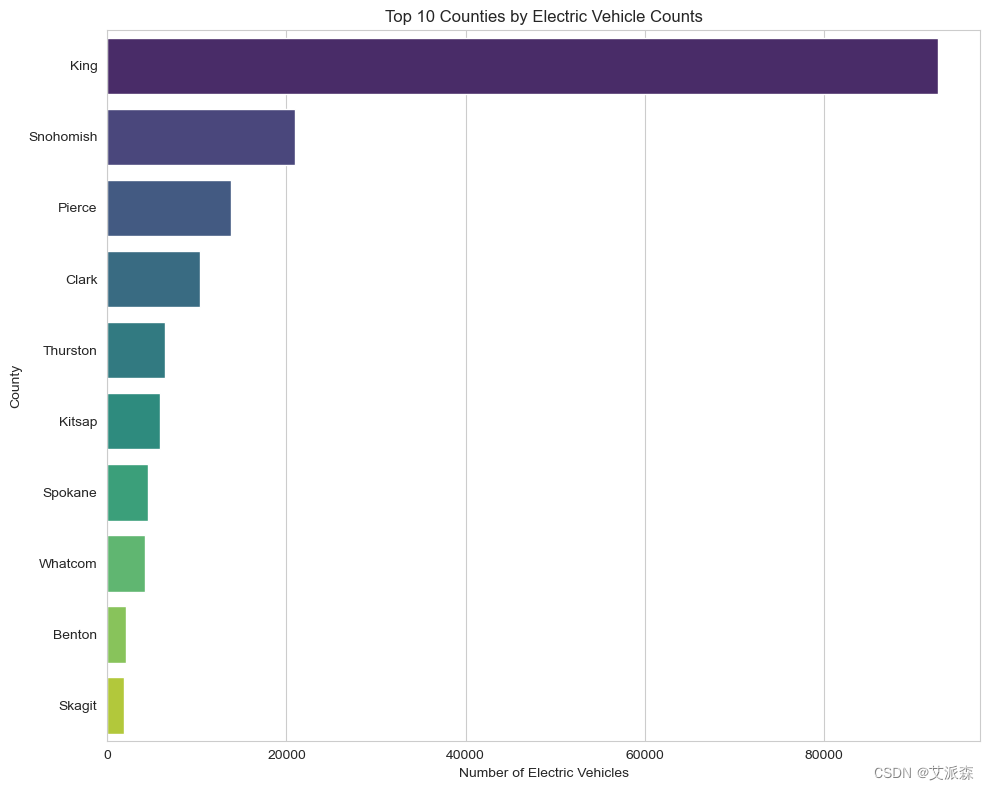
可视化显示,金县是电动汽车采用的领先地区,其次是斯诺霍米什县和皮尔斯县。
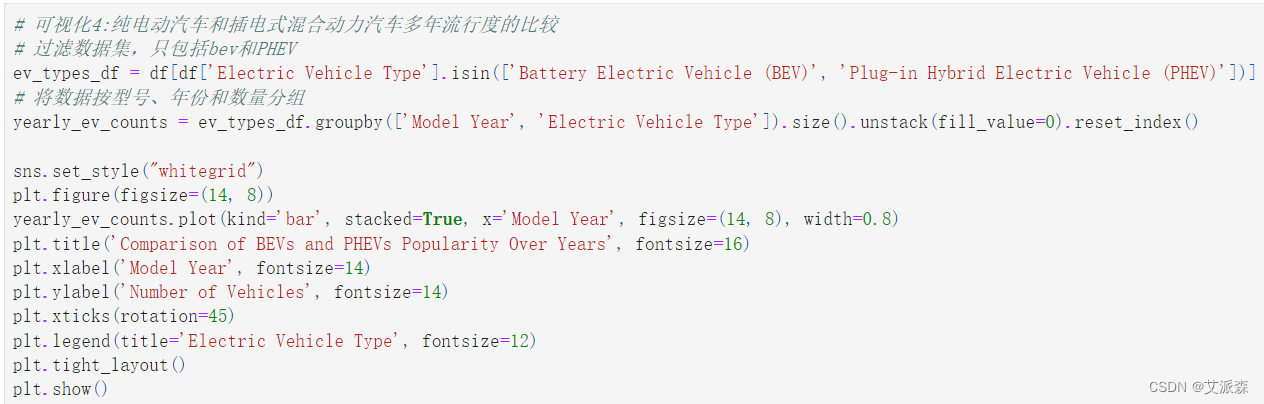
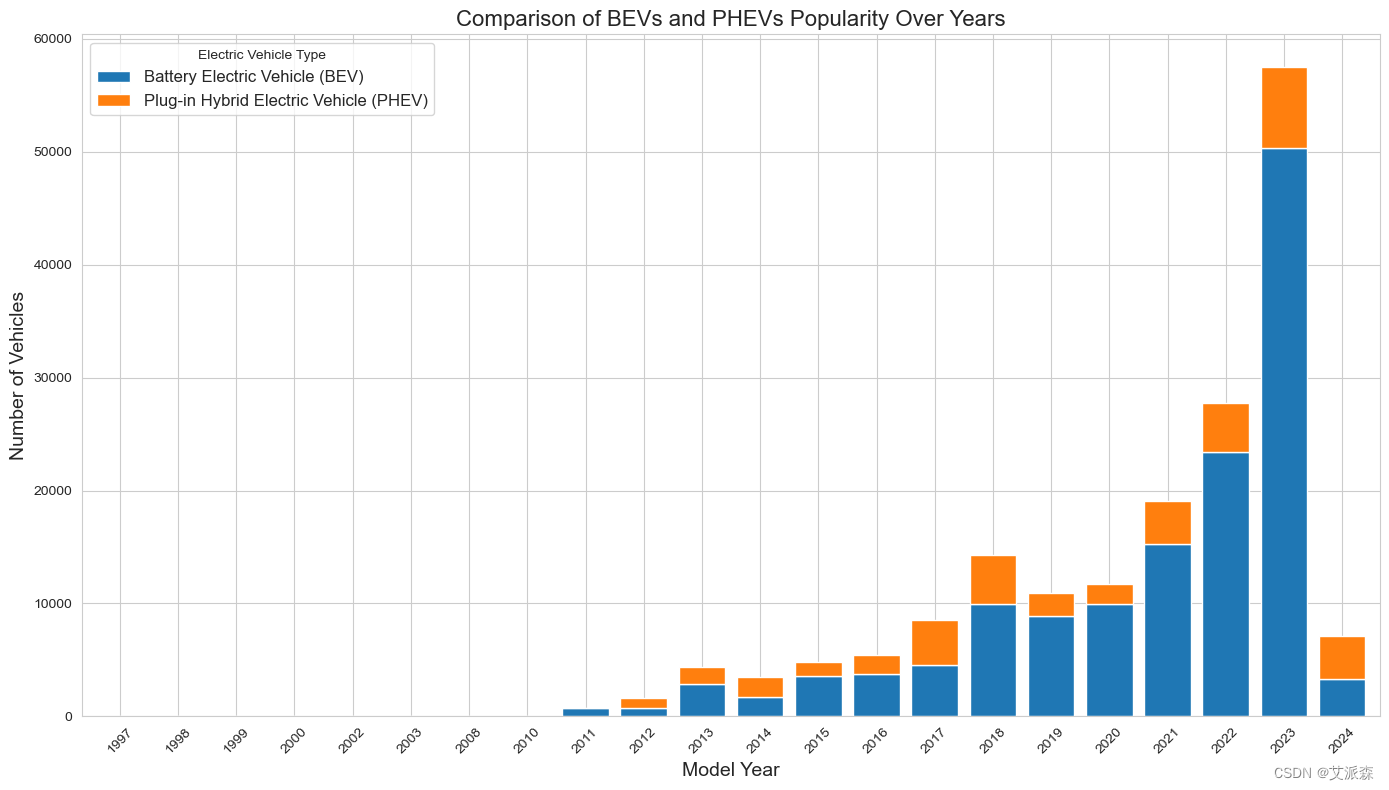
# 可视化4:纯电动汽车和插电式混合动力汽车多年流行度的比较
# 过滤数据集,只包括bev和PHEV
ev_types_df = df[df['Electric Vehicle Type'].isin(['Battery Electric Vehicle (BEV)', 'Plug-in Hybrid Electric Vehicle (PHEV)'])]
# 将数据按型号、年份和数量分组
yearly_ev_counts = ev_types_df.groupby(['Model Year', 'Electric Vehicle Type']).size().unstack(fill_value=0).reset_index()
sns.set_style("whitegrid")
plt.figure(figsize=(14, 8))
yearly_ev_counts.plot(kind='bar', stacked=True, x='Model Year', figsize=(14, 8), width=0.8)
plt.title('Comparison of BEVs and PHEVs Popularity Over Years', fontsize=16)
plt.xlabel('Model Year', fontsize=14)
plt.ylabel('Number of Vehicles', fontsize=14)
plt.xticks(rotation=45)
plt.legend(title='Electric Vehicle Type', fontsize=12)
plt.tight_layout()
plt.show()
多年来,纯电动汽车(bev)和插电式混合动力汽车(phev)之间的比较凸显了一个明显的趋势,即纯电动汽车越来越受欢迎,尤其是在2023年。
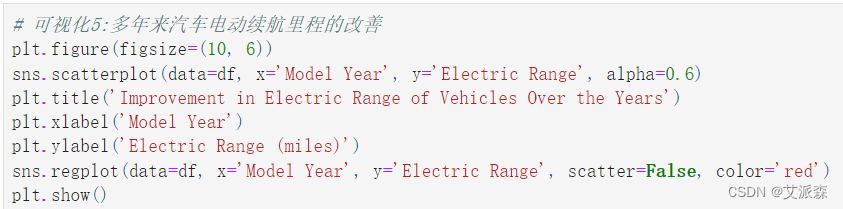
# 可视化5:多年来汽车电动续航里程的改善
plt.figure(figsize=(10, 6))
sns.scatterplot(data=df, x='Model Year', y='Electric Range', alpha=0.6)
plt.title('Improvement in Electric Range of Vehicles Over the Years')
plt.xlabel('Model Year')
plt.ylabel('Electric Range (miles)')
sns.regplot(data=df, x='Model Year', y='Electric Range', scatter=False, color='red')
plt.show()
随回归线的散点图显示了历年电动里程的显著改善,电动里程有明显的上升趋势。
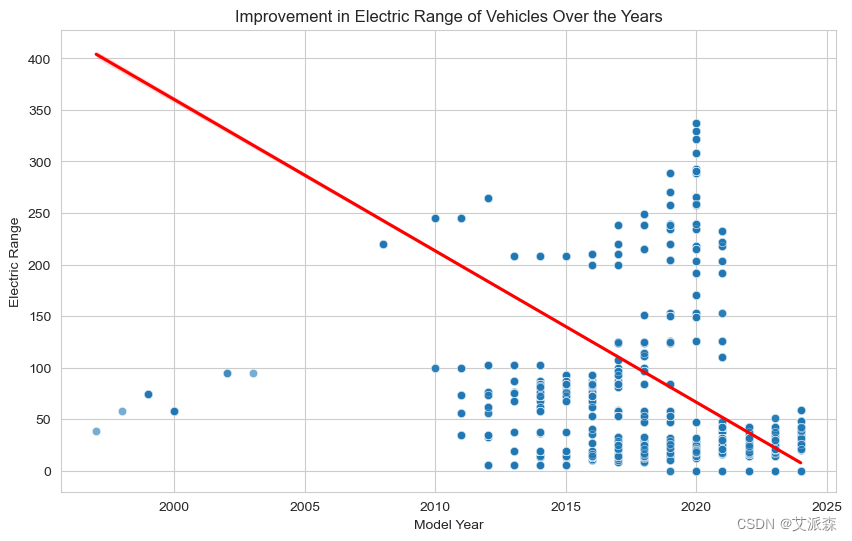
# 可视化6:电动汽车价格历年分布
#过滤掉基本MSRP为零或高的行
filtered_df = df[(df['Base MSRP'] > 0) & (df['Base MSRP'] < 200000)]
sns.set_style("whitegrid")
plt.figure(figsize=(14, 8))
sns.boxplot(data=filtered_df, x='Model Year', y='Base MSRP', palette="viridis")
plt.title('Distribution of Electric Vehicle Prices Over the Years', fontsize=16)
plt.xlabel('Model Year', fontsize=14)
plt.ylabel('Base MSRP ($)', fontsize=14)
plt.xticks(rotation=45)
plt.tight_layout()
plt.show()
可视化显示了近年来电动汽车中位数价格的增长。2008年到2011年的价格与现在相比非常高。
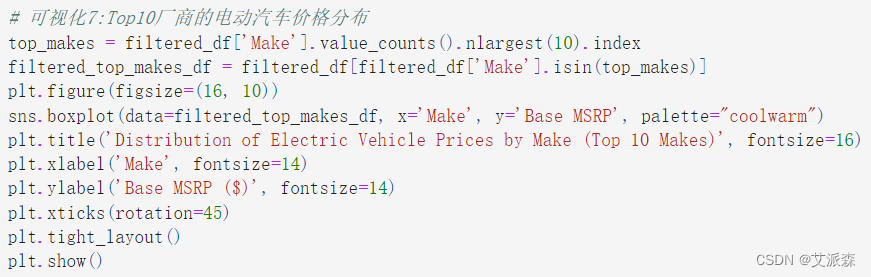
# 可视化7:Top10厂商的电动汽车价格分布
top_makes = filtered_df['Make'].value_counts().nlargest(10).index
filtered_top_makes_df = filtered_df[filtered_df['Make'].isin(top_makes)]
plt.figure(figsize=(16, 10))
sns.boxplot(data=filtered_top_makes_df, x='Make', y='Base MSRP', palette="coolwarm")
plt.title('Distribution of Electric Vehicle Prices by Make (Top 10 Makes)', fontsize=16)
plt.xlabel('Make', fontsize=14)
plt.ylabel('Base MSRP ($)', fontsize=14)
plt.xticks(rotation=45)
plt.tight_layout()
plt.show()
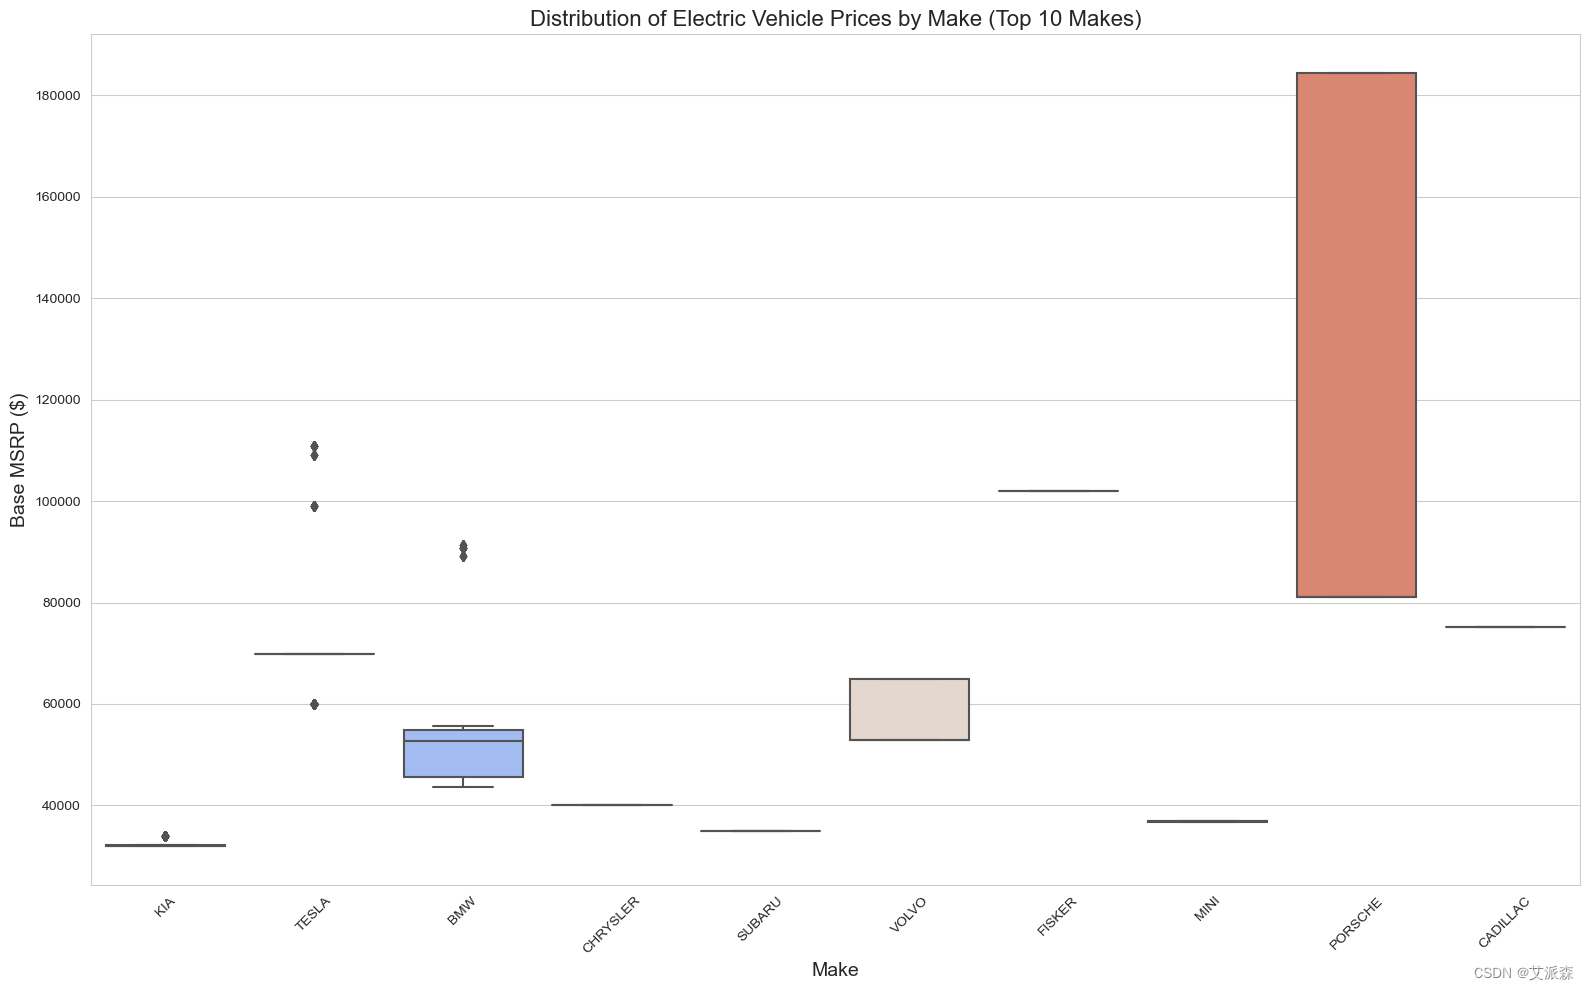
箱线图显示了前10名电动汽车制造商的基本建议零售价的显着变化,保时捷非常受欢迎,价格范围在80000到180000之间。菲斯克的价格第二高。
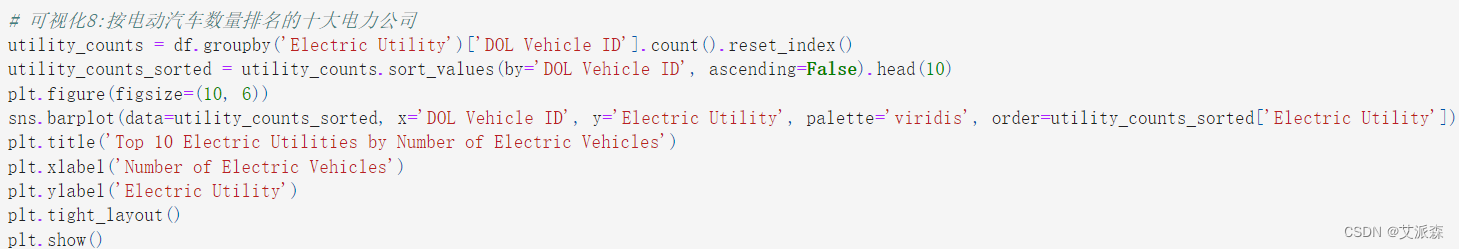
# 可视化8:按电动汽车数量排名的十大电力公司
utility_counts = df.groupby('Electric Utility')['DOL Vehicle ID'].count().reset_index()
utility_counts_sorted = utility_counts.sort_values(by='DOL Vehicle ID', ascending=False).head(10)
plt.figure(figsize=(10, 6))
sns.barplot(data=utility_counts_sorted, x='DOL Vehicle ID', y='Electric Utility', palette='viridis', order=utility_counts_sorted['Electric Utility'])
plt.title('Top 10 Electric Utilities by Number of Electric Vehicles')
plt.xlabel('Number of Electric Vehicles')
plt.ylabel('Electric Utility')
plt.tight_layout()
plt.show()
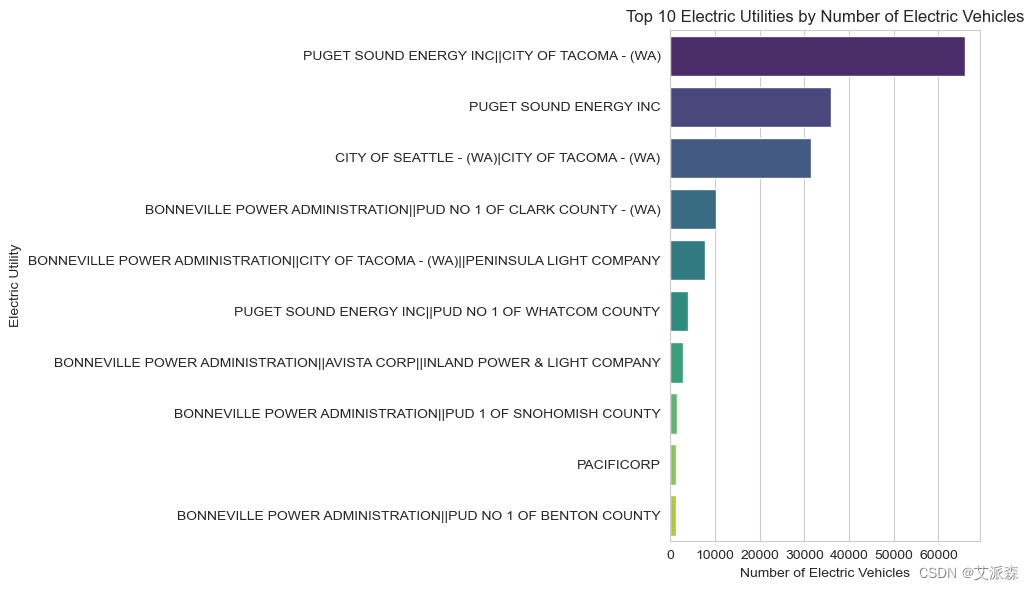
柱状图按车辆数量显示了电力公用事业。普吉特海湾能源公司拥有最多的电动汽车。
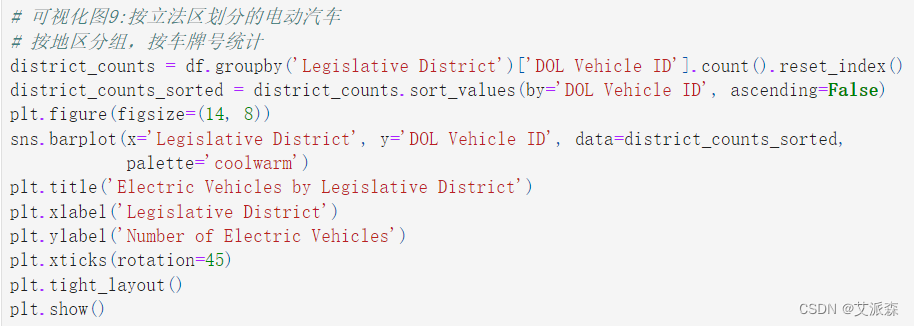
# 可视化图9:按立法区划分的电动汽车
# 按地区分组,按车牌号统计
district_counts = df.groupby('Legislative District')['DOL Vehicle ID'].count().reset_index()
district_counts_sorted = district_counts.sort_values(by='DOL Vehicle ID', ascending=False)
plt.figure(figsize=(14, 8))
sns.barplot(x='Legislative District', y='DOL Vehicle ID', data=district_counts_sorted,
palette='coolwarm')
plt.title('Electric Vehicles by Legislative District')
plt.xlabel('Legislative District')
plt.ylabel('Number of Electric Vehicles')
plt.xticks(rotation=45)
plt.tight_layout()
plt.show()
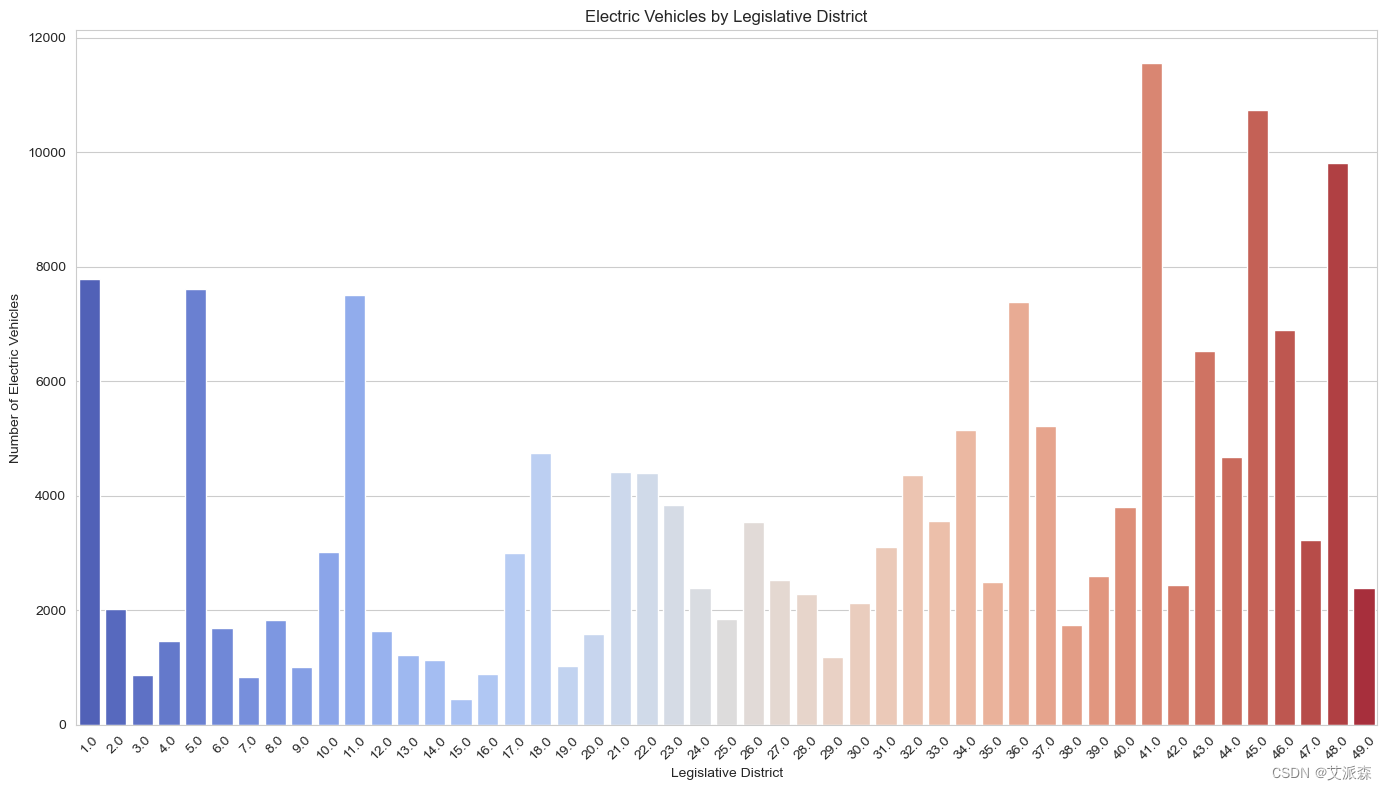
可视化显示了各立法区在电动汽车(EV)采用方面的差异,41区、45区和48区遥遥领先。
- 1.
- 2.
- 3.
- 4.
- 5.
- 6.
- 7.
- 8.
- 9.
- 10.
- 11.
- 12.
- 13.
- 14.
- 15.
- 16.
- 17.
- 18.
- 19.
- 20.
- 21.
- 22.
- 23.
- 24.
- 25.
- 26.
- 27.
- 28.
- 29.
- 30.
- 31.
- 32.
- 33.
- 34.
- 35.
- 36.
- 37.
- 38.
- 39.
- 40.
- 41.
- 42.
- 43.
- 44.
- 45.
- 46.
- 47.
- 48.
- 49.
- 50.
- 51.
- 52.
- 53.
- 54.
- 55.
- 56.
- 57.
- 58.
- 59.
- 60.
- 61.
- 62.
- 63.
- 64.
- 65.
- 66.
- 67.
- 68.
- 69.
- 70.
- 71.
- 72.
- 73.
- 74.
- 75.
- 76.
- 77.
- 78.
- 79.
- 80.
- 81.
- 82.
- 83.
- 84.
- 85.
- 86.
- 87.
- 88.
- 89.
- 90.
- 91.
- 92.
- 93.
- 94.
- 95.
- 96.
- 97.
- 98.
- 99.
- 100.
- 101.
- 102.
- 103.
- 104.
- 105.
- 106.
- 107.
- 108.
- 109.
- 110.
- 111.
- 112.
- 113.
- 114.
- 115.
- 116.
- 117.
- 118.
- 119.
- 120.
- 121.
- 122.
- 123.
- 124.
- 125.


 793
793

 被折叠的 条评论
为什么被折叠?
被折叠的 条评论
为什么被折叠?
 到【灌水乐园】发言


