


ECharts在工业级软件APROL中的应用
文章目录
前言
ECharts在APROL中的应用,ECharts获取aprol中iosyshttp接口的数据提示:以下是本篇文章正文内容,下面案例可供参考
一、Echarts介绍
ECharts,一个使用 JavaScript 实现的开源可视化库,可以流畅的运行在 PC 和移动设备上,兼容当前绝大部分浏览器(IE8/9/10/11,Chrome,Firefox,Safari等),底层依赖矢量图形库 ZRender,提供直观,交互丰富,可高度个性化定制的数据可视化图表。
二、需要的材料
ECharts官方网站https://echarts.apache.org/zh/index.html
python flask 模块
工业级软件APROL(贝加莱)
三、使用步骤
1.下载echarts.min.js
提供两种方法:
1:GitHub https://github.com/apache/incubator-echarts/tree/5.0.0
2:菜鸟教程 https://www.runoob.com/echarts/echarts-tutorial.html

https://cdn.staticfile.org/echarts/4.3.0/echarts.min.js
打开网址右击另存为echarts.min.js
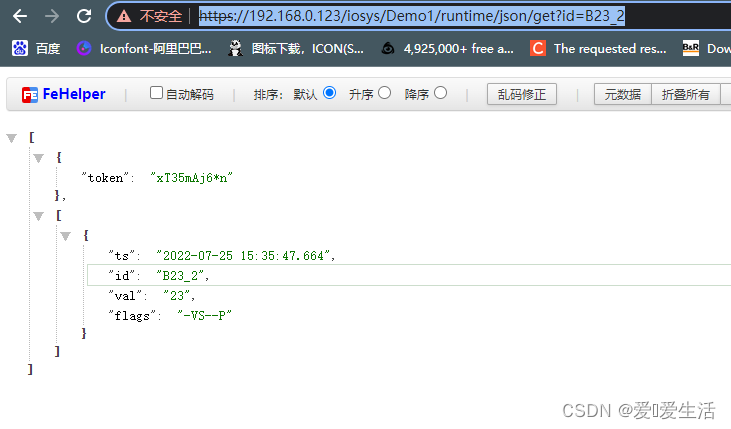
2.APROL iosyshttp接口说明
https://192.168.0.123/iosys/Demo1/runtime/json/get?id=B23_2
192.168.0.123----为APROL的ip地址
Demo1--------------为APROL的项目名称
runtime--------------为APROL的runtime
json ------------------为格式为json
get?id=B23_2 -----为get请求 参数为id 内容为B23_2(也就是APROL中CFC程序中的变量)
3.创建Python Flask项目
代码如下(示例):
目录
static
-------------css
-------------font
-------------js
-----------------------echarts.min.js
-----------------------jquery.js
templates
----------qqqq.html
app.py
python代码部分
#!/usr/bin/python
# -*- coding: UTF-8 -*-
import json
import httplib
from flask import Flask,render_template
app = Flask(__name__)
def aproliosys(aprol_key):
    httpClient = None
    url = '/iosys/Demo1/runtime/json/get?id='+aprol_key
    try:

        httpClient = httplib.HTTPSConnection('localhost',443, timeout=30)
        httpClient.request("GET",url)
        response = httpClient.getresponse()
        data = response.read().decode('utf-8')
        jsonData = json.loads(data)
        iosys_val = jsonData[1][0]['val']
        print(jsonData[1][0]['val'])
        return iosys_val
    except Exception:
        pass
    finally:
        if httpClient:
            httpClient.close()
#html路径
@app.route('/charts')
def charts():
    return render_template("qqqq.html")#访问template目录下的qqqq.html文件
#cfc变量数值
@app.route('/val')
def cms():
    val = aproliosys('B23_2')
    return val
if __name__ == "__main__":
    app.run(debug=True,port=5000)
qqqq.html代码部分
<html>
<head>
<meta charset="UTF-8" />
<body style="background-color:#1D1F26;">
</body>
<title>Highcharts</title>
<script src="../static/js/echarts.min.js"></script>
<script src="../static/js/jquery.min.js"></script>
</head>
<body>
    <div id="container" style="width: 350px; height: 250px;display: inline-block;background-color: #1D1F26;"></div>
<script>
var myChart = echarts.init(document.getElementById('container'));
var    option = {
    tooltip: {
        trigger: 'item',formatter: '{a} <br/>{b}: {c} ({d}%)'
    },
    legend: {
        orient: 'vertical',x:300,y: 'bottom',show:false,fontSize: '20',
    },
    series: [
        {
            name: '能耗',type: 'pie',radius: ['50%', '70%'],avoidLabelOverlap: false,
            itemStyle: {
                borderRadius: 10,borderColor: '#1d1f26',borderWidth: 2
            },
            label: {
                show: false,position: 'center'
            },
            emphasis: {
                label: {
                    show: true,fontSize: '20',fontWeight: 'bold'
                }
            },
            labelLine: {
                show: false
            },
            data: []
        }
    ]
};
myChart.setOption(option);
</script>
<script>
    function getsqlim300(){
    var data1 = [];
    $.ajax({
      url:"/val",//访问的是python 代码部分中的val路由 @app.route('/val')
      timeout:10000,
      success:function(dict){
         console.log(dict);
         data1.push(
            {value: parseFloat(dict),name: 'B23_2'},
        );
         option.series[0].data=data1;//更新series中的data[]
         myChart.setOption(option)
      },error:function(){
        alert("发送失败")
      }
    })
  }
  setTimeout(getsqlim300,1000)//会调用一次函数
  setInterval(getsqlim300,5000)//每过5秒调用一次函数获取cfc中的变量值
</script>
</body>
</html>
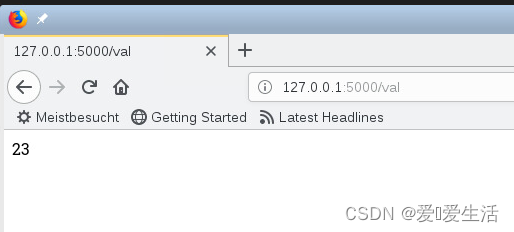
4.python falsk代码数据交互
访问127.0.0.1:5000/val 查看获取数据状态
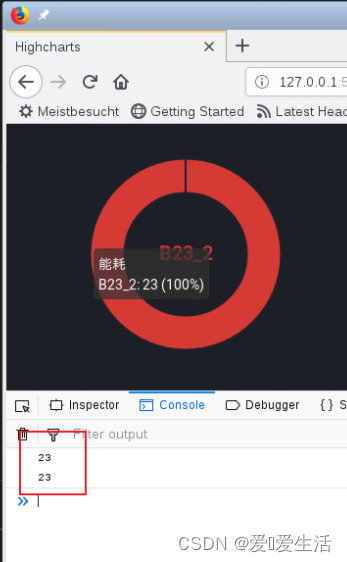
访问127.0.0.1:500/charts查看图表状态
5.嵌入APROL画面
使用画图里的TextView控件嵌入,输入flask的游标网址
如果用上方的方法那么下方地址应为127.0.0.1:500/charts


6.开机自启
进入etc/init.d/boot.local
加入python app存放路径/app.py


 被折叠的 条评论
为什么被折叠?
被折叠的 条评论
为什么被折叠?
 到【灌水乐园】发言


