


1、环境准备
1.1 准备至少三虚拟机
- 内存推荐4g,不够可稍微降低
- 这里我准备了server5,server6,server7,server13
- server5做ES master
- server6,7做集群成员(实验)
- server13运行kibana+logstash

1.2 开启集群并保证实验环境启动正常
[root@server5 ~]# vim /etc/elasticsearch/elasticsearch.yml   ##编辑配置文件,紧接这xpack实验做
[root@server5 ~]# systemctl start elasticsearch.service   ##启动es服务,每个节点都要启动
[root@server5 ~]# cat /var/log/elasticsearch/my-es.log    ##查看日志信息,看是否启动成功
[root@server5 elasticsearch-head-master]# pwd
/root/elasticsearch-head-master
[root@server5 elasticsearch-head-master]# cnpm run start &

[root@server5 ~]# rm -fr /var/lib/elasticsearch/nodes/  ##如果因为之前的残留文件出错,可以删除数据目录在重新启动


可以看到集群启动正常

1.3 server13运行正常

2、部署metricebeat
2.1 进入kibana后台(server13)打开metricbeat数据采集

按照说明安装metricbeat

2.2 安装metricbeat
1.下载rpm安装包
wget https://artifacts.elastic.co/downloads/beats/metricbeat/metricbeat-7.6.1-x86_64.rpm
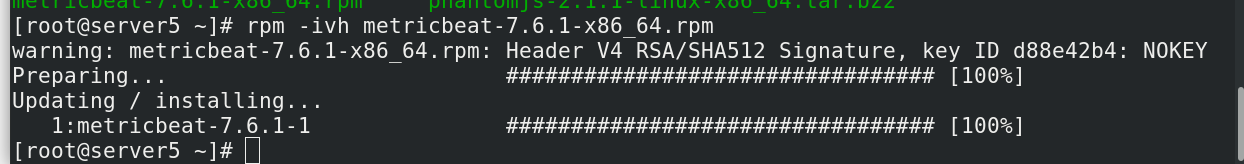
2.安装
rpm -ivh metricbeat-7.6.1-x86_64.rpm ## 每个节点都要安装
2.3 在 Metricbeat 中启用并配置 Elasticsearch x-pack 模块
默认情况下,模块从 http://localhost:9200 收集 Elasticsearch 指标。如果本地服务器有不同的地址,请在 modules.d/elasticsearch-xpack.yml 中将其添加到主机设置。
启用x-pack 模块
[root@server5 ~]# metricbeat modules enable elasticsearch-xpack  #启用x-pack 模块,每个节点都要启用
[root@server5 ~]# metricbeat modules list                        #查看启动模块和未启动模块
Enabled:
elasticsearch-xpack
system

Disabled:
activemq
aerospike
apache
appsearch
aws
azure
beat
beat-xpack
ceph
cockroachdb
consul
coredns
couchbase
couchdb
docker
dropwizard
elasticsearch
envoyproxy
etcd
golang
googlecloud
graphite
haproxy
http
jolokia
kafka
kibana
kibana-xpack
kubernetes
kvm
logstash
logstash-xpack
memcached
mongodb
mssql
munin
mysql
nats
nginx
oracle
php_fpm
postgresql
prometheus
rabbitmq
redis
sql
stan
statsd
tomcat
traefik
uwsgi
vsphere
windows
zookeeper

编辑x-pack文件
[root@server5 metricbeat]# vim modules.d/elasticsearch-xpack.yml
[root@server5 metricbeat]# pwd
/etc/metricbeat

2.4 配置 Metricbeat 以发送至监测集群
修改 metricbeat.yml 以设置连接信息。
[root@server5 metricbeat]# pwd
/etc/metricbeat
[root@server5 metricbeat]# vim metricbeat.yml

output.elasticsearch:
  hosts: ["http://localhost:9200"] ## Monitoring cluster

  # Optional protocol and basic auth credentials.
  #protocol: "https"
  username: "elastic"
  password: "westos"

启动服务,去kibana后台等待一会就好
[root@server5 metricbeat]# systemctl start metricbeat.service


以同样的方法配置server6和server7(只需修改host指向172.25.200.5即可)
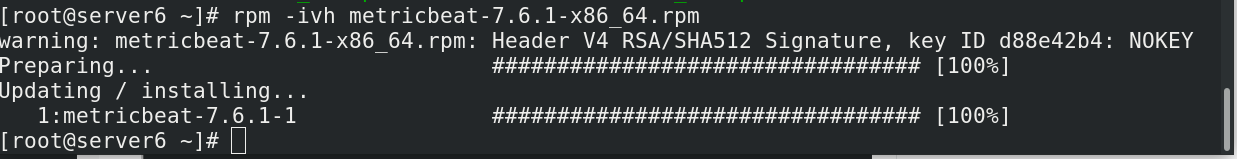
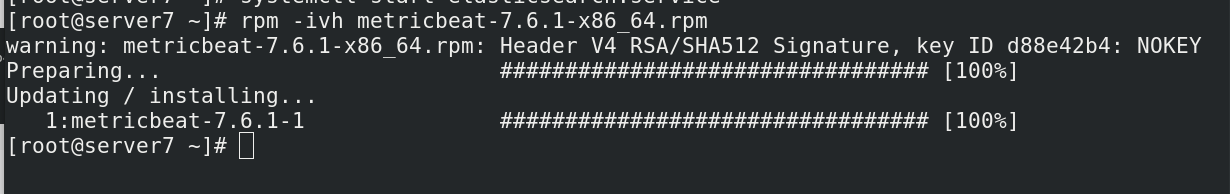
wget https://artifacts.elastic.co/downloads/beats/metricbeat/metricbeat-7.6.1-x86_64.rpm
rpm -ivh metricbeat-7.6.1-x86_64.rpm
metricbeat modules enable elasticsearch-xpack
vim /etc/metricbeat/modules.d/elasticsearch-xpack.yml
vim /etc/metricbeat/metricbeat.yml
systemctl start metricbeat.service
vim /etc/metricbeat/metricbeat.yml

所有节点使用metricbeat采集

禁用内部采集

3、结合filebeat使用
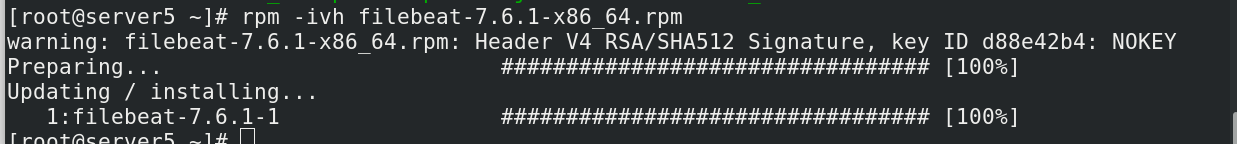
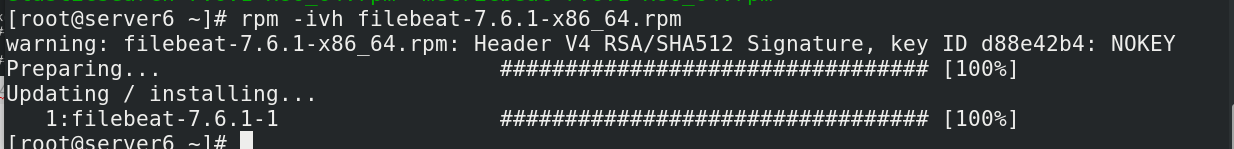
3.1 安装filebeat
3.2 修改配置文件
[root@server5 ~]# filebeat modules list   ##查看模块
[root@server5 ~]# filebeat modules enable elasticsearch  ##允许监控ES日志
[root@server5 filebeat]# pwd
/etc/filebeat
[root@server5 filebeat]# vim modules.d/elasticsearch.yml  ##配置模块信息
[root@server5 filebeat]# cat modules.d/elasticsearch.yml
# Module: elasticsearch
# Docs: https://www.elastic.co/guide/en/beats/filebeat/7.6/filebeat-module-elasticsearch.html

- module: elasticsearch
  # Server log
  server:
    enabled: true

    # Set custom paths for the log files. If left empty,
    # Filebeat will choose the paths depending on your OS.
    var.paths:
      - /var/log/elasticsearch/*.log          # Plain text logs
      - /var/log/elasticsearch/*_server.json  # JSON logs

  gc:
    enabled: true
    # Set custom paths for the log files. If left empty,
    # Filebeat will choose the paths depending on your OS.
    var.paths:
      - /var/log/elasticsearch/gc.log.[0-9]*
      - /var/log/elasticsearch/gc.log

  audit:
    enabled: true
    # Set custom paths for the log files. If left empty,
    # Filebeat will choose the paths depending on your OS.
    var.paths:
      - /var/log/elasticsearch/*_access.log  # Plain text logs
      - /var/log/elasticsearch/*_audit.json  # JSON logs

  slowlog:
    enabled: true
    # Set custom paths for the log files. If left empty,
    # Filebeat will choose the paths depending on your OS.
    var.paths:
      - /var/log/elasticsearch/*_index_search_slowlog.log     # Plain text logs
      - /var/log/elasticsearch/*_index_indexing_slowlog.log   # Plain text logs
      - /var/log/elasticsearch/*_index_search_slowlog.json    # JSON logs
      - /var/log/elasticsearch/*_index_indexing_slowlog.json  # JSON logs

  deprecation:
    enabled: true
    # Set custom paths for the log files. If left empty,
    # Filebeat will choose the paths depending on your OS.
    var.paths:
      - /var/log/elasticsearch/*_deprecation.log   # Plain text logs
      - /var/log/elasticsearch/*_deprecation.json  # JSON logs


[root@server5 filebeat]# vim filebeat.yml   ##编辑主配置信息
#-------------------------- Elasticsearch output ------------------------------
output.elasticsearch:
  # Array of hosts to connect to.
  hosts: ["172.25.200.5:9200"]

  # Protocol - either `http` (default) or `https`.
  #protocol: "https"

  # Authentication credentials - either API key or username/password.
  #api_key: "id:api_key"
  username: "elastic"
  password: "westos"

3.3 启动filebeat
[root@server5 filebeat]# systemctl start filebeat.service
查看采集日志

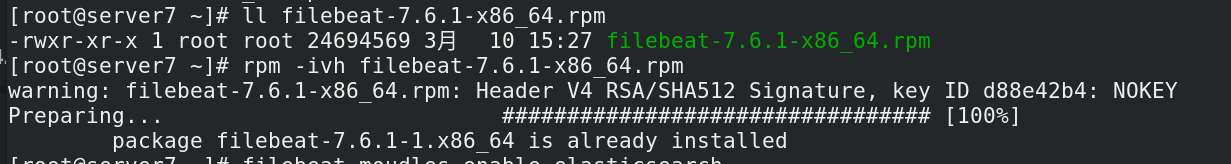
3.4 将所有节点部署filebeat
将配置文件传过去,然后在节点启动filebeat即可

可以在日志界面看任意节点的采集日志


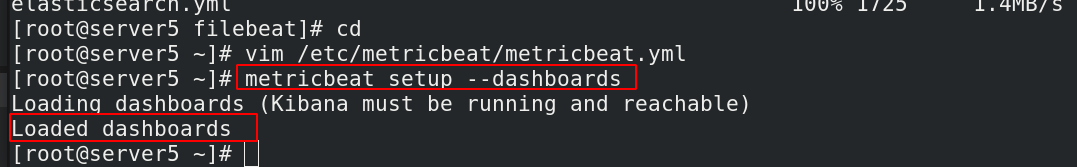
3.5 metricbeat导入dashboards(仪表板)模板
[root@server5 ~]# cd /etc/metricbeat/
[root@server5 metricbeat]# vim metricbeat.yml   ##设置为kibana的ip
[root@server5 metricbeat]# metricbeat setup --dashboards  ##前提得打开kibana连接,并且kibana是运行的
vim metricbeat.yml

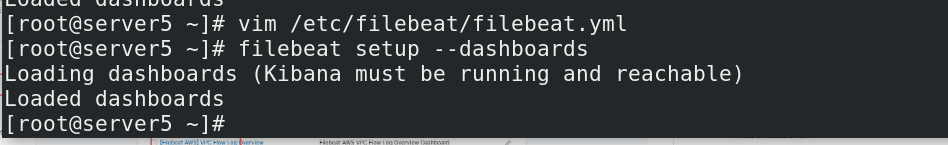
3.6 filebeat导入dashboard模板(与3.5神相似)
vim /etc/filebeat/filebeat.yml


4、filebeat结合logstash
4.1 filebeat配置文件
[root@server5 ~]# vim /etc/filebeat/filebeat.yml
[root@server5 ~]# filebeat modules disable elasticsearch
Disabled elasticsearch

没有安装apache服务安装一下
[root@server5 ~]# yum install -y httpd
[root@server5 ~]# echo server5 > /var/www/html/index.html
[root@server5 ~]# systemctl start httpd
[root@server5 ~]# curl localhost

重启filebeat服务
[root@server5 ~]# systemctl restart filebeat.service


4.2 配置logstash主机(server13)
[root@server13 ~]# rpm -ivh jdk-8u171-linux-x64.rpm
[root@server13 ~]# rpm -ivh logstash-7.6.1.rpm

[root@server13 conf.d]# pwd
/etc/logstash/conf.d
[root@server13 conf.d]# vim apache.conf
[root@server13 conf.d]# cat apache.conf
input {
  beats {
    port => 5044    ##监控5044端口
  }
}
filter {
  grok {
        match => { "message" => "%{HTTPD_COMBINEDLOG}" }
      }

}
output {
  elasticsearch {
    hosts => ["http://172.25.200.5:9200"]
    index => "apache-log1-%{+YYYY.MM.dd}"
    user => "elastic"
    password => "westos"
  }
}
[root@server13 conf.d]# /usr/share/logstash/bin/logstash -f /etc/logstash/conf.d/apache.conf

[root@server13 conf.d]# netstat -ntlp | grep 5044
tcp6       0      0 :::5044                 :::*                    LISTEN      12069/java
[root@server13 conf.d]# kill -9 12069
[root@server13 conf.d]# logstash -f  apache.conf


 730
730


 被折叠的 条评论
为什么被折叠?
被折叠的 条评论
为什么被折叠?
 到【灌水乐园】发言


